| Param | Original file | Final file |
|---|---|---|
| Filename | modeM0/AS1A07_148T05_9000003424_23172cztM0_level2.evt | modeM0/AS1A07_148T05_9000003424_23172cztM0_level2_quad_clean.evt |
| Size (bytes) | 568,728,000 | 72,167,040 |
| Size | 542.4 MB | 68.8 MB |
| Events in quadrant A | 3,412,826 | 440,315 |
| Events in quadrant B | 3,692,236 | 448,730 |
| Events in quadrant C | 4,511,721 | 433,754 |
| Events in quadrant D | 5,178,453 | 420,554 |
| Mode SS | |||
|---|---|---|---|
| Quadrant | BADHDUFLAG | Total packets | Discarded packets |
| A | 0 | 128 | 0 |
| B | 0 | 128 | 0 |
| C | 0 | 128 | 2 |
| D | 0 | 128 | 0 |
| Mode M0 | |||
|---|---|---|---|
| Quadrant | BADHDUFLAG | Total packets | Discarded packets |
| A | 0 | 14402 | 5 |
| B | 0 | 15219 | 2 |
| C | 0 | 17566 | 11 |
| D | 0 | 19781 | 18 |
| Mode M9 | |||
|---|---|---|---|
| Quadrant | BADHDUFLAG | Total packets | Discarded packets |
| A | 0 | 15 | 1 |
| B | 0 | 17 | 2 |
| C | 0 | 16 | 0 |
| D | 0 | 16 | 1 |
| Quadrant | Total seconds | Saturated seconds | Saturation percentage |
|---|---|---|---|
| A | 6336 | 86 | 1.357323% |
| B | 6337 | 131 | 2.067224% |
| C | 6334 | 380 | 5.999368% |
| D | 6332 | 583 | 9.207202% |
Noise dominated data is calculated using 1-second bins in cleaned event files. If a bin has >2000 counts, and if more than 50% of those come from <1% of pixels, then it is considered to be noise-dominated and hence unusable.
| Quadrant | # 1 sec bins | Bins with >0 counts | Bins with >2000 counts | High rate bins dominated by noise | Noise dominated (total time) | Noise dominated (detector-on time) | Marked lightcurve |
|---|---|---|---|---|---|---|---|
| A | 7557 | 6337 | 2 | 2 | 0.03% | 0.03% | 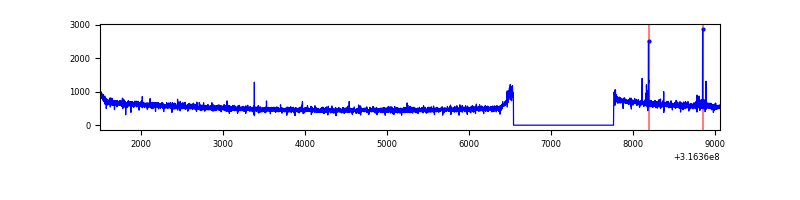 |
| B | 7557 | 6337 | 4 | 4 | 0.05% | 0.06% | 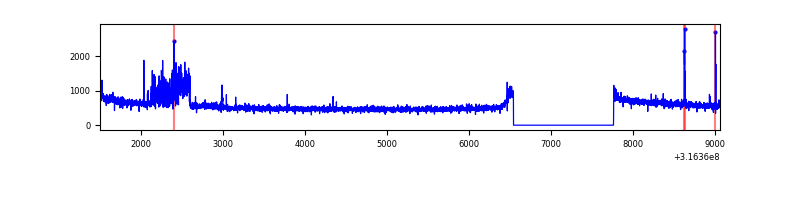 |
| C | 7557 | 6337 | 70 | 70 | 0.93% | 1.10% | 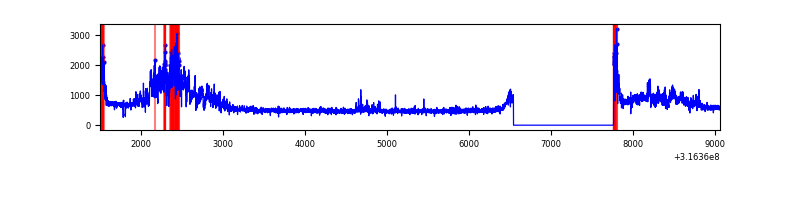 |
| D | 7557 | 6337 | 349 | 349 | 4.62% | 5.51% | 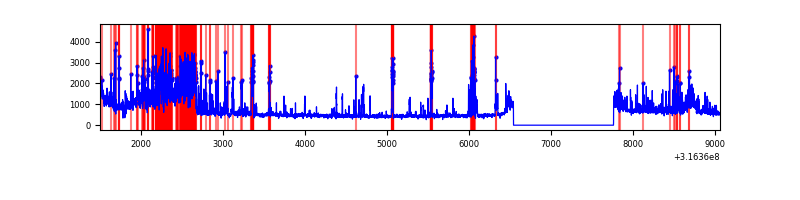 |
Top three noisy pixels from each quadrant. If the there are fewer than three noisy pixels in the level2.evt file, extra rows are filled as -1
| Pixel properties | Quadrant properties | ||||||
|---|---|---|---|---|---|---|---|
| Quadrant | DetID | PixID | Counts | Sigma | Mean | Median | Sigma |
| A | 6 | 16 | 25677 | 140.16 | 879 | 863 | 177.0 |
| A | 13 | 254 | 9745 | 50.17 | 879 | 863 | 177.0 |
| A | 0 | 226 | 7660 | 38.39 | 879 | 863 | 177.0 |
| B | 0 | 190 | 230608 | 1389.71 | 879 | 860 | 165.3 |
| B | 0 | 245 | 21218 | 123.14 | 879 | 860 | 165.3 |
| B | 12 | 111 | 18751 | 108.22 | 879 | 860 | 165.3 |
| C | 8 | 208 | 853086 | 4326.89 | 846 | 855 | 197.0 |
| C | 0 | 10 | 190291 | 961.79 | 846 | 855 | 197.0 |
| C | 14 | 238 | 133930 | 675.64 | 846 | 855 | 197.0 |
| D | 7 | 238 | 1215908 | 5992.0 | 848 | 826 | 202.8 |
| D | 12 | 233 | 294349 | 1447.47 | 848 | 826 | 202.8 |
| D | 1 | 52 | 231386 | 1136.97 | 848 | 826 | 202.8 |
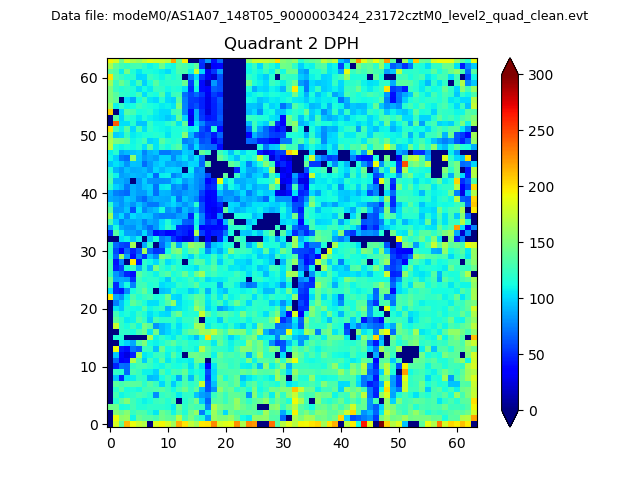
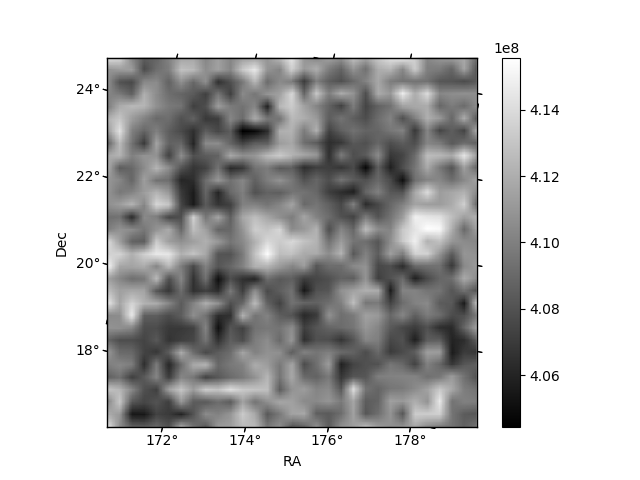
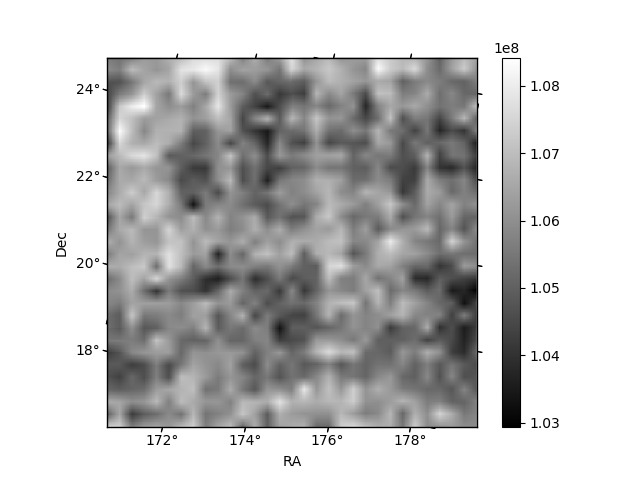
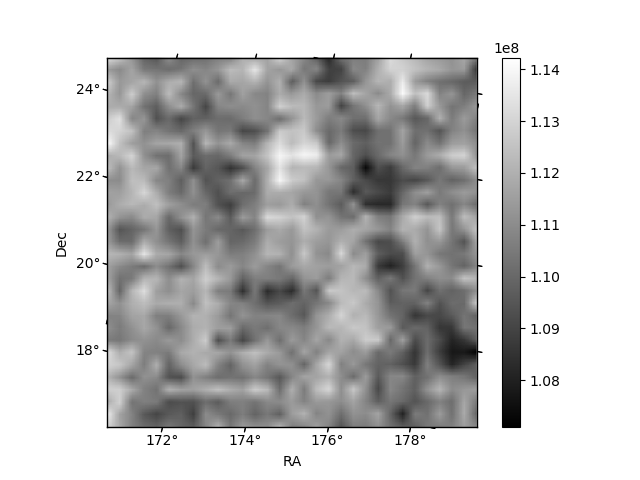
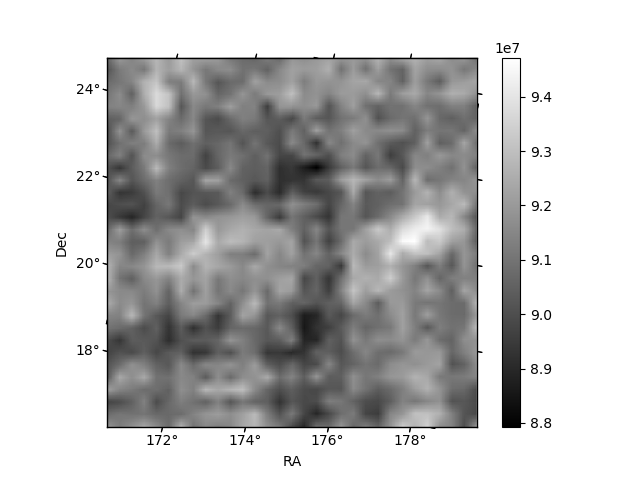
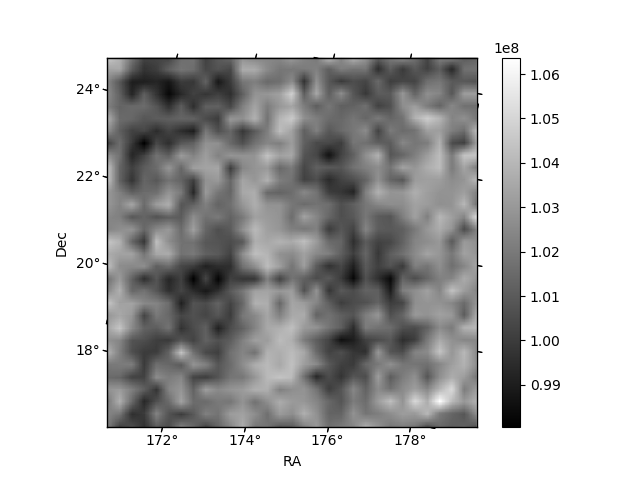
Histogram calculated using DETX and DETY for each event in the final _common_clean file
| Quadrant A | 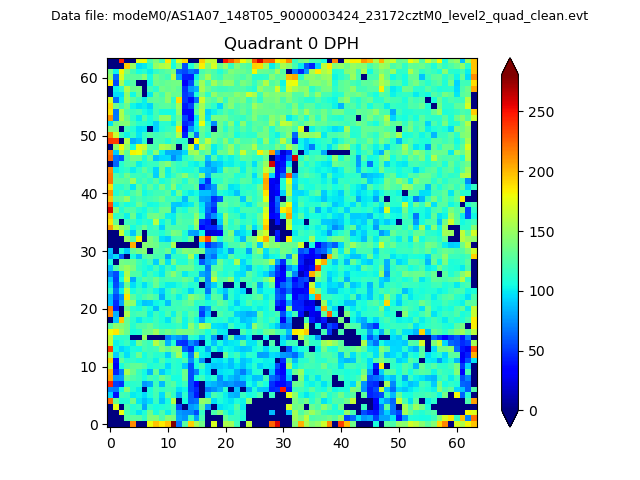 |
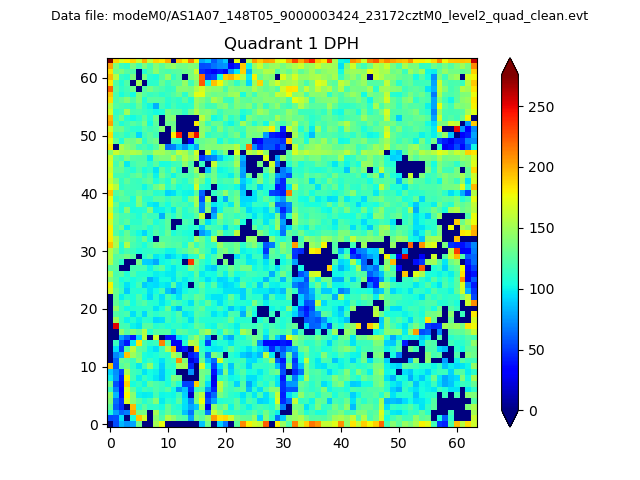 |
Quadrant B |
|---|---|---|---|
| Quadrant D | 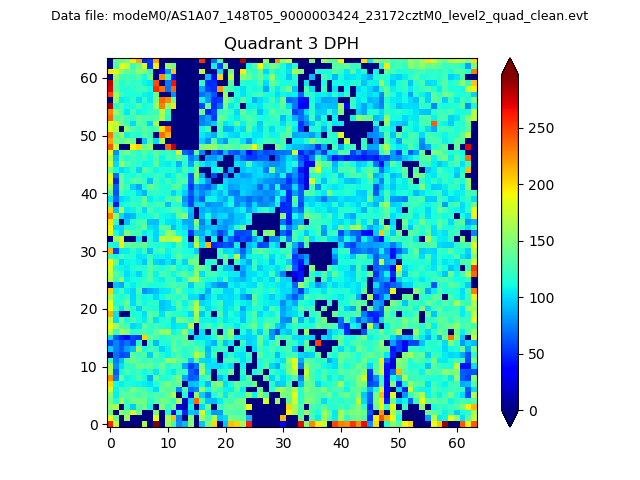 |
 |
Quadrant C |
| Plot type | Count rate plots | Images |
|---|---|---|
| Comparison with Poisson distribution Blue bars denote a histogram of data divided into 1 sec bins. Red curve is a Poisson curve with rate = median count rate of data. |
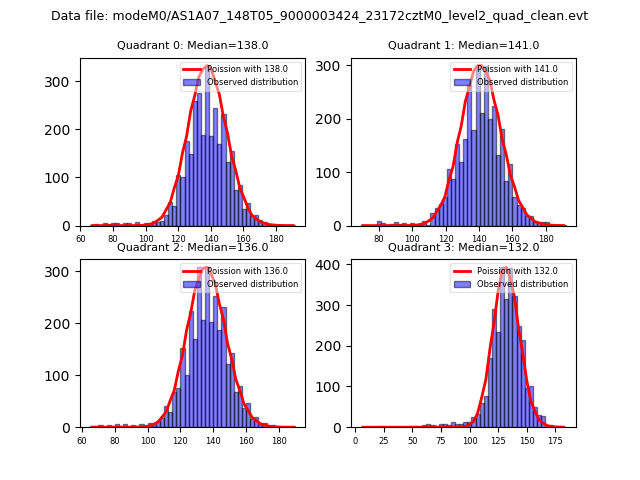 |
 |
| Quadrant-wise count rates Data is divided into 100 sec bins |
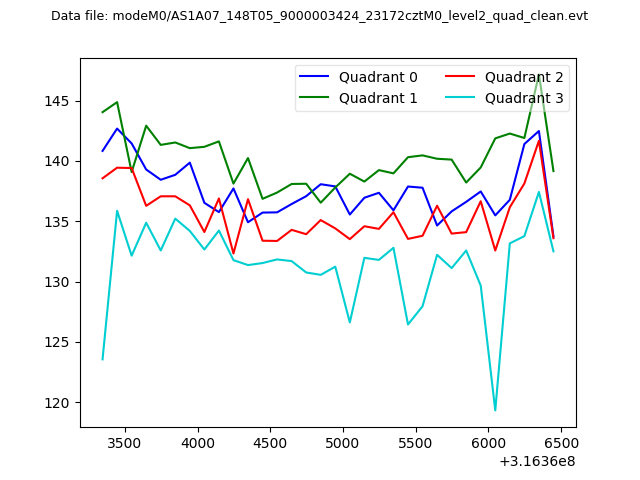 |
|
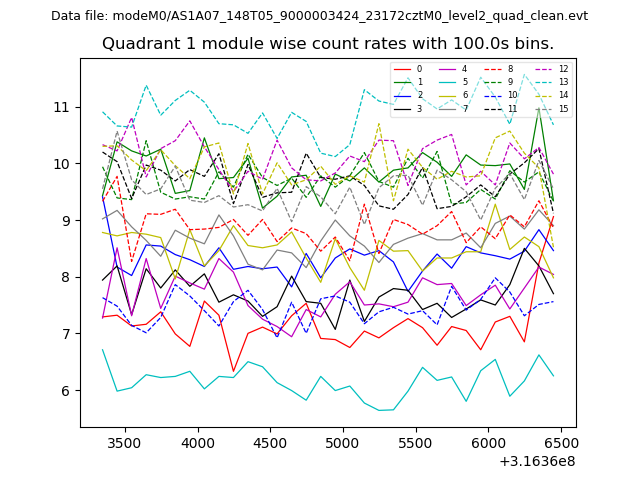
| Module-wise count rates for Quadrant A Data is divided into 100 sec bins |
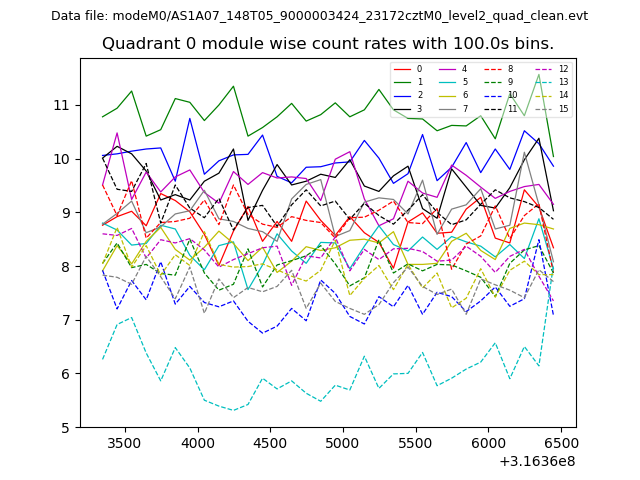 |
 |
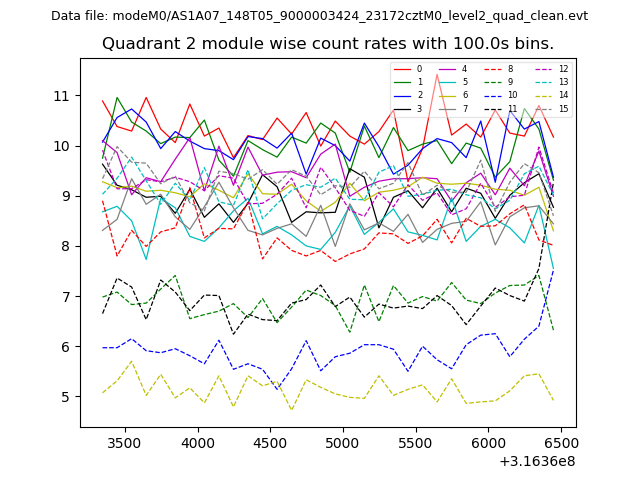
| Module-wise count rates for Quadrant B Data is divided into 100 sec bins |
 |
 |
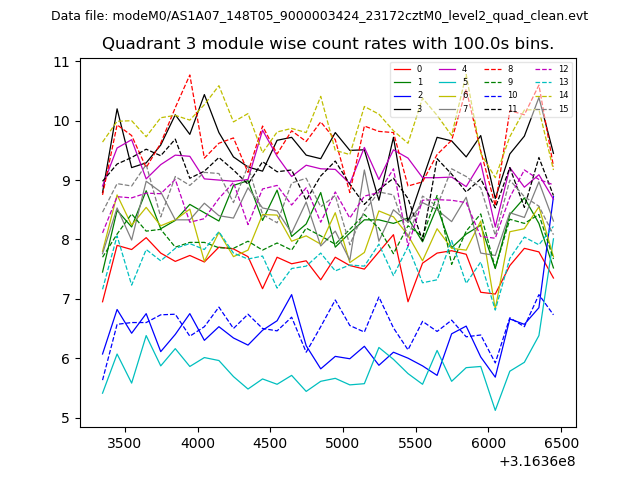
| Module-wise count rates for Quadrant C Data is divided into 100 sec bins |
 |
 |
| Module-wise count rates for Quadrant D Data is divided into 100 sec bins |
 |
 |
| Parameter | Plot |
|---|---|
| CZT HV Monitor | 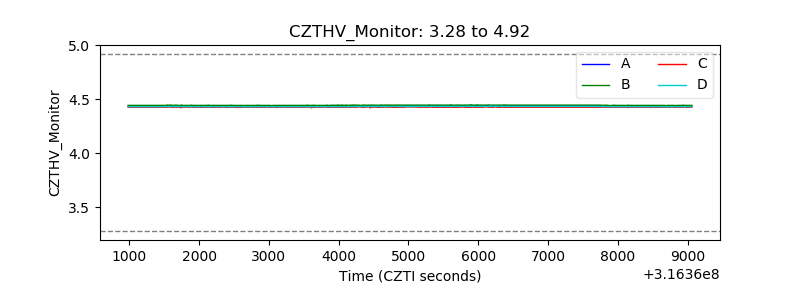 |
| D_VDD | 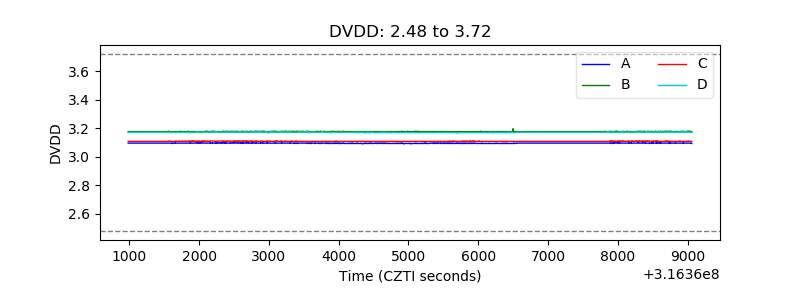 |
| Temperature 1 | 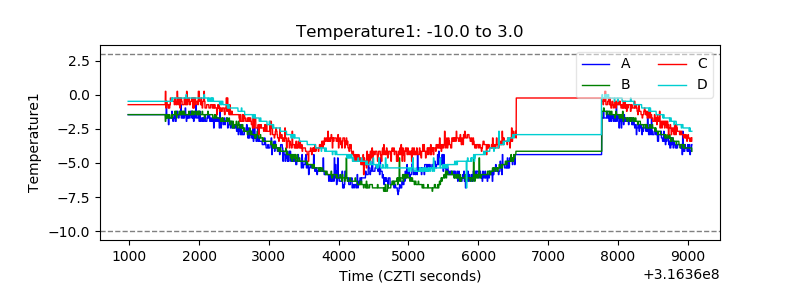 |
| Veto HV Monitor | 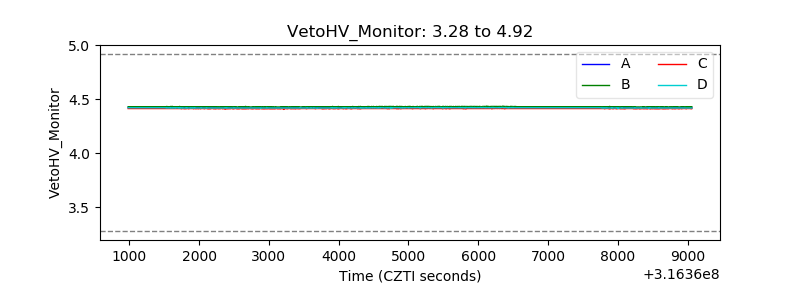 |
| Veto LLD |  |
| Alpha Counter |  |
| _CPM_Rate | 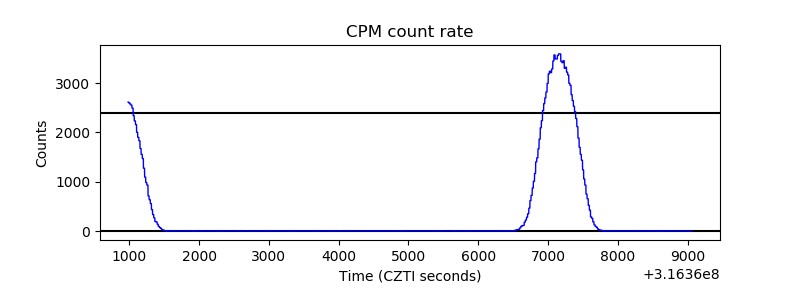 |
| CZT Counter | 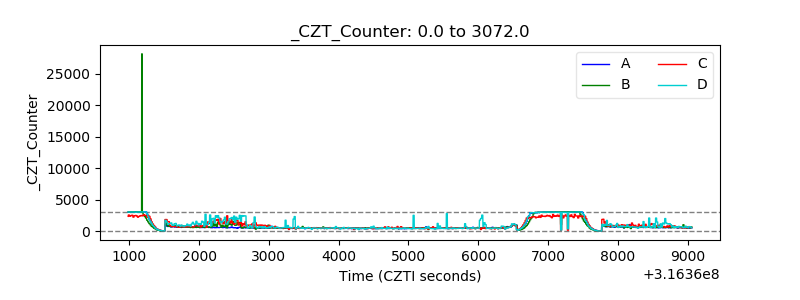 |
| +2.5 Volts monitor |  |
| +5 Volts monitor |  |
| _ROLL_ROT | 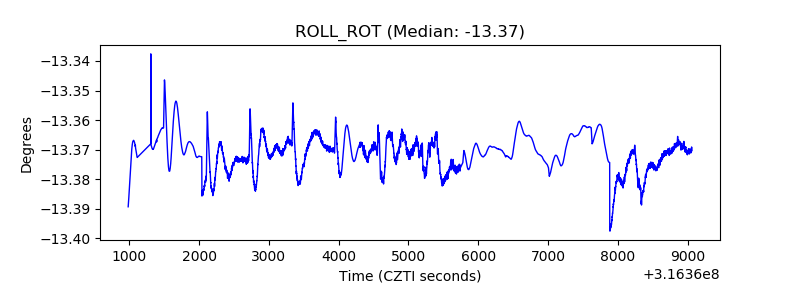 |
| _Roll_DEC | 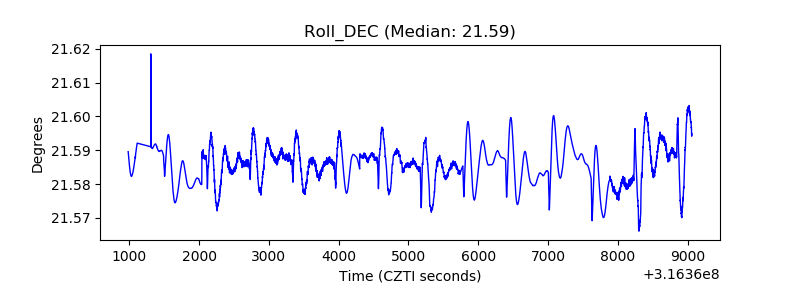 |
| _Roll_RA | 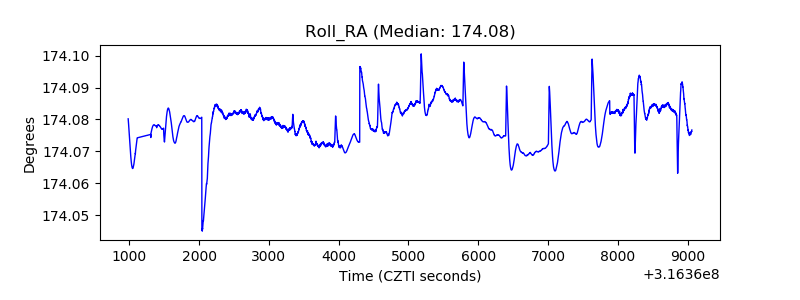 |
| Veto Counter | 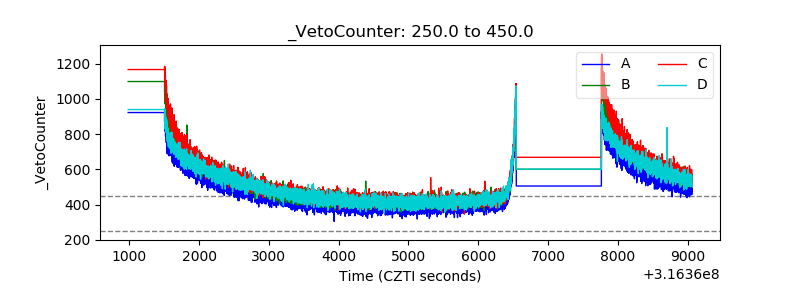 |