| Param | Original file | Final file |
|---|---|---|
| Filename | modeM0/AS1A07_148T05_9000003424_23173cztM0_level2.evt | modeM0/AS1A07_148T05_9000003424_23173cztM0_level2_quad_clean.evt |
| Size (bytes) | 538,608,960 | 87,681,600 |
| Size | 513.7 MB | 83.6 MB |
| Events in quadrant A | 3,672,293 | 555,187 |
| Events in quadrant B | 3,519,778 | 571,782 |
| Events in quadrant C | 4,279,408 | 554,016 |
| Events in quadrant D | 4,414,550 | 535,767 |
| Mode SS | |||
|---|---|---|---|
| Quadrant | BADHDUFLAG | Total packets | Discarded packets |
| A | 0 | 128 | 0 |
| B | 0 | 128 | 0 |
| C | 0 | 128 | 0 |
| D | 0 | 128 | 0 |
| Mode M0 | |||
|---|---|---|---|
| Quadrant | BADHDUFLAG | Total packets | Discarded packets |
| A | 0 | 15010 | 2 |
| B | 0 | 14600 | 2 |
| C | 0 | 16664 | 2 |
| D | 0 | 17370 | 2 |
| Mode M9 | |||
|---|---|---|---|
| Quadrant | BADHDUFLAG | Total packets | Discarded packets |
| A | 0 | 20 | 0 |
| B | 0 | 21 | 0 |
| C | 0 | 21 | 0 |
| D | 0 | 21 | 0 |
| Quadrant | Total seconds | Saturated seconds | Saturation percentage |
|---|---|---|---|
| A | 6282 | 130 | 2.069405% |
| B | 6282 | 113 | 1.798790% |
| C | 6282 | 320 | 5.093919% |
| D | 6282 | 284 | 4.520853% |
Noise dominated data is calculated using 1-second bins in cleaned event files. If a bin has >2000 counts, and if more than 50% of those come from <1% of pixels, then it is considered to be noise-dominated and hence unusable.
| Quadrant | # 1 sec bins | Bins with >0 counts | Bins with >2000 counts | High rate bins dominated by noise | Noise dominated (total time) | Noise dominated (detector-on time) | Marked lightcurve |
|---|---|---|---|---|---|---|---|
| A | 7592 | 6283 | 29 | 29 | 0.38% | 0.46% | 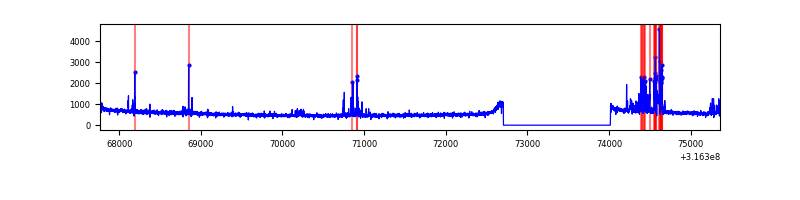 |
| B | 7592 | 6282 | 5 | 5 | 0.07% | 0.08% | 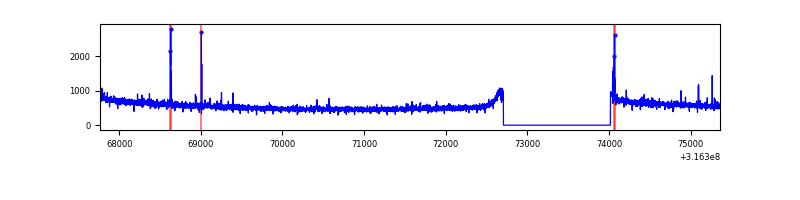 |
| C | 7592 | 6282 | 35 | 35 | 0.46% | 0.56% | 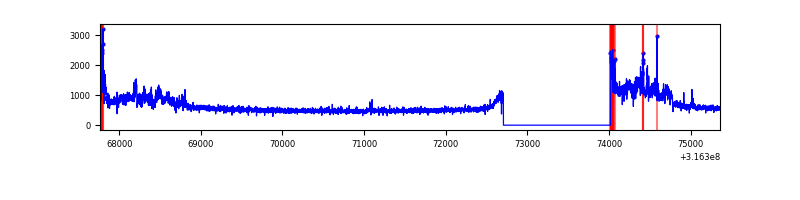 |
| D | 7592 | 6283 | 129 | 129 | 1.70% | 2.05% | 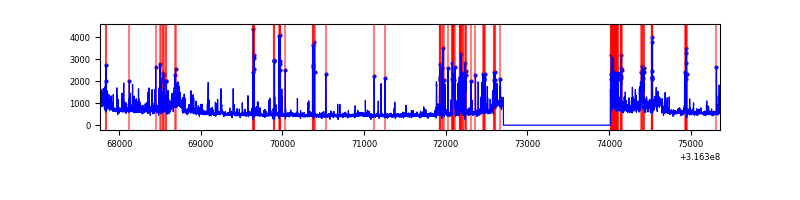 |
Top three noisy pixels from each quadrant. If the there are fewer than three noisy pixels in the level2.evt file, extra rows are filled as -1
| Pixel properties | Quadrant properties | ||||||
|---|---|---|---|---|---|---|---|
| Quadrant | DetID | PixID | Counts | Sigma | Mean | Median | Sigma |
| A | 6 | 16 | 265301 | 1482.9 | 884 | 867 | 178.3 |
| A | 13 | 254 | 9571 | 48.81 | 884 | 867 | 178.3 |
| A | 0 | 226 | 7687 | 38.24 | 884 | 867 | 178.3 |
| B | 0 | 245 | 23637 | 137.15 | 889 | 871 | 166.0 |
| B | 12 | 111 | 18656 | 107.14 | 889 | 871 | 166.0 |
| B | 11 | 111 | 16544 | 94.42 | 889 | 871 | 166.0 |
| C | 8 | 208 | 599534 | 3034.64 | 857 | 869 | 197.3 |
| C | 0 | 10 | 183249 | 924.49 | 857 | 869 | 197.3 |
| C | 14 | 238 | 135749 | 683.71 | 857 | 869 | 197.3 |
| D | 7 | 238 | 727376 | 3488.27 | 868 | 848 | 208.3 |
| D | 1 | 52 | 173022 | 826.66 | 868 | 848 | 208.3 |
| D | 12 | 233 | 133029 | 634.64 | 868 | 848 | 208.3 |
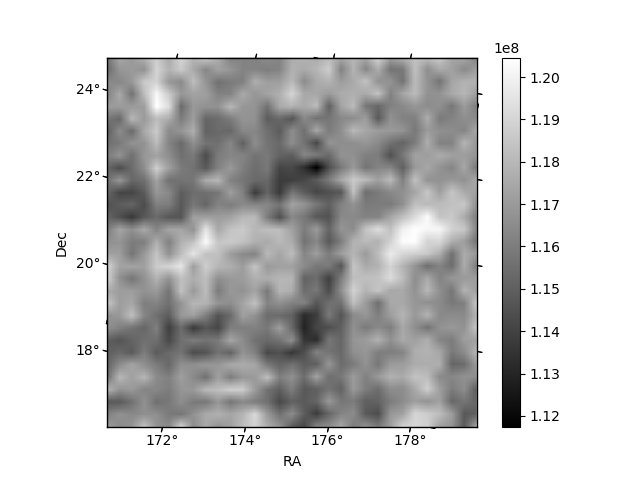
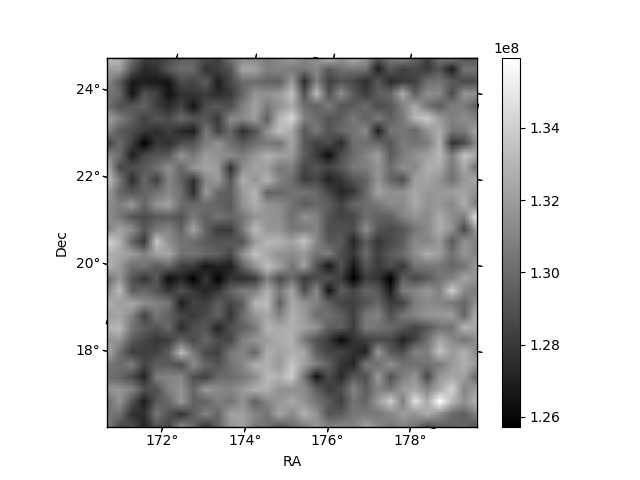
Histogram calculated using DETX and DETY for each event in the final _common_clean file
| Quadrant A |  |
 |
Quadrant B |
|---|---|---|---|
| Quadrant D |  |
 |
Quadrant C |
| Plot type | Count rate plots | Images |
|---|---|---|
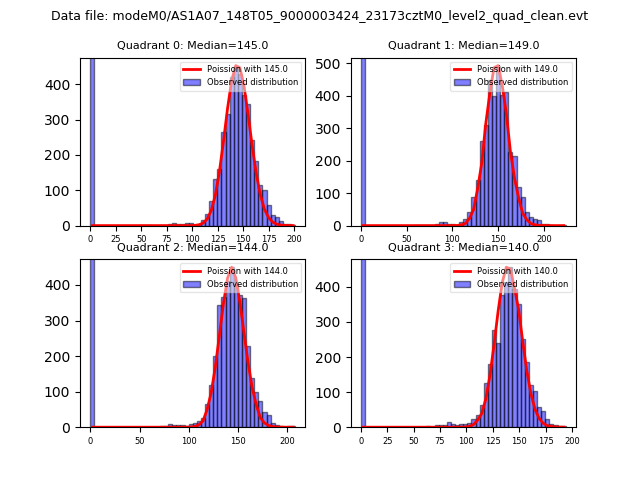
| Comparison with Poisson distribution Blue bars denote a histogram of data divided into 1 sec bins. Red curve is a Poisson curve with rate = median count rate of data. |
 |
 |
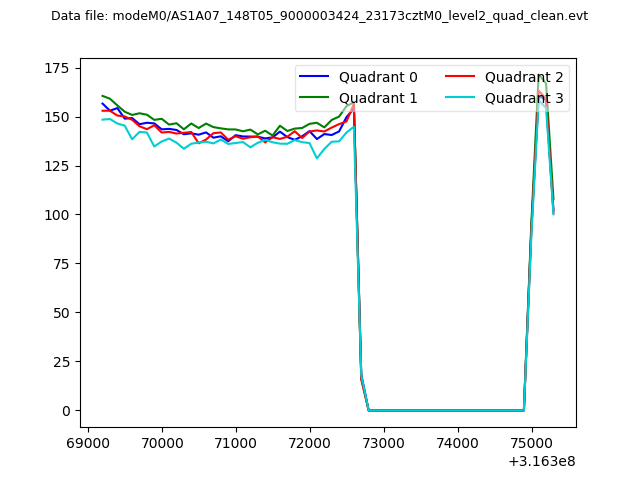
| Quadrant-wise count rates Data is divided into 100 sec bins |
 |
|
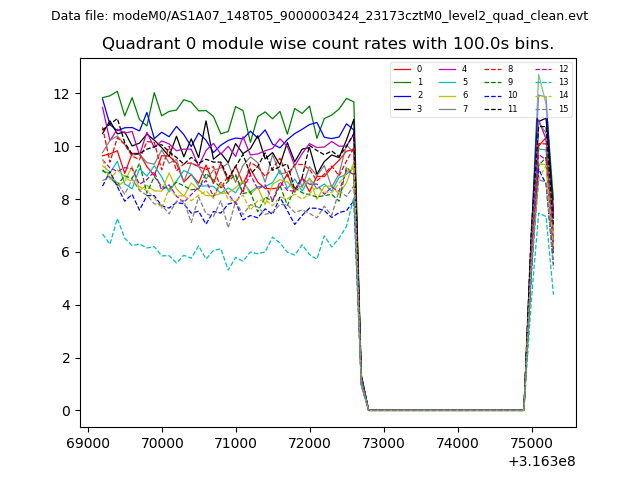
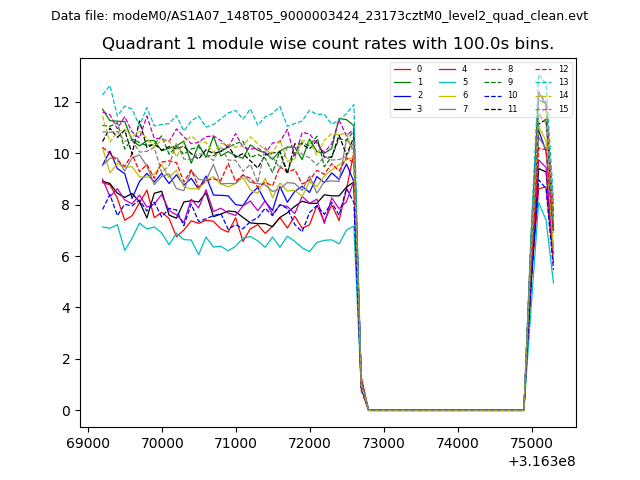
| Module-wise count rates for Quadrant A Data is divided into 100 sec bins |
 |
 |
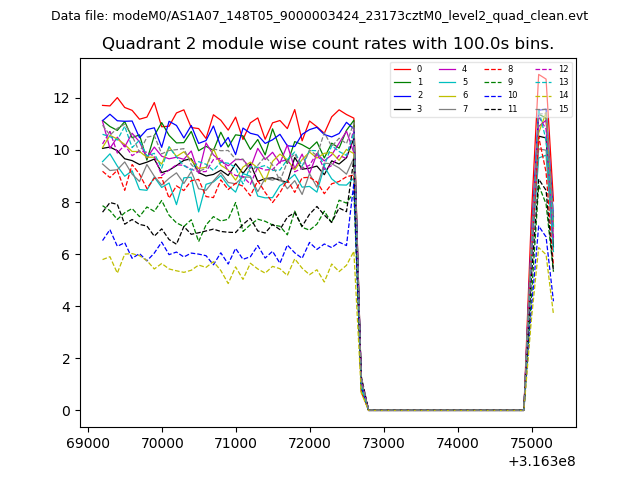
| Module-wise count rates for Quadrant B Data is divided into 100 sec bins |
 |
 |
| Module-wise count rates for Quadrant C Data is divided into 100 sec bins |
 |
 |
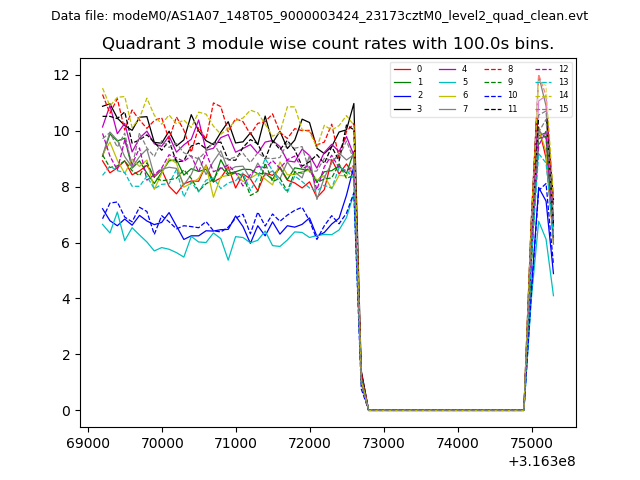
| Module-wise count rates for Quadrant D Data is divided into 100 sec bins |
 |
 |
| Parameter | Plot |
|---|---|
| CZT HV Monitor | 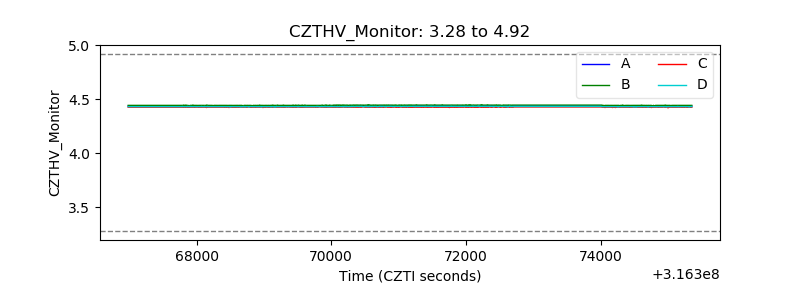 |
| D_VDD | 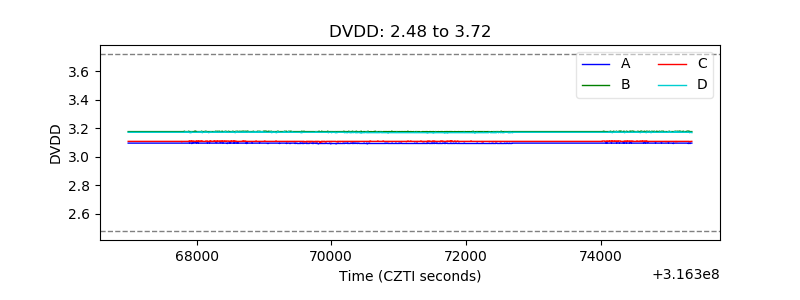 |
| Temperature 1 | 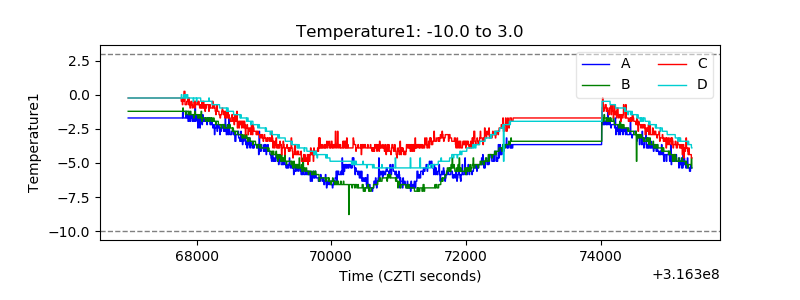 |
| Veto HV Monitor | 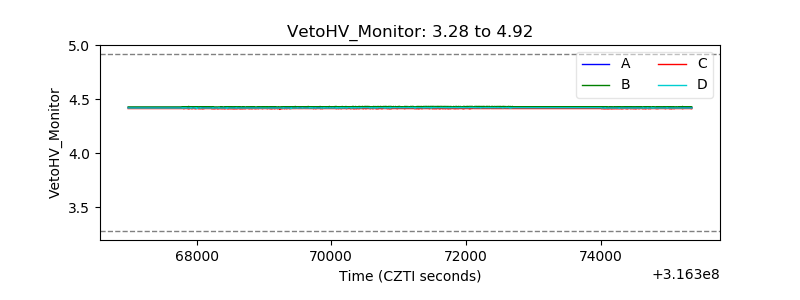 |
| Veto LLD | 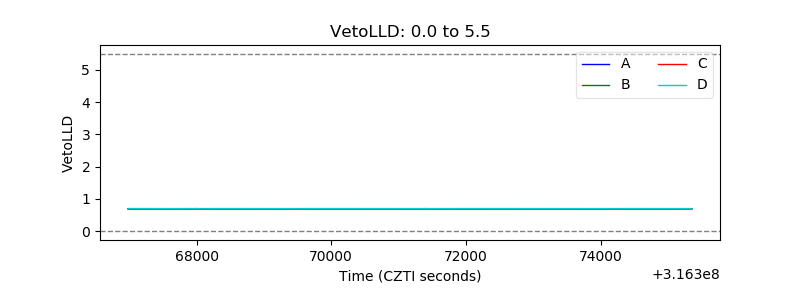 |
| Alpha Counter | 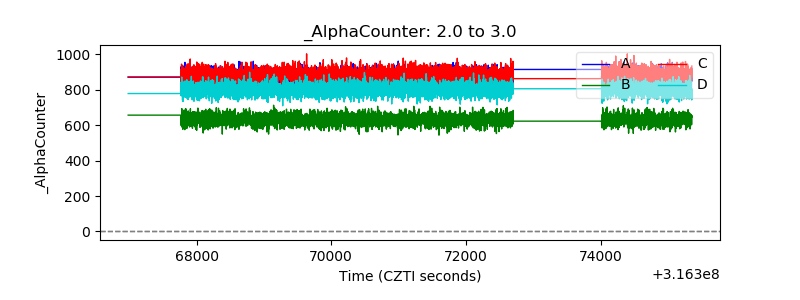 |
| _CPM_Rate | 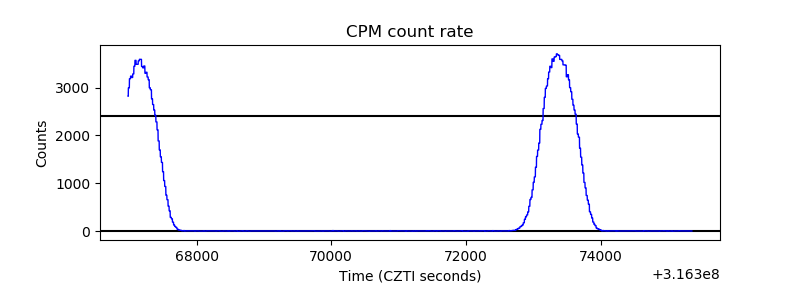 |
| CZT Counter | 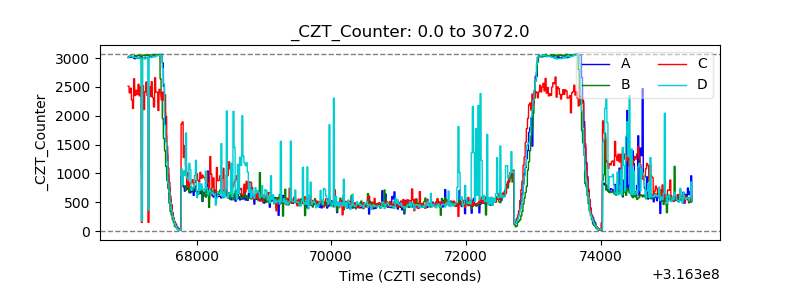 |
| +2.5 Volts monitor |  |
| +5 Volts monitor | 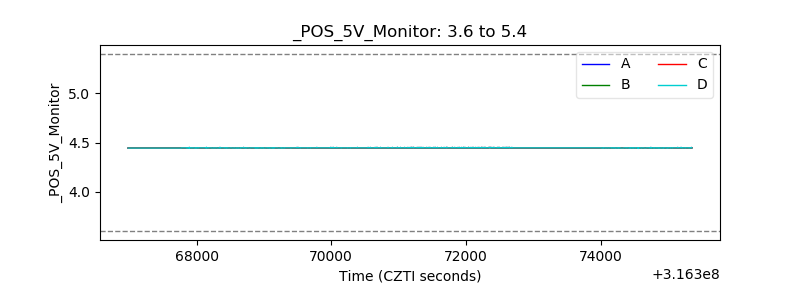 |
| _ROLL_ROT | 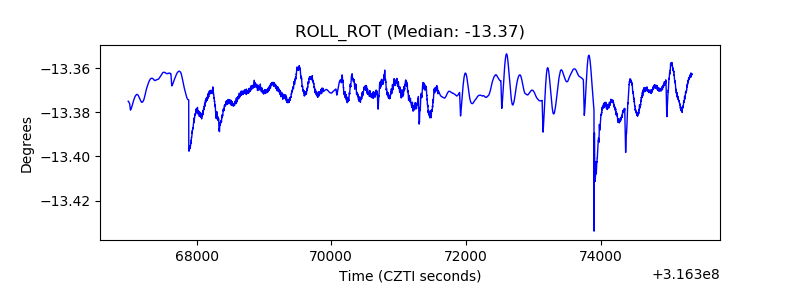 |
| _Roll_DEC | 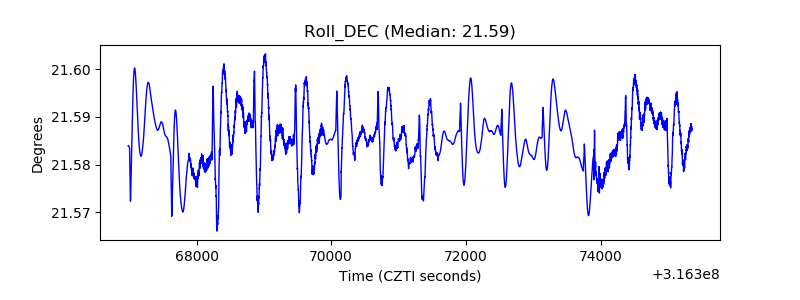 |
| _Roll_RA | 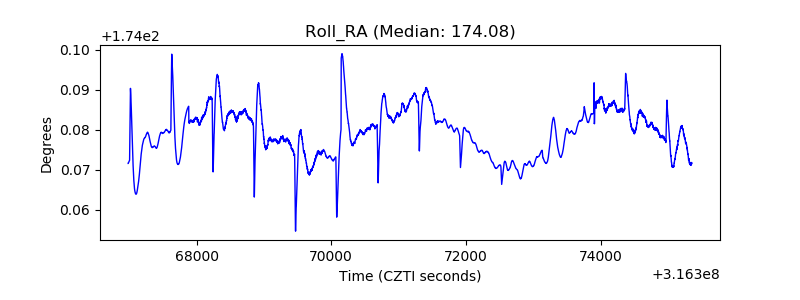 |
| Veto Counter | 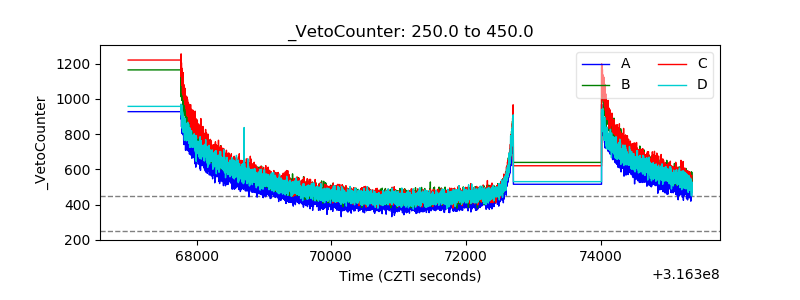 |