| Param | Original file | Final file |
|---|---|---|
| Filename | modeM0/AS1A07_148T05_9000003424_23176cztM0_level2.evt | modeM0/AS1A07_148T05_9000003424_23176cztM0_level2_quad_clean.evt |
| Size (bytes) | 510,632,640 | 102,392,640 |
| Size | 487.0 MB | 97.6 MB |
| Events in quadrant A | 4,271,839 | 658,685 |
| Events in quadrant B | 3,284,079 | 689,991 |
| Events in quadrant C | 3,741,515 | 655,846 |
| Events in quadrant D | 3,725,768 | 642,872 |
| Mode SS | |||
|---|---|---|---|
| Quadrant | BADHDUFLAG | Total packets | Discarded packets |
| A | 0 | 132 | 0 |
| B | 0 | 132 | 0 |
| C | 0 | 132 | 0 |
| D | 0 | 132 | 0 |
| Mode M0 | |||
|---|---|---|---|
| Quadrant | BADHDUFLAG | Total packets | Discarded packets |
| A | 0 | 17016 | 6 |
| B | 0 | 13871 | 2 |
| C | 0 | 15454 | 2 |
| D | 0 | 15386 | 2 |
| Mode M9 | |||
|---|---|---|---|
| Quadrant | BADHDUFLAG | Total packets | Discarded packets |
| A | 0 | 15 | 0 |
| B | 0 | 16 | 0 |
| C | 0 | 16 | 0 |
| D | 0 | 16 | 0 |
| Quadrant | Total seconds | Saturated seconds | Saturation percentage |
|---|---|---|---|
| A | 6504 | 250 | 3.843788% |
| B | 6504 | 66 | 1.014760% |
| C | 6504 | 237 | 3.643911% |
| D | 6504 | 98 | 1.506765% |
Noise dominated data is calculated using 1-second bins in cleaned event files. If a bin has >2000 counts, and if more than 50% of those come from <1% of pixels, then it is considered to be noise-dominated and hence unusable.
| Quadrant | # 1 sec bins | Bins with >0 counts | Bins with >2000 counts | High rate bins dominated by noise | Noise dominated (total time) | Noise dominated (detector-on time) | Marked lightcurve |
|---|---|---|---|---|---|---|---|
| A | 7579 | 6505 | 159 | 159 | 2.10% | 2.44% | 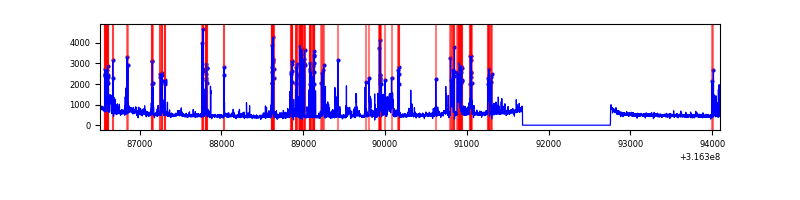 |
| B | 7579 | 6505 | 1 | 1 | 0.01% | 0.02% | 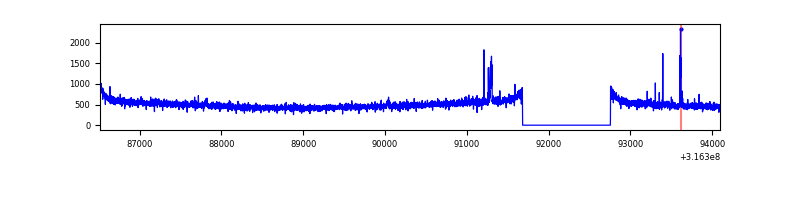 |
| C | 7579 | 6505 | 59 | 59 | 0.78% | 0.91% | 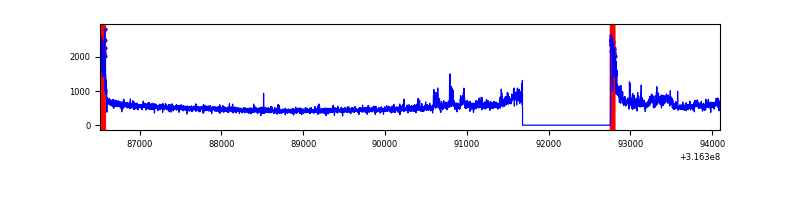 |
| D | 7579 | 6505 | 45 | 45 | 0.59% | 0.69% | 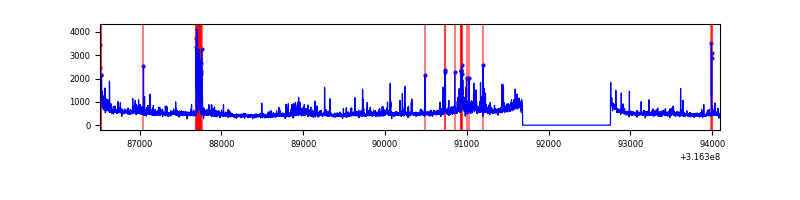 |
Top three noisy pixels from each quadrant. If the there are fewer than three noisy pixels in the level2.evt file, extra rows are filled as -1
| Pixel properties | Quadrant properties | ||||||
|---|---|---|---|---|---|---|---|
| Quadrant | DetID | PixID | Counts | Sigma | Mean | Median | Sigma |
| A | 6 | 16 | 1148570 | 7061.74 | 810 | 794 | 162.5 |
| A | 13 | 254 | 9687 | 54.71 | 810 | 794 | 162.5 |
| A | 3 | 137 | 6906 | 37.6 | 810 | 794 | 162.5 |
| B | 0 | 190 | 31823 | 195.64 | 825 | 807 | 158.5 |
| B | 12 | 111 | 18752 | 113.19 | 825 | 807 | 158.5 |
| B | 11 | 111 | 16692 | 100.2 | 825 | 807 | 158.5 |
| C | 0 | 10 | 529545 | 2889.14 | 785 | 792 | 183.0 |
| C | 14 | 238 | 125175 | 679.64 | 785 | 792 | 183.0 |
| C | 8 | 208 | 10296 | 51.93 | 785 | 792 | 183.0 |
| D | 7 | 238 | 306959 | 1592.67 | 796 | 774 | 192.2 |
| D | 1 | 52 | 170409 | 882.38 | 796 | 774 | 192.2 |
| D | 12 | 233 | 54156 | 277.67 | 796 | 774 | 192.2 |
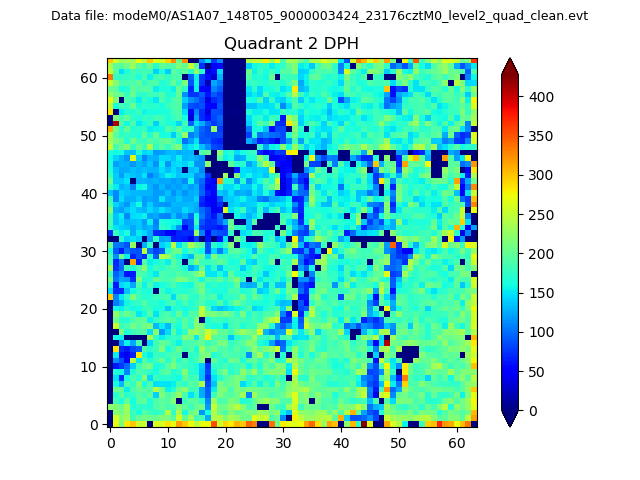
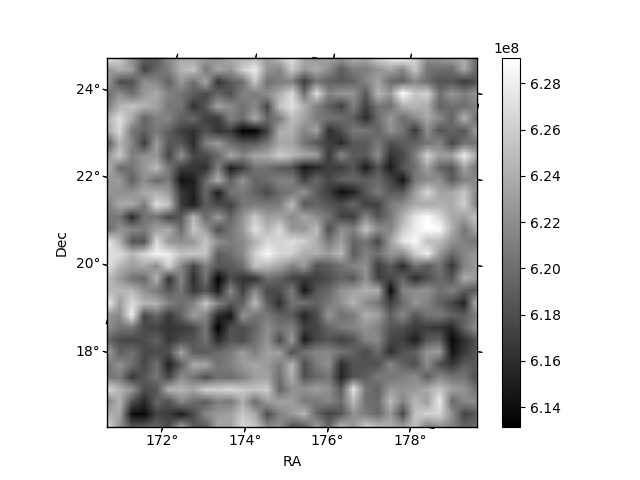
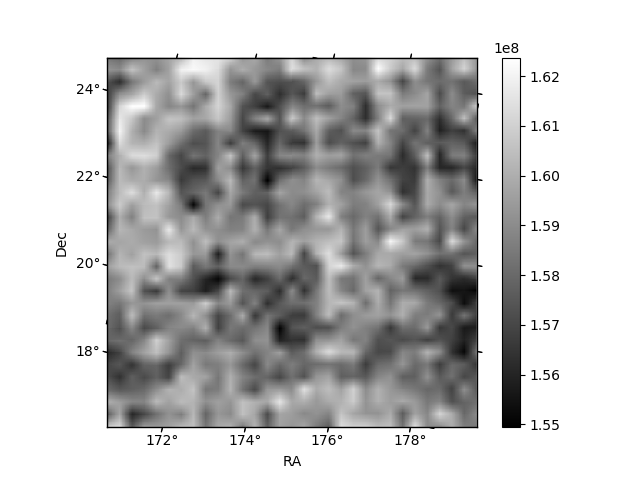
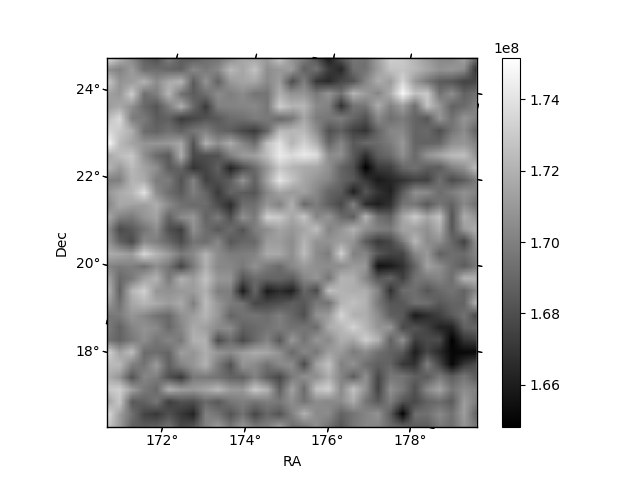
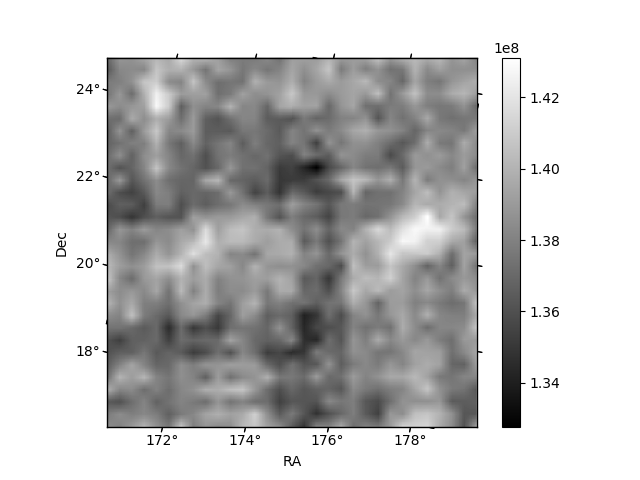
Histogram calculated using DETX and DETY for each event in the final _common_clean file
| Quadrant A | 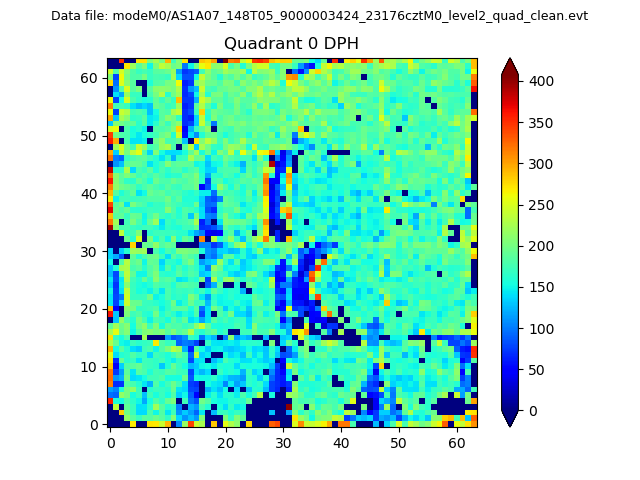 |
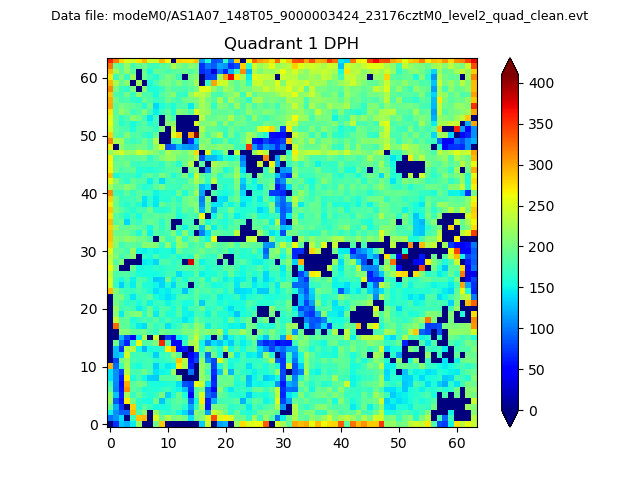 |
Quadrant B |
|---|---|---|---|
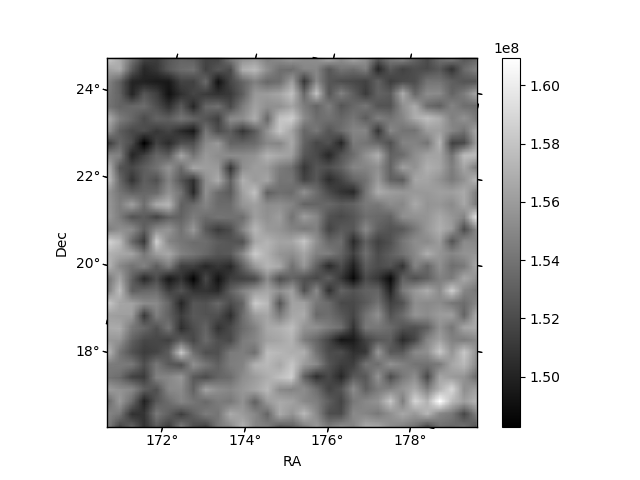
| Quadrant D | 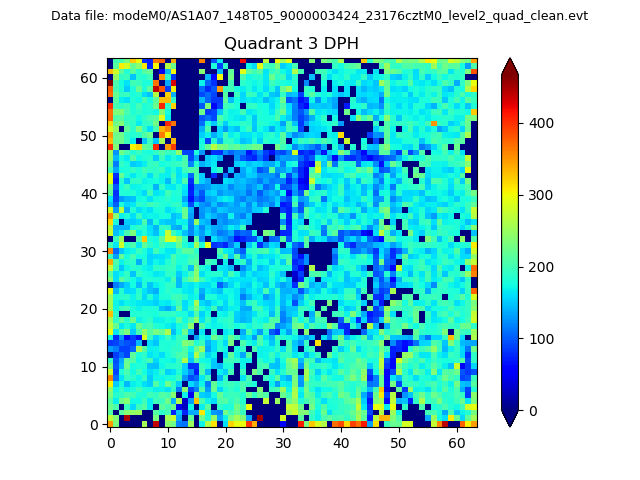 |
 |
Quadrant C |
| Plot type | Count rate plots | Images |
|---|---|---|
| Comparison with Poisson distribution Blue bars denote a histogram of data divided into 1 sec bins. Red curve is a Poisson curve with rate = median count rate of data. |
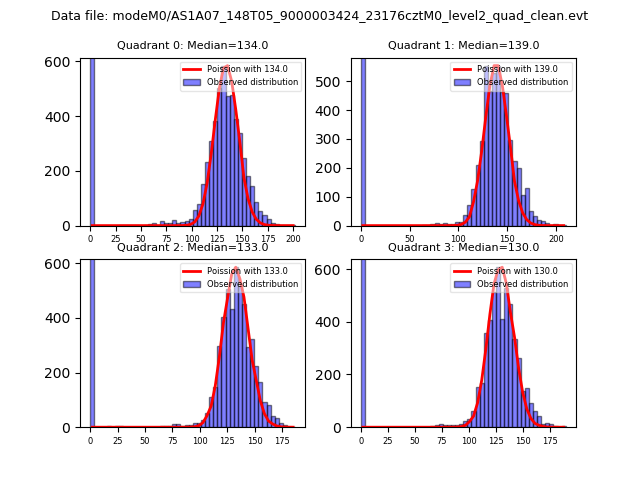 |
 |
| Quadrant-wise count rates Data is divided into 100 sec bins |
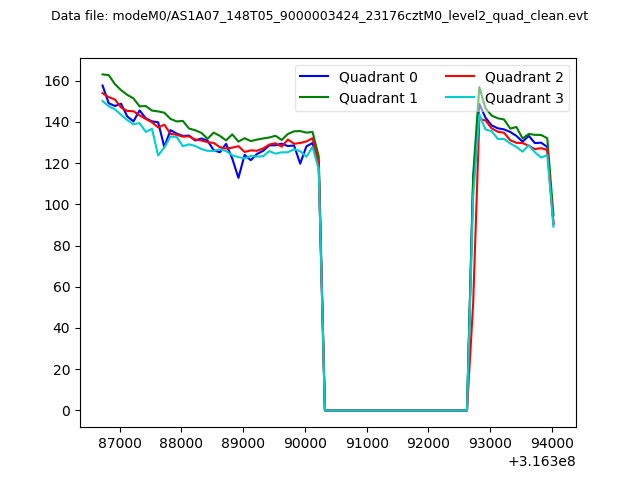 |
|
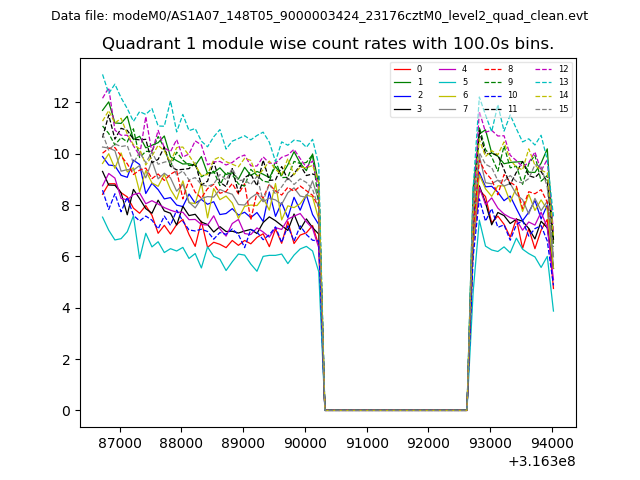
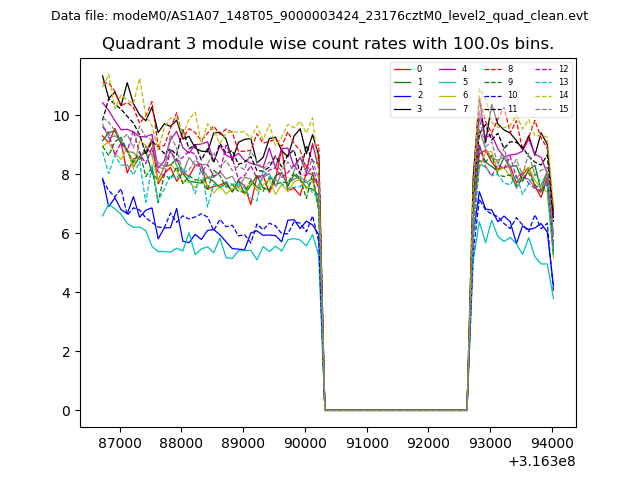
| Module-wise count rates for Quadrant A Data is divided into 100 sec bins |
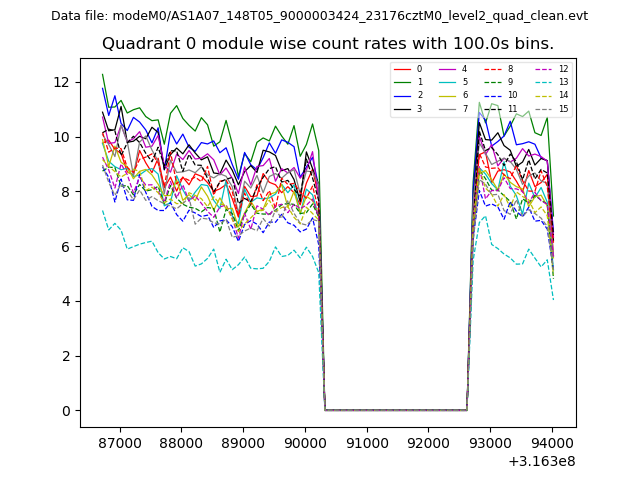 |
 |
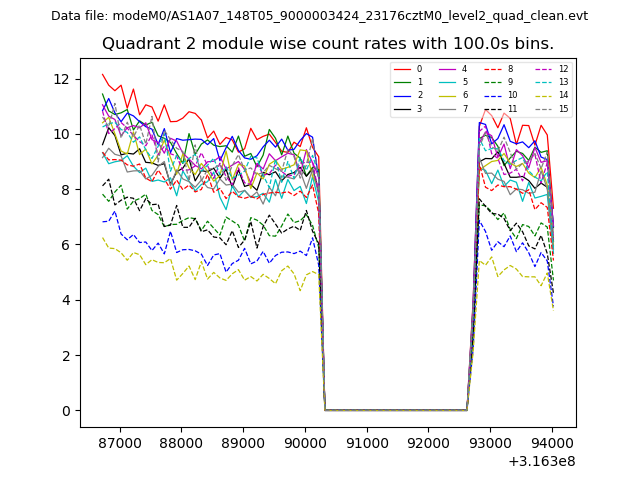
| Module-wise count rates for Quadrant B Data is divided into 100 sec bins |
 |
 |
| Module-wise count rates for Quadrant C Data is divided into 100 sec bins |
 |
 |
| Module-wise count rates for Quadrant D Data is divided into 100 sec bins |
 |
 |
| Parameter | Plot |
|---|---|
| CZT HV Monitor | 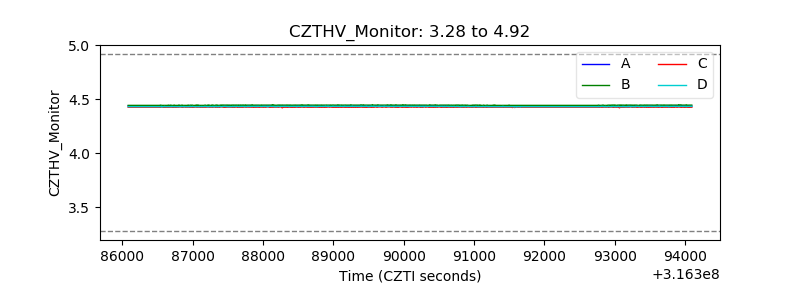 |
| D_VDD | 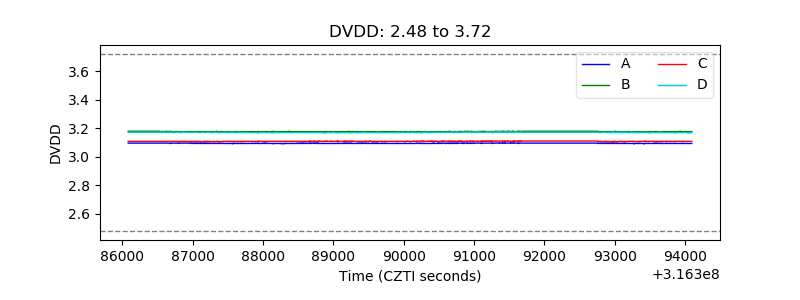 |
| Temperature 1 | 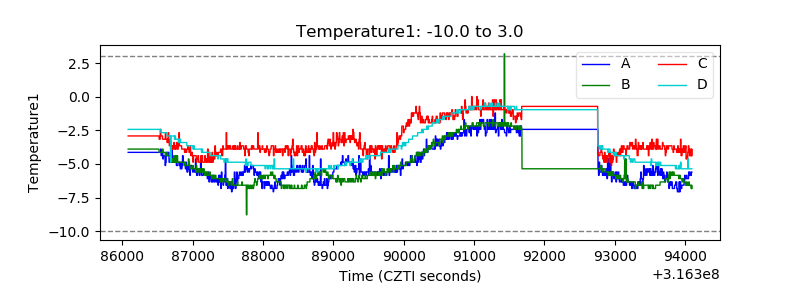 |
| Veto HV Monitor | 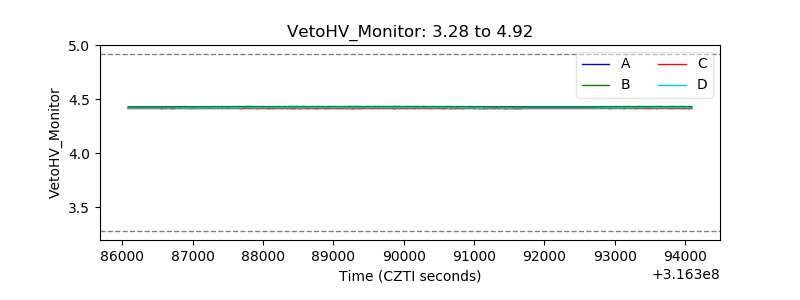 |
| Veto LLD | 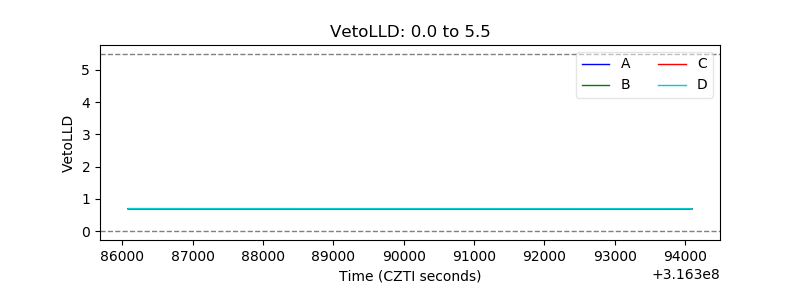 |
| Alpha Counter | 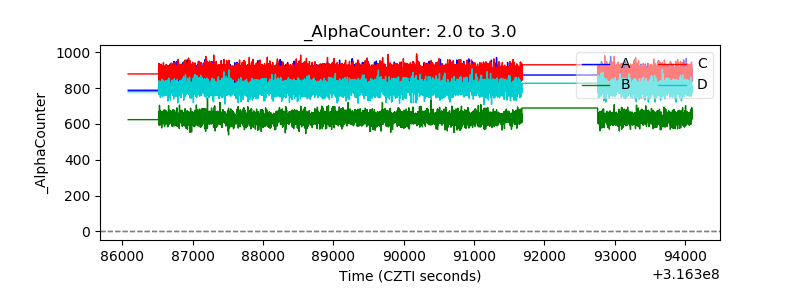 |
| _CPM_Rate | 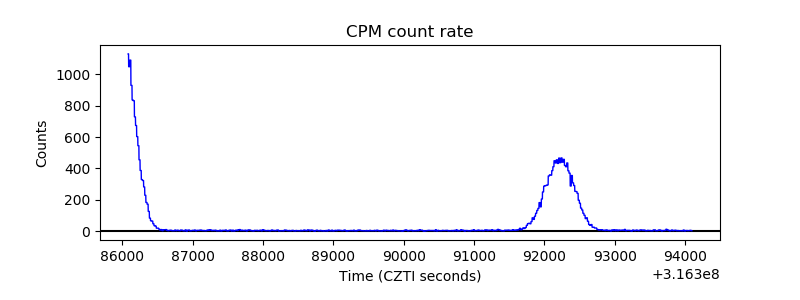 |
| CZT Counter | 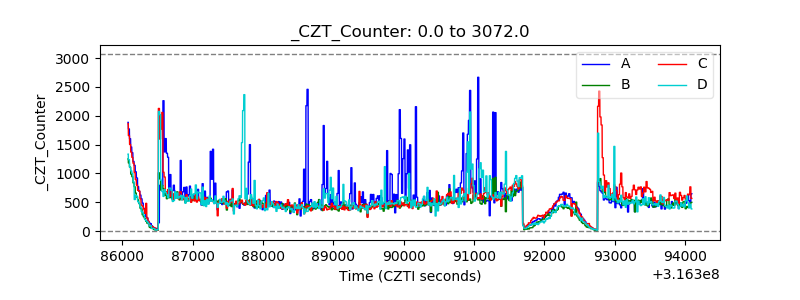 |
| +2.5 Volts monitor | 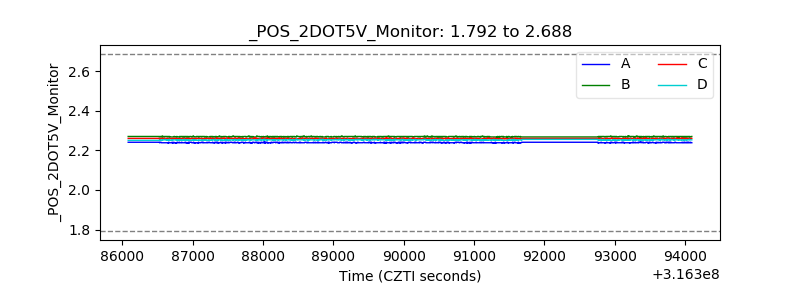 |
| +5 Volts monitor |  |
| _ROLL_ROT | 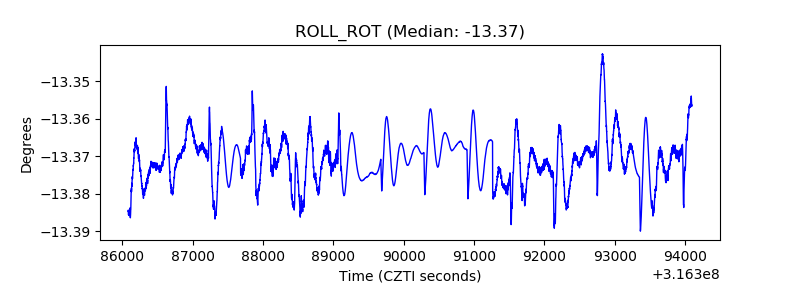 |
| _Roll_DEC | 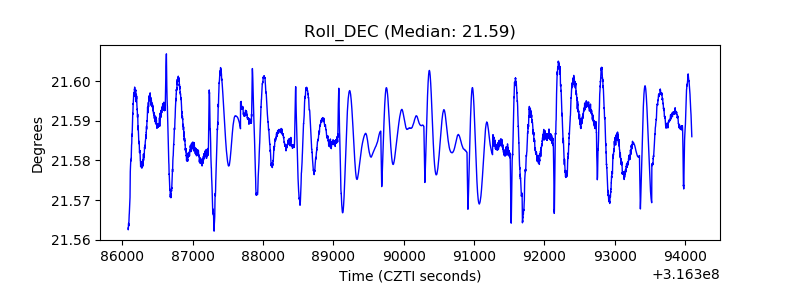 |
| _Roll_RA | 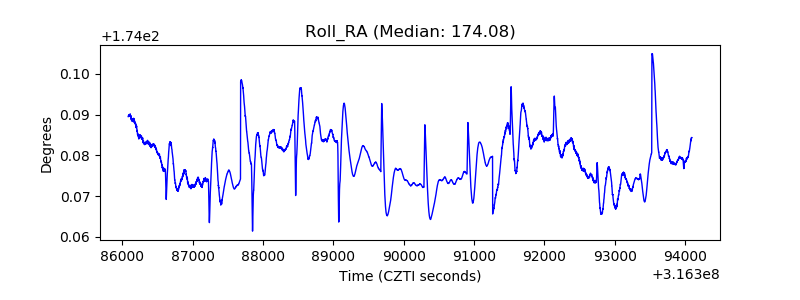 |
| Veto Counter | 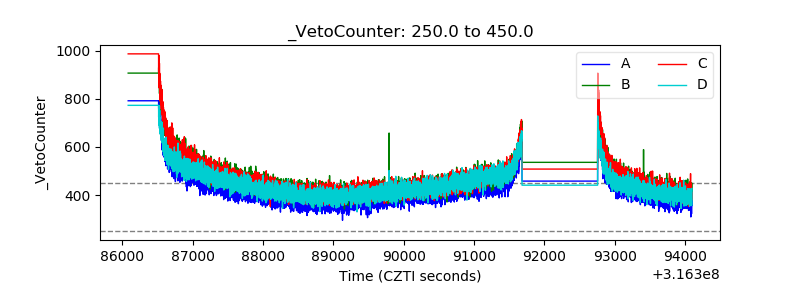 |