| Param | Original file | Final file |
|---|---|---|
| Filename | modeM0/AS1A07_148T05_9000003424_23177cztM0_level2.evt | modeM0/AS1A07_148T05_9000003424_23177cztM0_level2_quad_clean.evt |
| Size (bytes) | 1,567,097,280 | 299,260,800 |
| Size | 1.5 GB | 285.4 MB |
| Events in quadrant A | 13,948,651 | 1,905,125 |
| Events in quadrant B | 10,762,478 | 2,027,976 |
| Events in quadrant C | 11,039,277 | 1,949,780 |
| Events in quadrant D | 10,454,734 | 1,899,496 |
| Mode SS | |||
|---|---|---|---|
| Quadrant | BADHDUFLAG | Total packets | Discarded packets |
| A | 0 | 376 | 0 |
| B | 0 | 376 | 0 |
| C | 0 | 376 | 0 |
| D | 0 | 376 | 0 |
| Mode M0 | |||
|---|---|---|---|
| Quadrant | BADHDUFLAG | Total packets | Discarded packets |
| A | 0 | 53758 | 4 |
| B | 0 | 43940 | 4 |
| C | 0 | 44691 | 4 |
| D | 0 | 43517 | 5 |
| Mode M9 | |||
|---|---|---|---|
| Quadrant | BADHDUFLAG | Total packets | Discarded packets |
| A | 0 | 41 | 0 |
| B | 0 | 41 | 0 |
| C | 0 | 41 | 0 |
| D | 0 | 41 | 0 |
| Quadrant | Total seconds | Saturated seconds | Saturation percentage |
|---|---|---|---|
| A | 18608 | 1405 | 7.550516% |
| B | 18609 | 835 | 4.487076% |
| C | 18609 | 660 | 3.546671% |
| D | 18608 | 266 | 1.429493% |
Noise dominated data is calculated using 1-second bins in cleaned event files. If a bin has >2000 counts, and if more than 50% of those come from <1% of pixels, then it is considered to be noise-dominated and hence unusable.
| Quadrant | # 1 sec bins | Bins with >0 counts | Bins with >2000 counts | High rate bins dominated by noise | Noise dominated (total time) | Noise dominated (detector-on time) | Marked lightcurve |
|---|---|---|---|---|---|---|---|
| A | 25974 | 18612 | 1041 | 1041 | 4.01% | 5.59% | 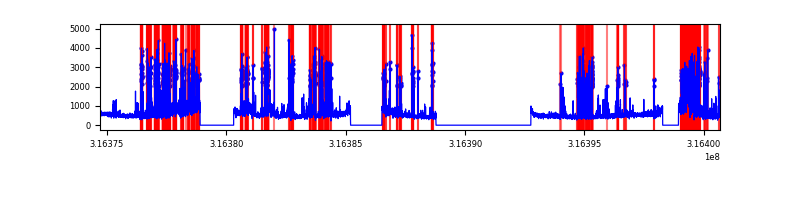 |
| B | 25975 | 18612 | 465 | 465 | 1.79% | 2.50% | 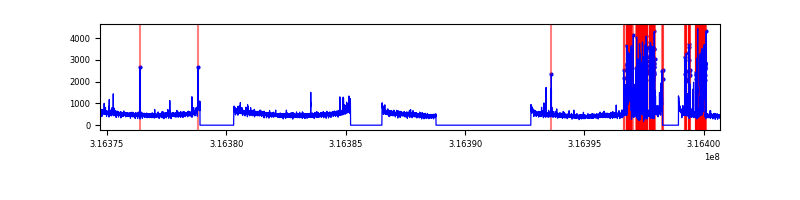 |
| C | 25975 | 18613 | 196 | 196 | 0.75% | 1.05% | 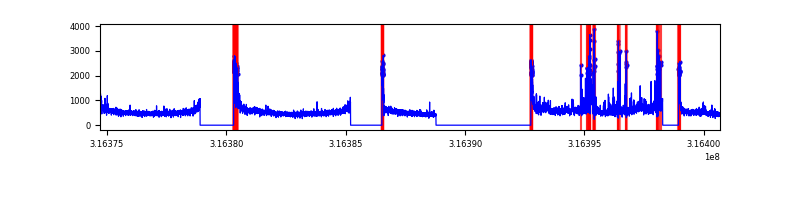 |
| D | 25975 | 18612 | 168 | 168 | 0.65% | 0.90% | 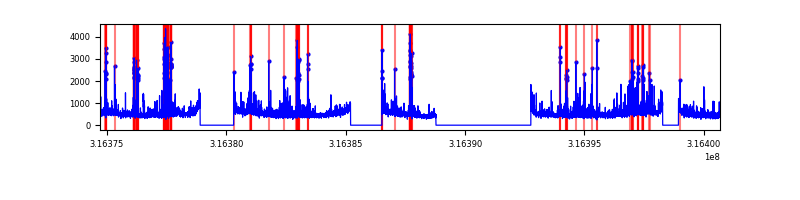 |
Top three noisy pixels from each quadrant. If the there are fewer than three noisy pixels in the level2.evt file, extra rows are filled as -1
| Pixel properties | Quadrant properties | ||||||
|---|---|---|---|---|---|---|---|
| Quadrant | DetID | PixID | Counts | Sigma | Mean | Median | Sigma |
| A | 6 | 16 | 5078751 | 11051.49 | 2302 | 2253 | 459.3 |
| A | 13 | 254 | 28303 | 56.71 | 2302 | 2253 | 459.3 |
| A | 0 | 226 | 19714 | 38.01 | 2302 | 2253 | 459.3 |
| B | 0 | 245 | 1578712 | 3594.24 | 2333 | 2279 | 438.6 |
| B | 12 | 111 | 52999 | 115.64 | 2333 | 2279 | 438.6 |
| B | 11 | 111 | 46501 | 100.83 | 2333 | 2279 | 438.6 |
| C | 0 | 10 | 1226774 | 2337.36 | 2269 | 2287 | 523.9 |
| C | 14 | 238 | 364004 | 690.46 | 2269 | 2287 | 523.9 |
| C | 2 | 16 | 330341 | 626.21 | 2269 | 2287 | 523.9 |
| D | 7 | 238 | 1070093 | 1927.9 | 2298 | 2241 | 553.9 |
| D | 1 | 52 | 262103 | 469.15 | 2298 | 2241 | 553.9 |
| D | 12 | 233 | 226559 | 404.98 | 2298 | 2241 | 553.9 |
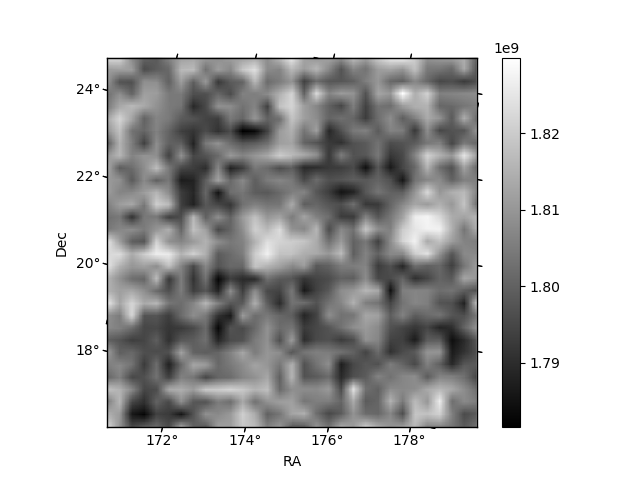
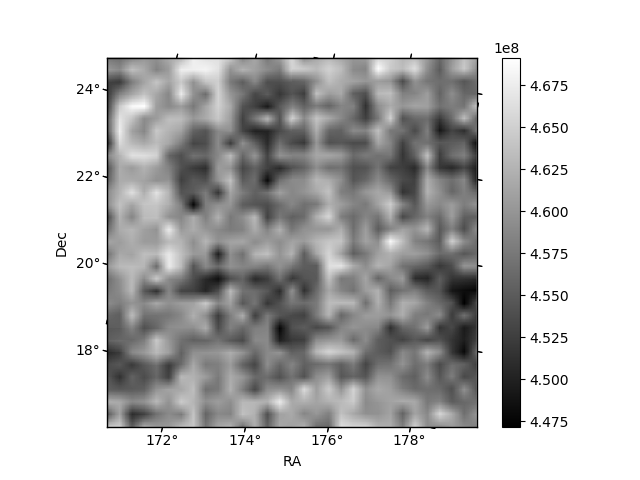
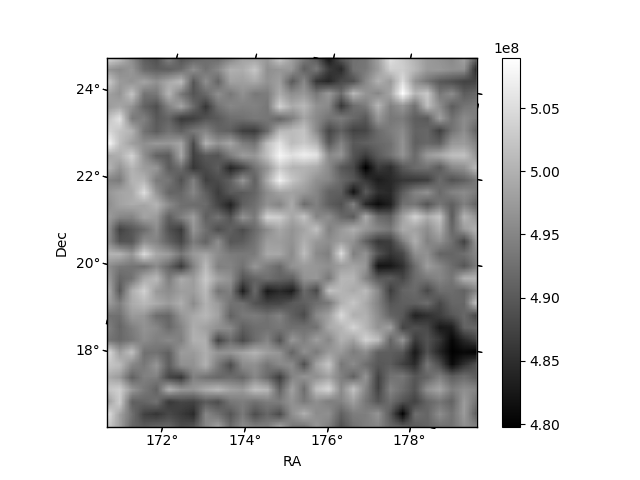
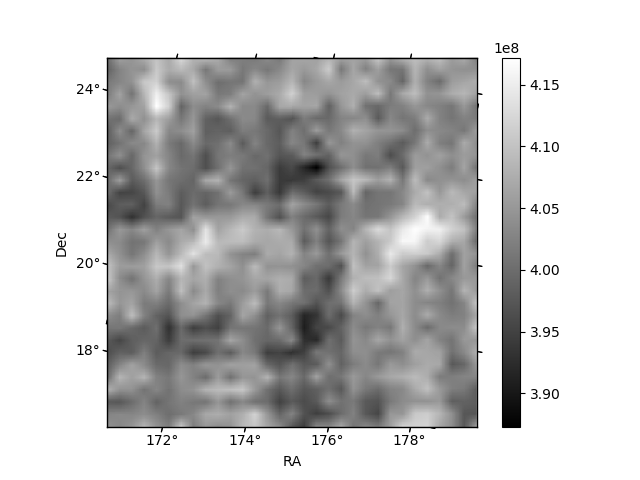
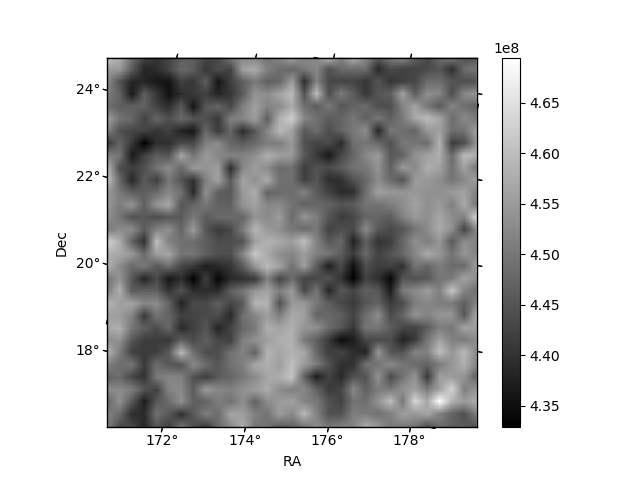
Histogram calculated using DETX and DETY for each event in the final _common_clean file
| Quadrant A | 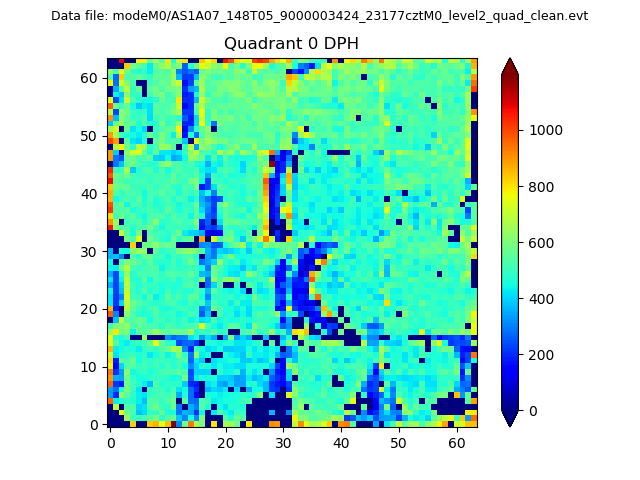 |
 |
Quadrant B |
|---|---|---|---|
| Quadrant D | 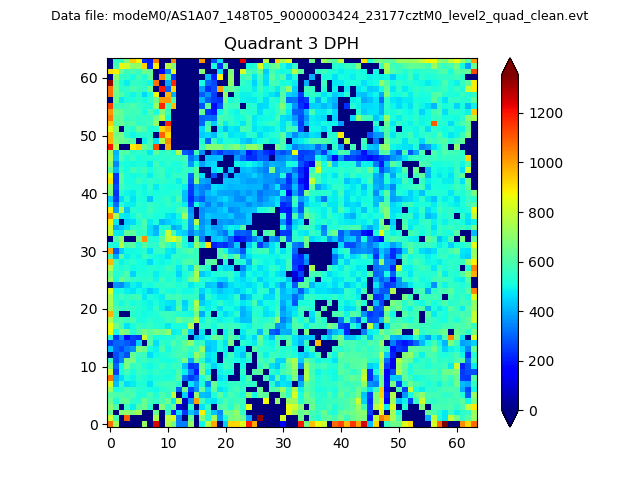 |
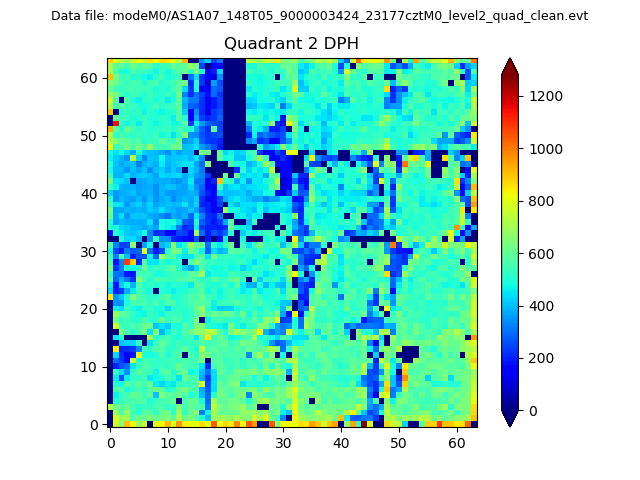 |
Quadrant C |
| Plot type | Count rate plots | Images |
|---|---|---|
| Comparison with Poisson distribution Blue bars denote a histogram of data divided into 1 sec bins. Red curve is a Poisson curve with rate = median count rate of data. |
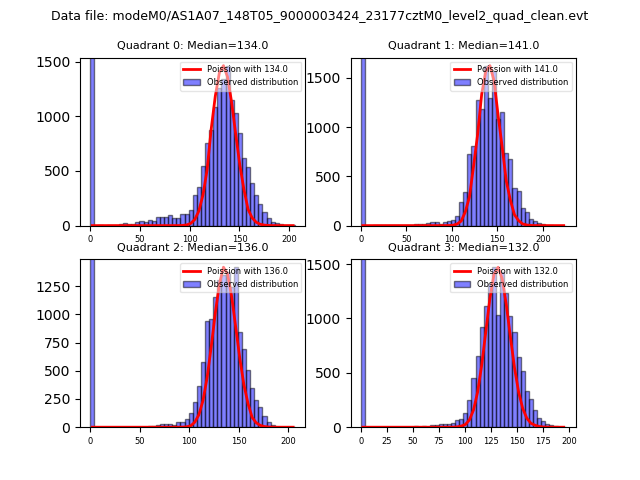 |
 |
| Quadrant-wise count rates Data is divided into 100 sec bins |
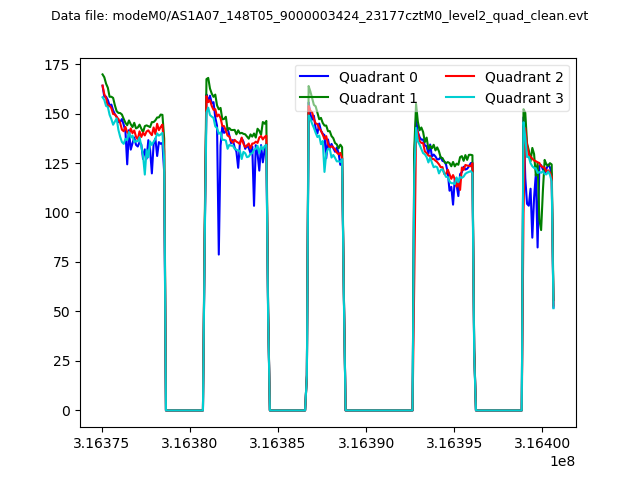 |
|
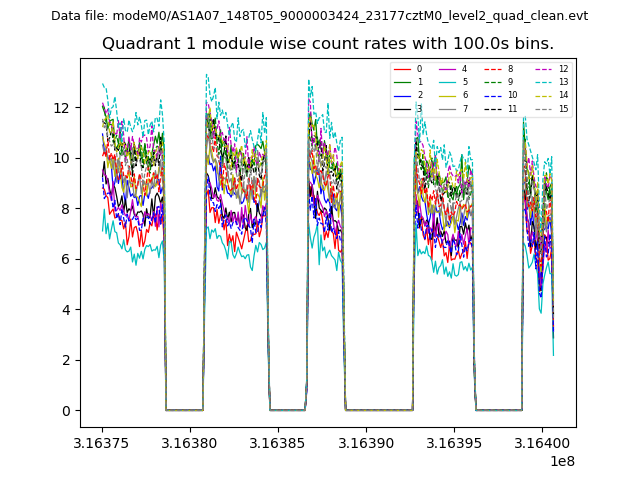
| Module-wise count rates for Quadrant A Data is divided into 100 sec bins |
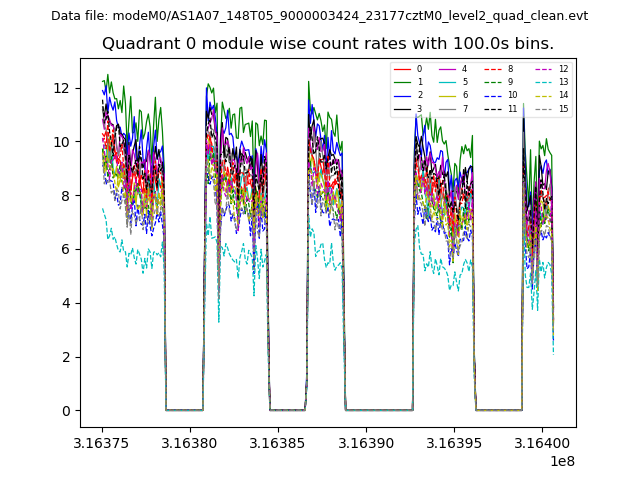 |
 |
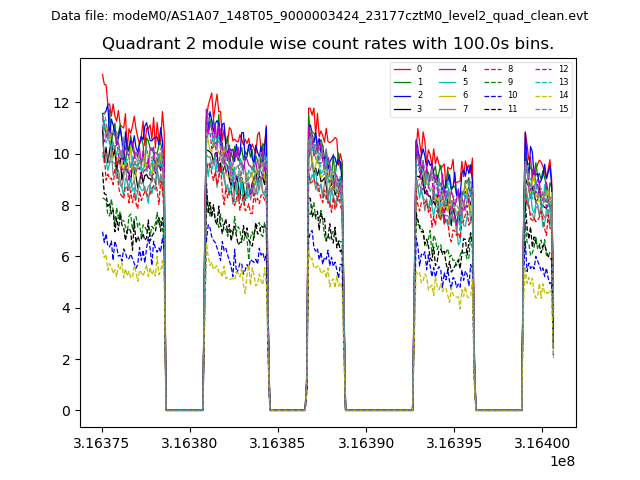
| Module-wise count rates for Quadrant B Data is divided into 100 sec bins |
 |
 |
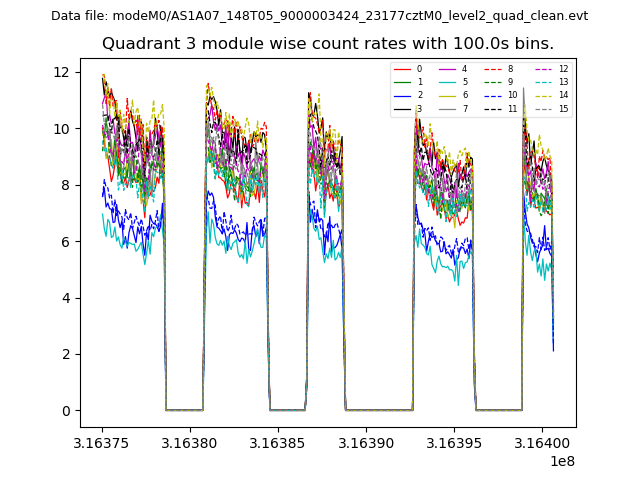
| Module-wise count rates for Quadrant C Data is divided into 100 sec bins |
 |
 |
| Module-wise count rates for Quadrant D Data is divided into 100 sec bins |
 |
 |
| Parameter | Plot |
|---|---|
| CZT HV Monitor | 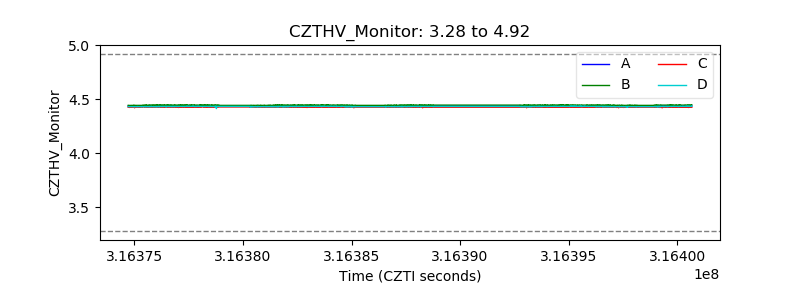 |
| D_VDD | 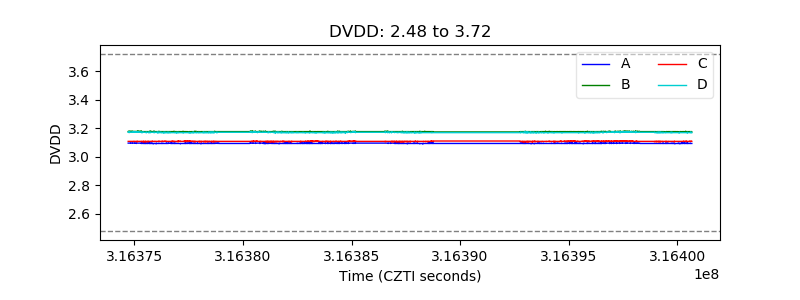 |
| Temperature 1 | 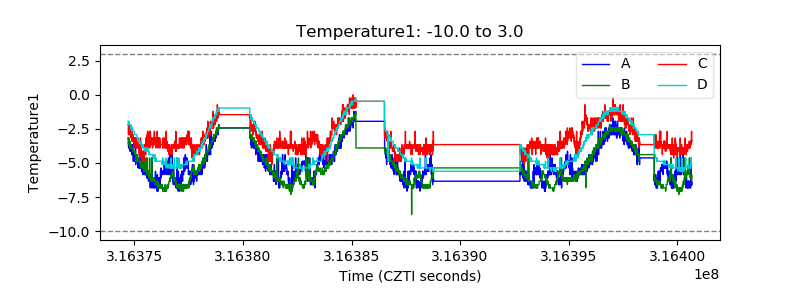 |
| Veto HV Monitor | 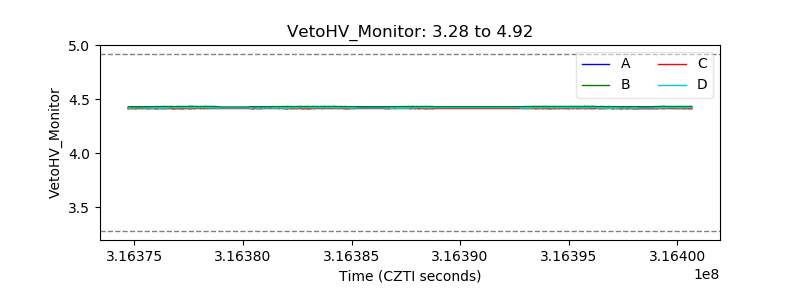 |
| Veto LLD | 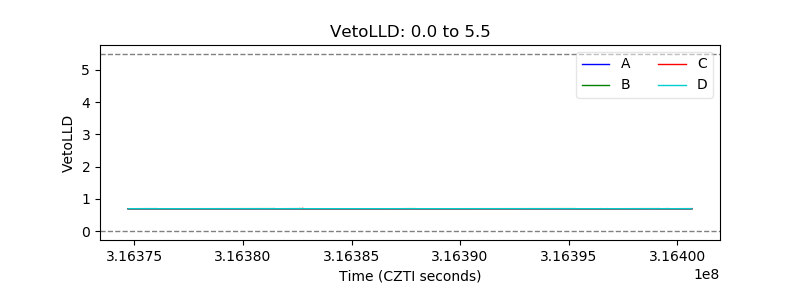 |
| Alpha Counter | 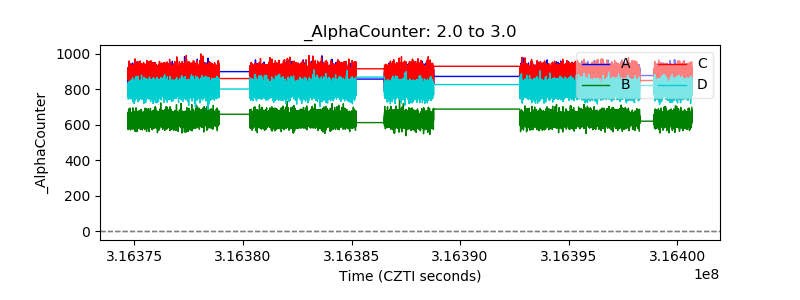 |
| _CPM_Rate | 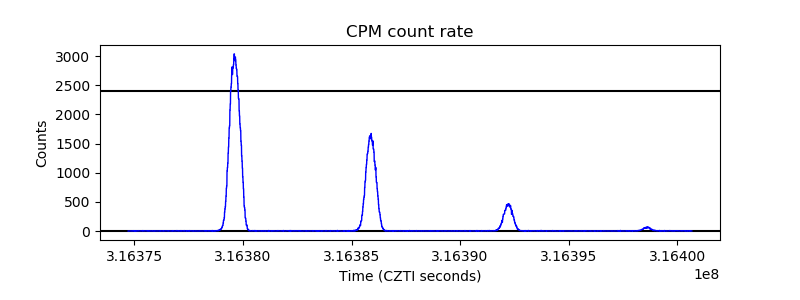 |
| CZT Counter | 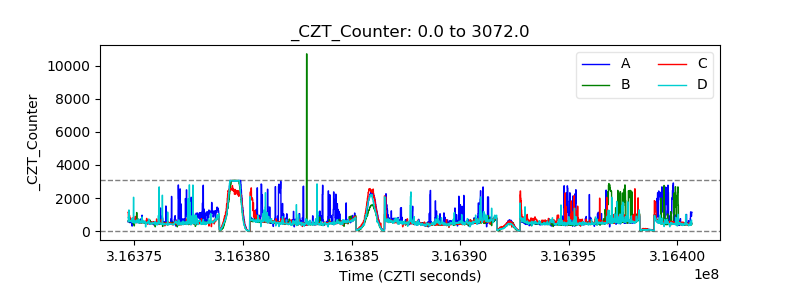 |
| +2.5 Volts monitor |  |
| +5 Volts monitor | 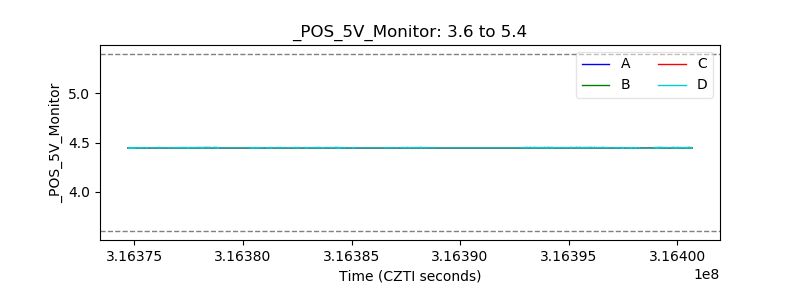 |
| _ROLL_ROT | 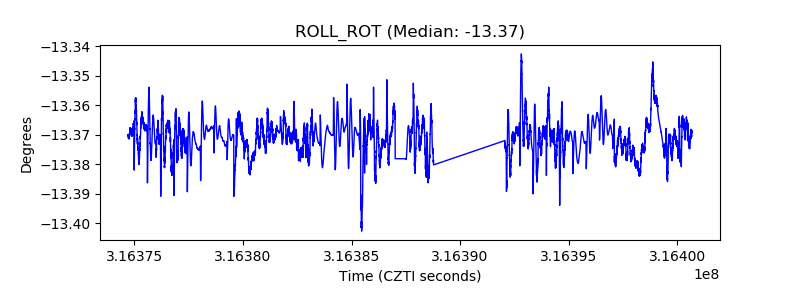 |
| _Roll_DEC | 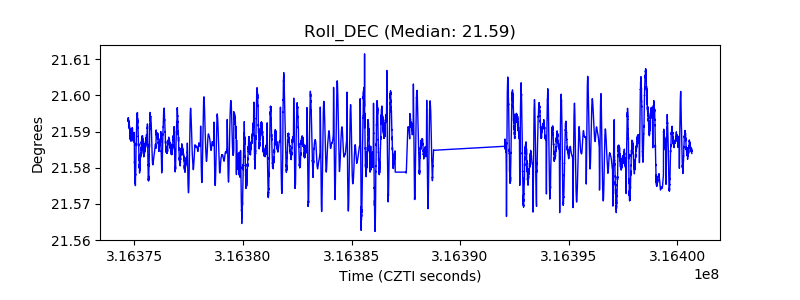 |
| _Roll_RA | 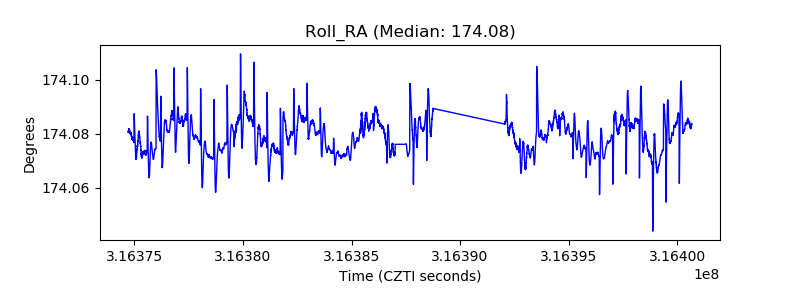 |
| Veto Counter | 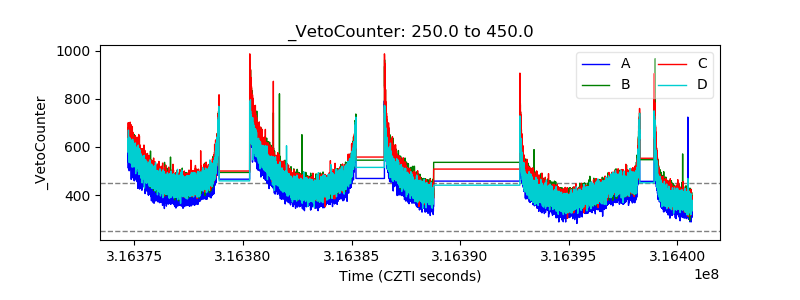 |