| Param | Original file | Final file |
|---|---|---|
| Filename | modeM0/AS1A07_148T05_9000003424_23178cztM0_level2.evt | modeM0/AS1A07_148T05_9000003424_23178cztM0_level2_quad_clean.evt |
| Size (bytes) | 241,332,480 | 50,584,320 |
| Size | 230.2 MB | 48.2 MB |
| Events in quadrant A | 2,614,252 | 316,653 |
| Events in quadrant B | 1,712,675 | 339,241 |
| Events in quadrant C | 1,420,206 | 336,270 |
| Events in quadrant D | 1,361,395 | 330,869 |
| Mode SS | |||
|---|---|---|---|
| Quadrant | BADHDUFLAG | Total packets | Discarded packets |
| A | 0 | 58 | 0 |
| B | 0 | 58 | 0 |
| C | 0 | 58 | 0 |
| D | 0 | 58 | 0 |
| Mode M0 | |||
|---|---|---|---|
| Quadrant | BADHDUFLAG | Total packets | Discarded packets |
| A | 0 | 9835 | 0 |
| B | 0 | 7209 | 0 |
| C | 0 | 5992 | 0 |
| D | 0 | 6108 | 0 |
| Quadrant | Total seconds | Saturated seconds | Saturation percentage |
|---|---|---|---|
| A | 2918 | 423 | 14.496230% |
| B | 2919 | 169 | 5.789654% |
| C | 2919 | 8 | 0.274066% |
| D | 2919 | 1 | 0.034258% |
Noise dominated data is calculated using 1-second bins in cleaned event files. If a bin has >2000 counts, and if more than 50% of those come from <1% of pixels, then it is considered to be noise-dominated and hence unusable.
| Quadrant | # 1 sec bins | Bins with >0 counts | Bins with >2000 counts | High rate bins dominated by noise | Noise dominated (total time) | Noise dominated (detector-on time) | Marked lightcurve |
|---|---|---|---|---|---|---|---|
| A | 2918 | 2918 | 379 | 379 | 12.99% | 12.99% | 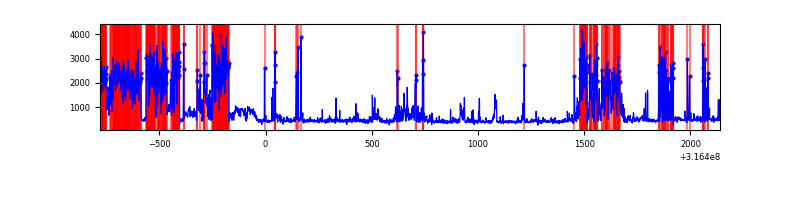 |
| B | 2919 | 2919 | 130 | 130 | 4.45% | 4.45% | 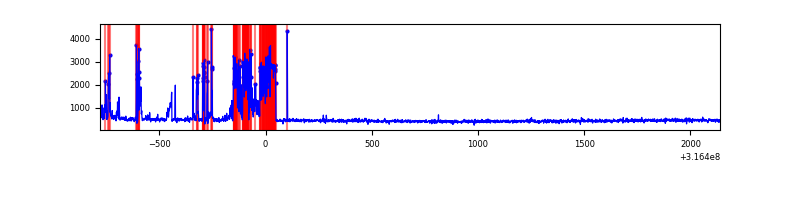 |
| C | 2919 | 2919 | 0 | 0 | 0.00% | 0.00% | 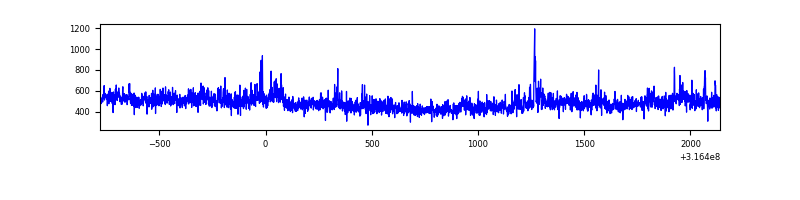 |
| D | 2919 | 2919 | 1 | 1 | 0.03% | 0.03% | 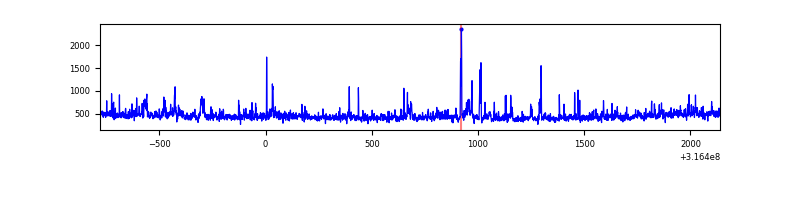 |
Top three noisy pixels from each quadrant. If the there are fewer than three noisy pixels in the level2.evt file, extra rows are filled as -1
| Pixel properties | Quadrant properties | ||||||
|---|---|---|---|---|---|---|---|
| Quadrant | DetID | PixID | Counts | Sigma | Mean | Median | Sigma |
| A | 6 | 16 | 1440419 | 23206.44 | 304 | 298 | 62.1 |
| A | 13 | 254 | 4113 | 61.48 | 304 | 298 | 62.1 |
| A | 3 | 137 | 2623 | 37.47 | 304 | 298 | 62.1 |
| B | 0 | 245 | 474309 | 7623.96 | 314 | 306 | 62.2 |
| B | 12 | 111 | 7478 | 115.36 | 314 | 306 | 62.2 |
| B | 11 | 111 | 6617 | 101.51 | 314 | 306 | 62.2 |
| C | 0 | 10 | 157315 | 2130.47 | 309 | 311 | 73.7 |
| C | 14 | 238 | 49329 | 665.15 | 309 | 311 | 73.7 |
| C | 7 | 247 | 6005 | 77.26 | 309 | 311 | 73.7 |
| D | 7 | 238 | 154930 | 2000.8 | 309 | 301 | 77.3 |
| D | 2 | 152 | 22598 | 288.51 | 309 | 301 | 77.3 |
| D | 1 | 52 | 14769 | 187.21 | 309 | 301 | 77.3 |
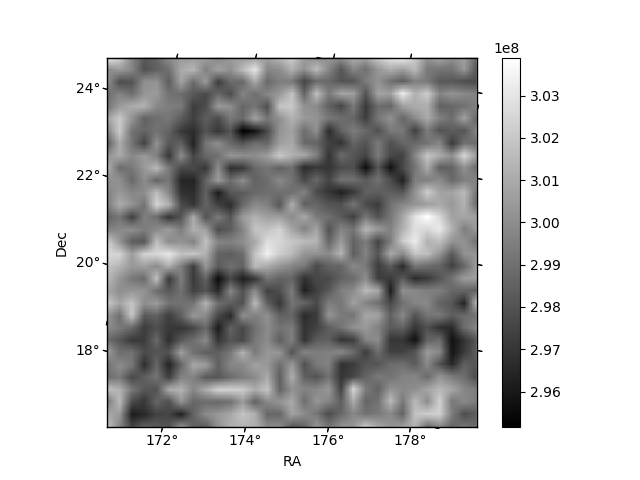
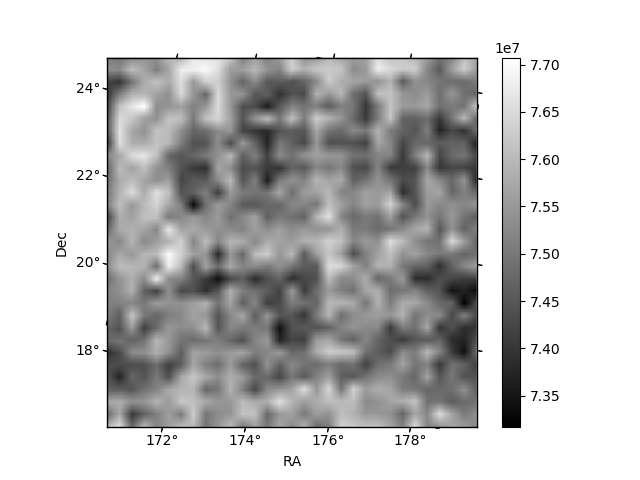
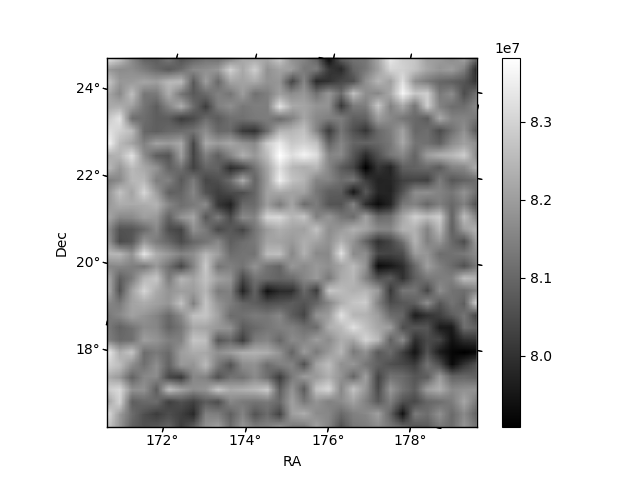
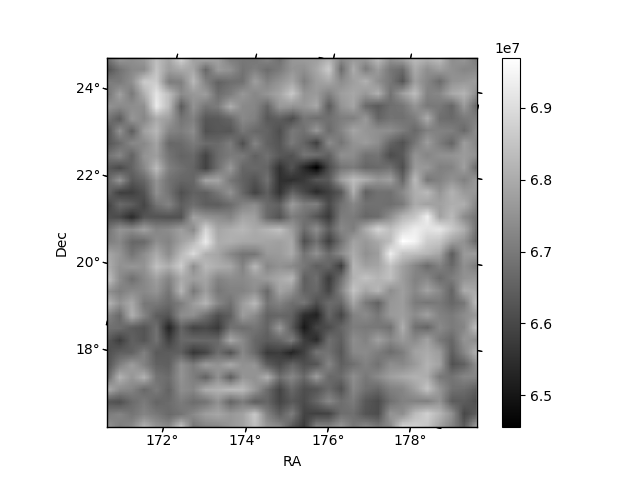
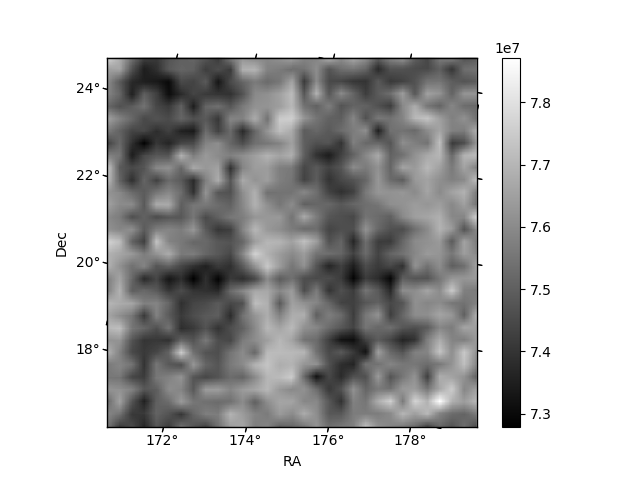
Histogram calculated using DETX and DETY for each event in the final _common_clean file
| Quadrant A | 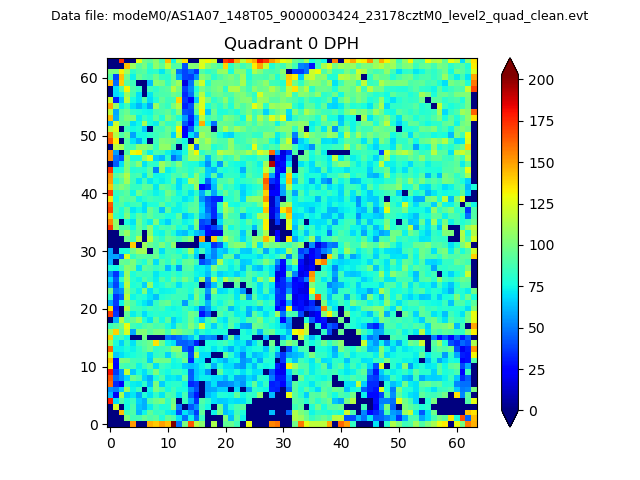 |
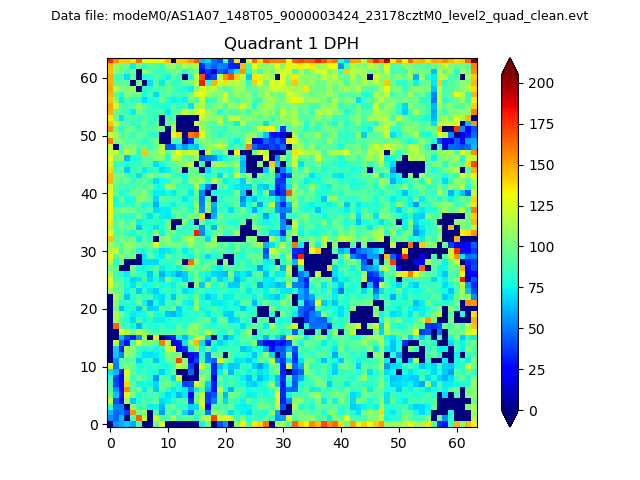 |
Quadrant B |
|---|---|---|---|
| Quadrant D | 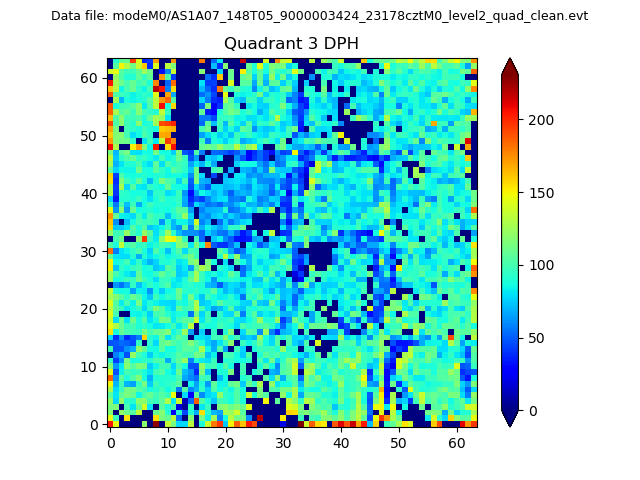 |
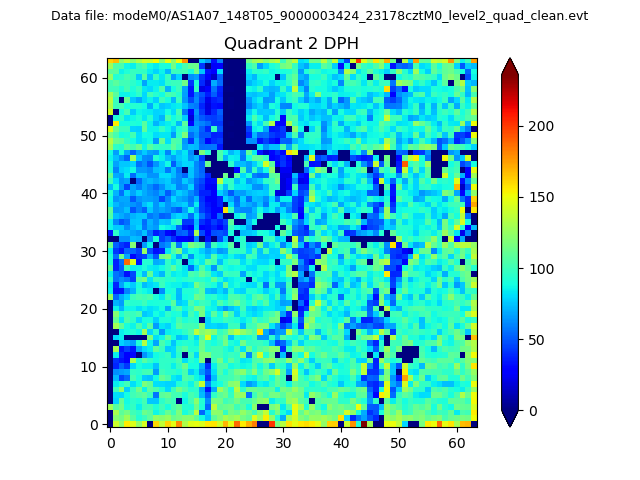 |
Quadrant C |
| Plot type | Count rate plots | Images |
|---|---|---|
| Comparison with Poisson distribution Blue bars denote a histogram of data divided into 1 sec bins. Red curve is a Poisson curve with rate = median count rate of data. |
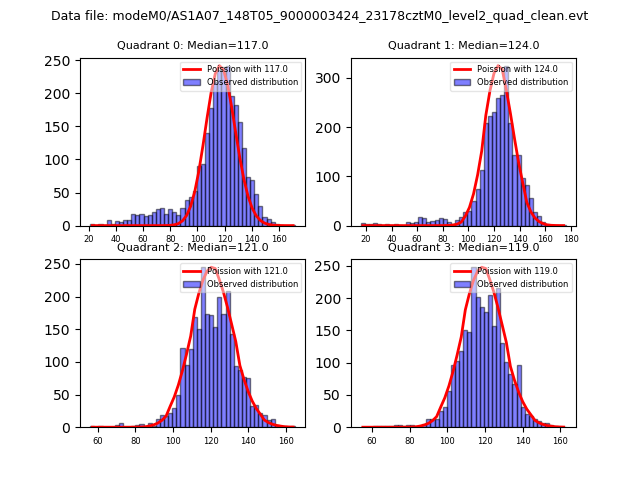 |
 |
| Quadrant-wise count rates Data is divided into 100 sec bins |
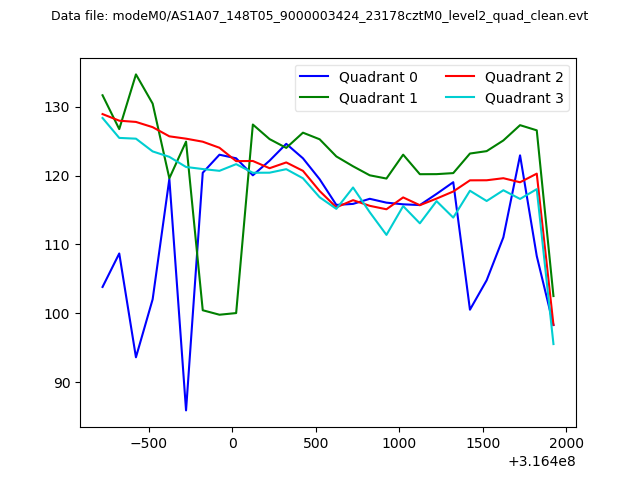 |
|
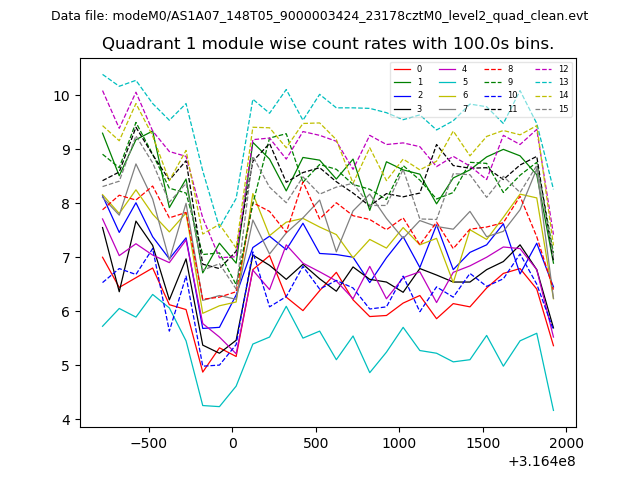
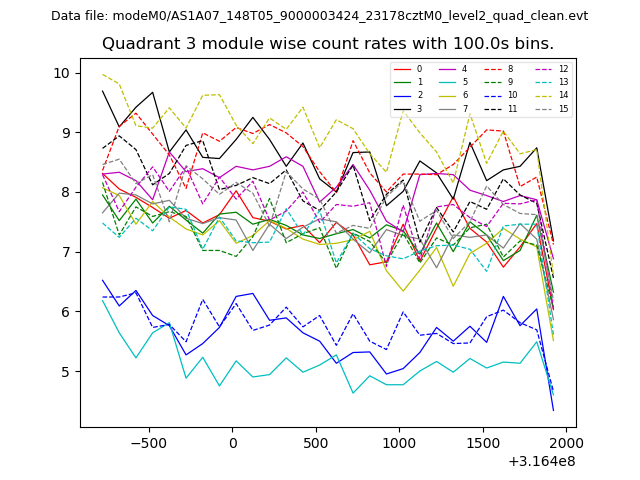
| Module-wise count rates for Quadrant A Data is divided into 100 sec bins |
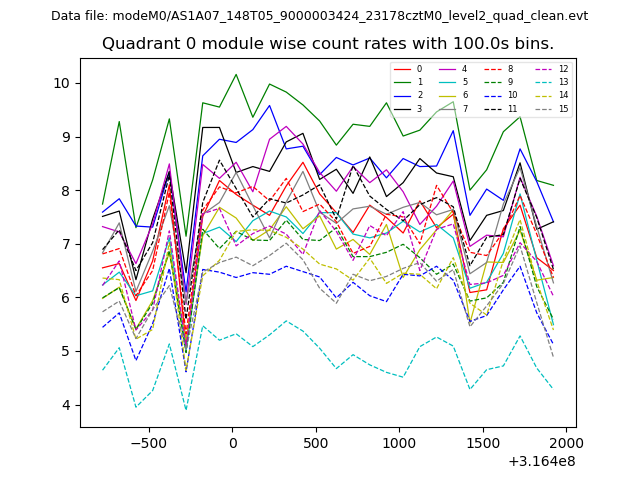 |
 |
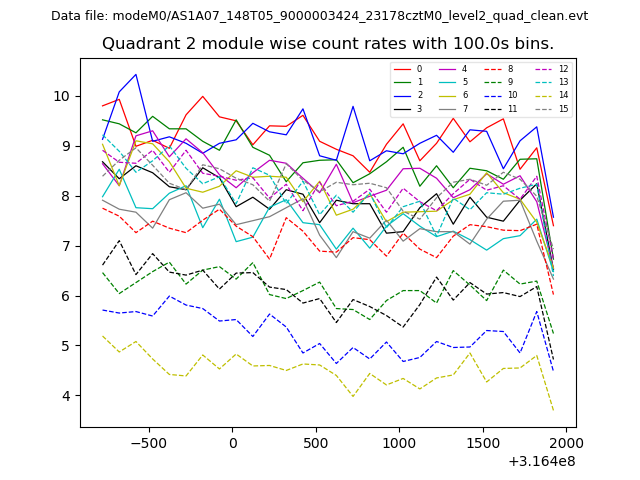
| Module-wise count rates for Quadrant B Data is divided into 100 sec bins |
 |
 |
| Module-wise count rates for Quadrant C Data is divided into 100 sec bins |
 |
 |
| Module-wise count rates for Quadrant D Data is divided into 100 sec bins |
 |
 |
| Parameter | Plot |
|---|---|
| CZT HV Monitor | 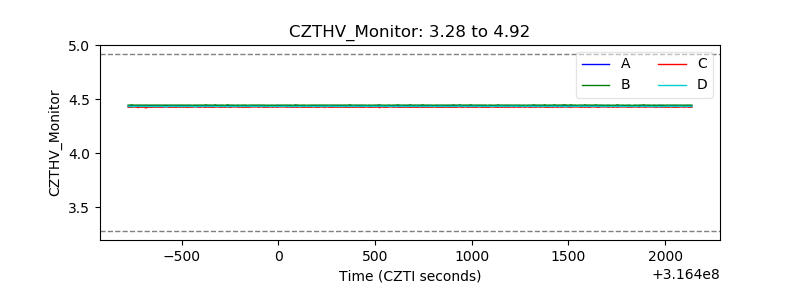 |
| D_VDD | 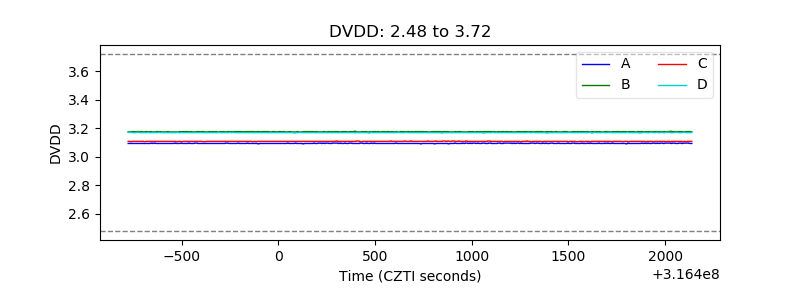 |
| Temperature 1 | 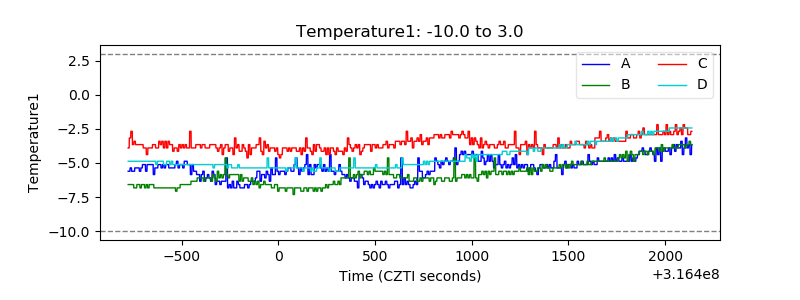 |
| Veto HV Monitor | 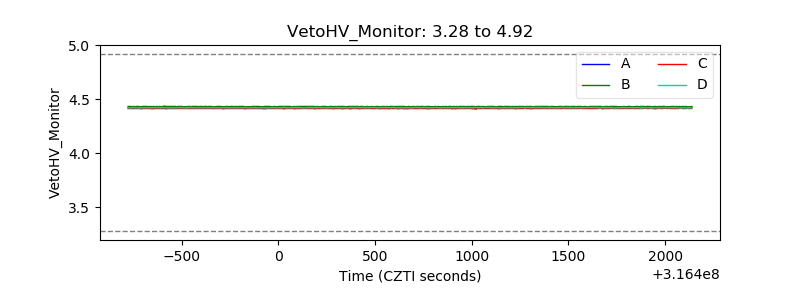 |
| Veto LLD | 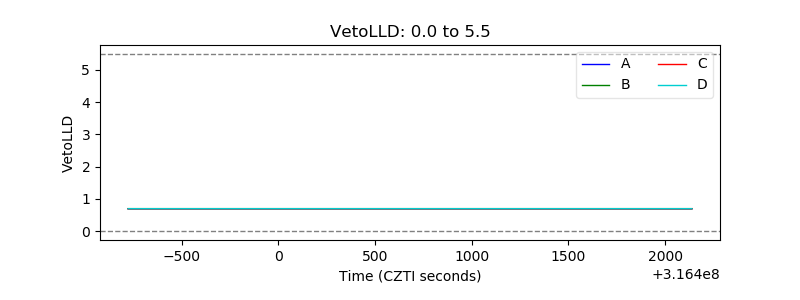 |
| Alpha Counter | 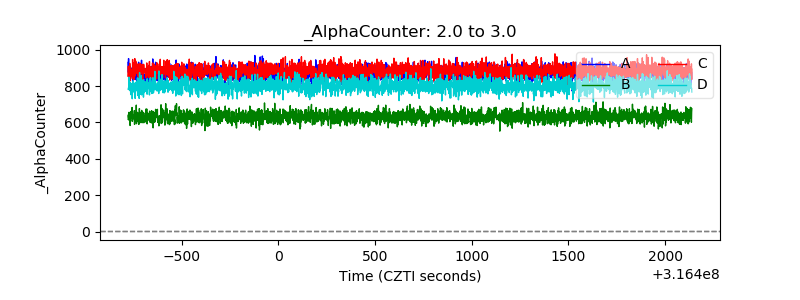 |
| _CPM_Rate | 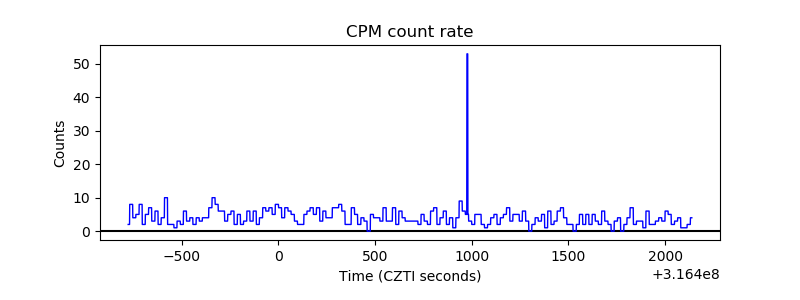 |
| CZT Counter | 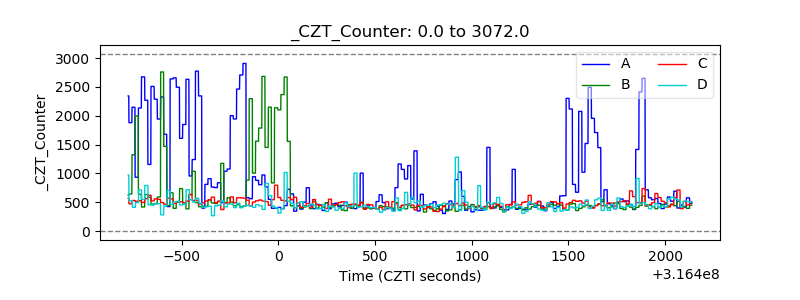 |
| +2.5 Volts monitor |  |
| +5 Volts monitor |  |
| _ROLL_ROT | 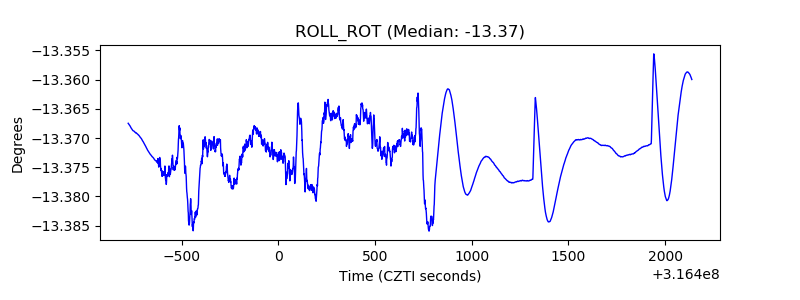 |
| _Roll_DEC | 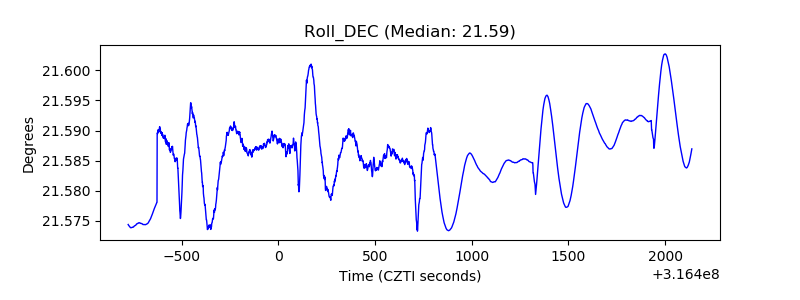 |
| _Roll_RA | 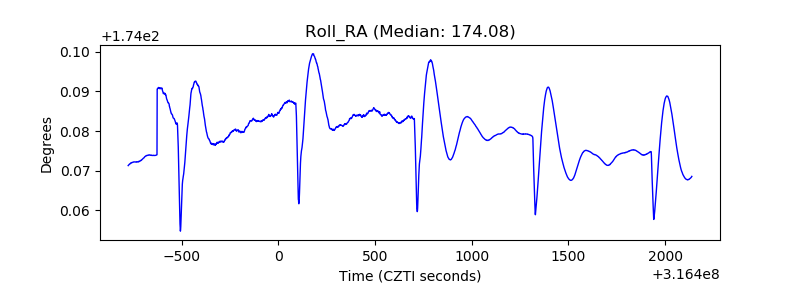 |
| Veto Counter | 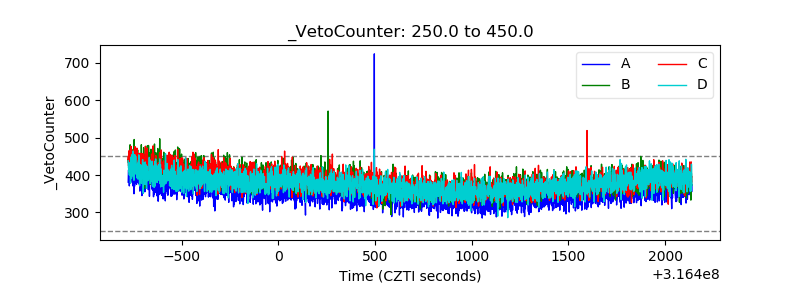 |