| Param | Original file | Final file |
|---|---|---|
| Filename | modeM0/AS1A08_003T05_9000003426cztM0_level2.fits | modeM0/AS1A08_003T05_9000003426cztM0_level2_quad_clean.evt |
| Size (bytes) | 428,690,880 | 389,145,600 |
| Size | 408.8 MB | 371.1 MB |
| Events in quadrant A | 2,587,376 | 2,199,299 |
| Events in quadrant B | 2,563,602 | 2,343,341 |
| Events in quadrant C | 2,603,554 | 2,235,063 |
| Events in quadrant D | 2,173,660 | 1,956,011 |
| Mode M9 | |||
|---|---|---|---|
| Quadrant | BADHDUFLAG | Total packets | Discarded packets |
| A | 0 | 53 | 0 |
| B | 0 | 53 | 0 |
| C | 0 | 53 | 0 |
| D | 0 | 53 | 0 |
| Mode M0 | |||
|---|---|---|---|
| Quadrant | BADHDUFLAG | Total packets | Discarded packets |
| A | 0 | 115647 | 0 |
| B | 0 | 93747 | 0 |
| C | 0 | 99669 | 0 |
| D | 0 | 150784 | 0 |
| Mode SS | |||
|---|---|---|---|
| Quadrant | BADHDUFLAG | Total packets | Discarded packets |
| A | 0 | 908 | 0 |
| B | 0 | 908 | 0 |
| C | 0 | 908 | 0 |
| D | 0 | 908 | 0 |
| Quadrant | Total seconds | Saturated seconds | Saturation percentage |
|---|---|---|---|
| A | 44449 | 3325 | 7.480483% |
| B | 44449 | 672 | 1.511845% |
| C | 44449 | 1234 | 2.776215% |
| D | 44449 | 5408 | 12.166753% |
Noise dominated data is calculated using 1-second bins in cleaned event files. If a bin has >2000 counts, and if more than 50% of those come from <1% of pixels, then it is considered to be noise-dominated and hence unusable.
| Quadrant | # 1 sec bins | Bins with >0 counts | Bins with >2000 counts | High rate bins dominated by noise | Noise dominated (total time) | Noise dominated (detector-on time) | Marked lightcurve |
|---|---|---|---|---|---|---|---|
| A | 49724 | 44443 | 0 | 0 | 0.00% | 0.00% |  |
| B | 49724 | 44447 | 0 | 0 | 0.00% | 0.00% |  |
| C | 49724 | 44406 | 0 | 0 | 0.00% | 0.00% |  |
| D | 49724 | 44423 | 0 | 0 | 0.00% | 0.00% |  |
Top three noisy pixels from each quadrant. If the there are fewer than three noisy pixels in the level2.evt file, extra rows are filled as -1
| Pixel properties | Quadrant properties | ||||||
|---|---|---|---|---|---|---|---|
| Quadrant | DetID | PixID | Counts | Sigma | Mean | Median | Sigma |
| A | 0 | 29 | 2436 | 10.58 | 673 | 628 | 170.9 |
| A | 7 | 110 | 2051 | 8.33 | 673 | 628 | 170.9 |
| A | 0 | 30 | 1869 | 7.26 | 673 | 628 | 170.9 |
| B | 2 | 9 | 2075 | 10.57 | 676 | 644 | 135.4 |
| B | 2 | 8 | 1737 | 8.07 | 676 | 644 | 135.4 |
| B | 5 | 232 | 1723 | 7.97 | 676 | 644 | 135.4 |
| C | 1 | 80 | 1963 | 7.44 | 688 | 642 | 177.6 |
| C | 1 | 81 | 1957 | 7.4 | 688 | 642 | 177.6 |
| C | 12 | 241 | 1791 | 6.47 | 688 | 642 | 177.6 |
| D | 13 | 238 | 1582 | 6.04 | 622 | 566 | 168.3 |
| D | 6 | 231 | 1570 | 5.97 | 622 | 566 | 168.3 |
| D | 6 | 38 | 1496 | 5.53 | 622 | 566 | 168.3 |
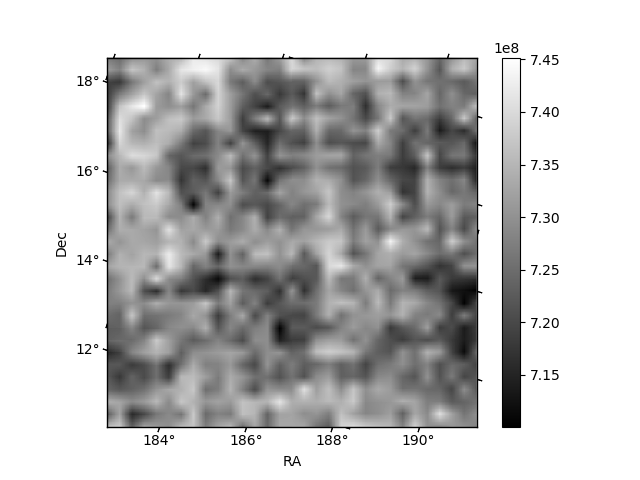
Histogram calculated using DETX and DETY for each event in the final _common_clean file
| Quadrant A |  |
 |
Quadrant B |
|---|---|---|---|
| Quadrant D |  |
 |
Quadrant C |
| Plot type | Count rate plots | Images |
|---|---|---|
| Comparison with Poisson distribution Blue bars denote a histogram of data divided into 1 sec bins. Red curve is a Poisson curve with rate = median count rate of data. |
 |
 |
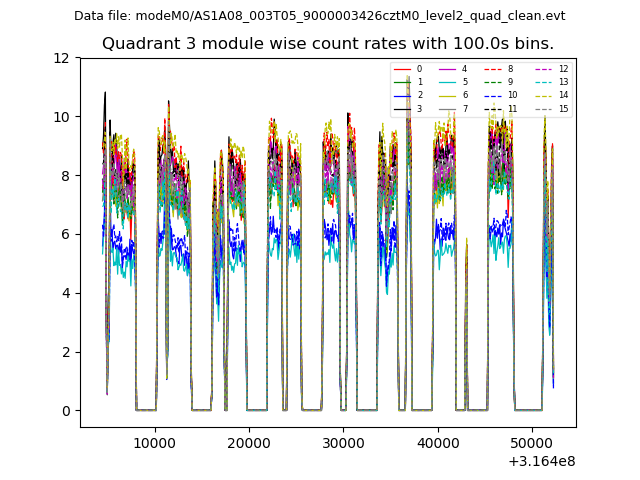
| Quadrant-wise count rates Data is divided into 100 sec bins |
 |
|
| Module-wise count rates for Quadrant A Data is divided into 100 sec bins |
 |
 |
| Module-wise count rates for Quadrant B Data is divided into 100 sec bins |
 |
 |
| Module-wise count rates for Quadrant C Data is divided into 100 sec bins |
 |
 |
| Module-wise count rates for Quadrant D Data is divided into 100 sec bins |
 |
 |
| Parameter | Plot |
|---|---|
| CZT HV Monitor |  |
| D_VDD |  |
| Temperature 1 |  |
| Veto HV Monitor |  |
| Veto LLD |  |
| Alpha Counter |  |
| _CPM_Rate |  |
| CZT Counter |  |
| +2.5 Volts monitor |  |
| +5 Volts monitor |  |
| _ROLL_ROT |  |
| _Roll_DEC |  |
| _Roll_RA |  |
| Veto Counter |  |