| Param | Original file | Final file |
|---|---|---|
| Filename | modeM0/AS1A08_003T05_9000003426_23178cztM0_level2.evt | modeM0/AS1A08_003T05_9000003426_23178cztM0_level2_quad_clean.evt |
| Size (bytes) | 388,837,440 | 46,111,680 |
| Size | 370.8 MB | 44.0 MB |
| Events in quadrant A | 3,039,989 | 273,602 |
| Events in quadrant B | 2,107,375 | 288,574 |
| Events in quadrant C | 2,320,707 | 273,518 |
| Events in quadrant D | 4,026,970 | 269,333 |
| Mode M9 | |||
|---|---|---|---|
| Quadrant | BADHDUFLAG | Total packets | Discarded packets |
| A | 0 | 2 | 0 |
| B | 0 | 2 | 0 |
| C | 0 | 2 | 0 |
| D | 0 | 2 | 0 |
| Mode M0 | |||
|---|---|---|---|
| Quadrant | BADHDUFLAG | Total packets | Discarded packets |
| A | 0 | 11882 | 2 |
| B | 0 | 8788 | 2 |
| C | 0 | 9376 | 2 |
| D | 0 | 14838 | 3 |
| Mode SS | |||
|---|---|---|---|
| Quadrant | BADHDUFLAG | Total packets | Discarded packets |
| A | 0 | 88 | 0 |
| B | 0 | 88 | 0 |
| C | 0 | 88 | 0 |
| D | 0 | 88 | 0 |
| Quadrant | Total seconds | Saturated seconds | Saturation percentage |
|---|---|---|---|
| A | 4118 | 427 | 10.369111% |
| B | 4118 | 129 | 3.132589% |
| C | 4118 | 154 | 3.739679% |
| D | 4117 | 861 | 20.913286% |
Noise dominated data is calculated using 1-second bins in cleaned event files. If a bin has >2000 counts, and if more than 50% of those come from <1% of pixels, then it is considered to be noise-dominated and hence unusable.
| Quadrant | # 1 sec bins | Bins with >0 counts | Bins with >2000 counts | High rate bins dominated by noise | Noise dominated (total time) | Noise dominated (detector-on time) | Marked lightcurve |
|---|---|---|---|---|---|---|---|
| A | 4403 | 4119 | 222 | 222 | 5.04% | 5.39% | 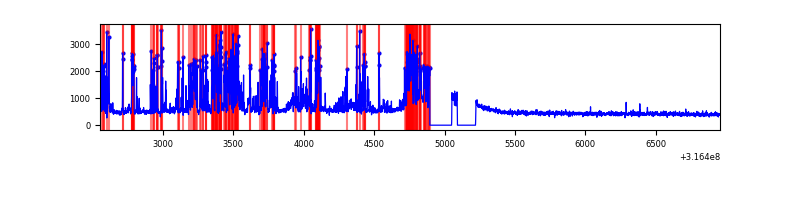 |
| B | 4403 | 4120 | 0 | 0 | 0.00% | 0.00% | 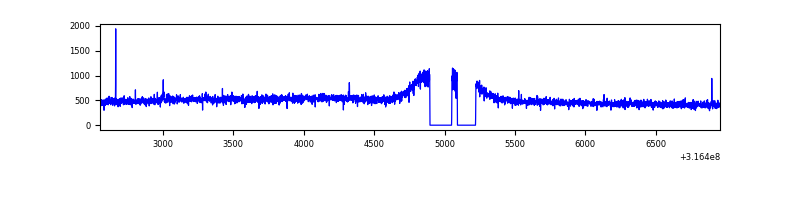 |
| C | 4403 | 4120 | 7 | 7 | 0.16% | 0.17% | 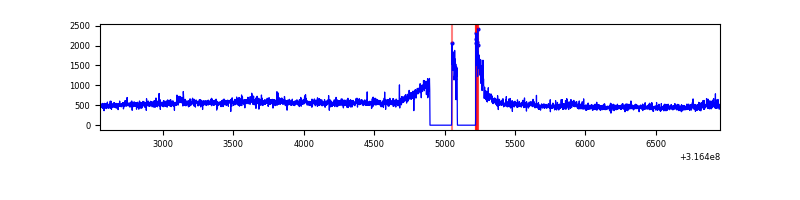 |
| D | 4402 | 4119 | 591 | 591 | 13.43% | 14.35% | 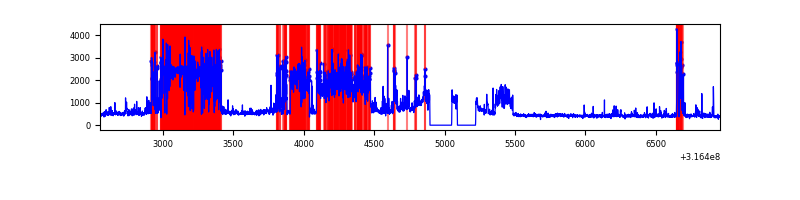 |
Top three noisy pixels from each quadrant. If the there are fewer than three noisy pixels in the level2.evt file, extra rows are filled as -1
| Pixel properties | Quadrant properties | ||||||
|---|---|---|---|---|---|---|---|
| Quadrant | DetID | PixID | Counts | Sigma | Mean | Median | Sigma |
| A | 6 | 16 | 1053262 | 9931.25 | 515 | 504 | 106.0 |
| A | 13 | 254 | 5923 | 51.12 | 515 | 504 | 106.0 |
| A | 3 | 137 | 4770 | 40.24 | 515 | 504 | 106.0 |
| B | 12 | 111 | 13128 | 117.48 | 536 | 520 | 107.3 |
| B | 11 | 111 | 11622 | 103.45 | 536 | 520 | 107.3 |
| B | 14 | 111 | 10072 | 89.0 | 536 | 520 | 107.3 |
| C | 0 | 10 | 241402 | 1957.9 | 510 | 513 | 123.0 |
| C | 14 | 238 | 81147 | 655.38 | 510 | 513 | 123.0 |
| C | 7 | 247 | 7438 | 56.29 | 510 | 513 | 123.0 |
| D | 12 | 233 | 1012540 | 8340.18 | 481 | 466 | 121.3 |
| D | 7 | 238 | 1002360 | 8256.29 | 481 | 466 | 121.3 |
| D | 13 | 153 | 134092 | 1101.17 | 481 | 466 | 121.3 |
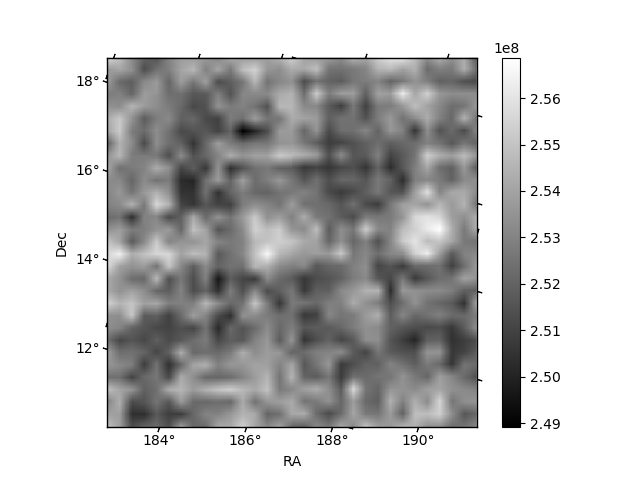
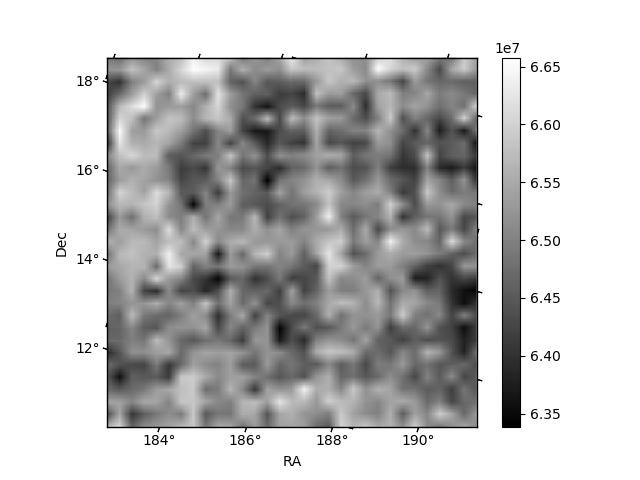
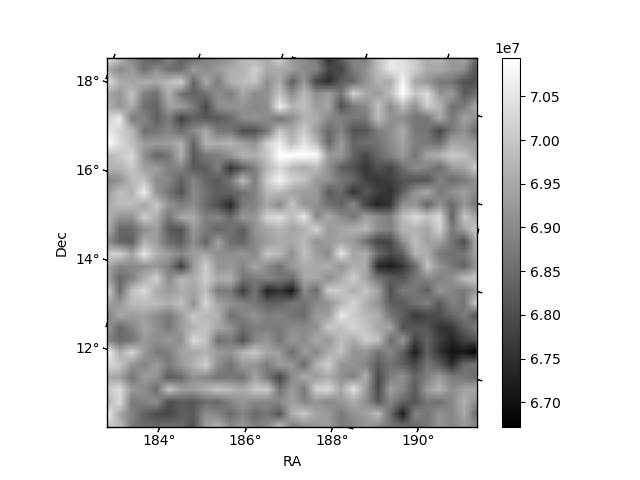
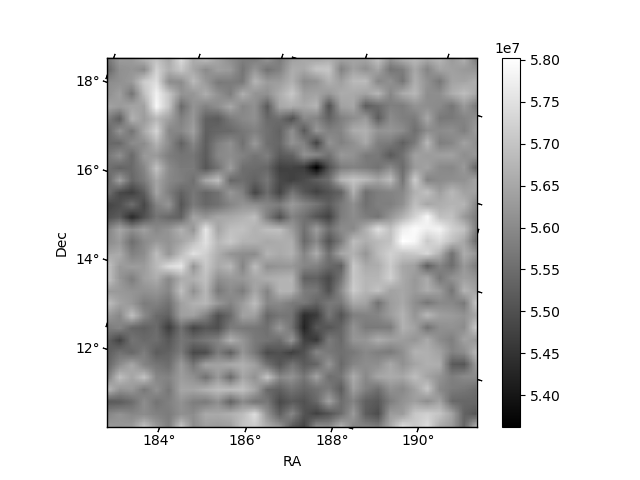
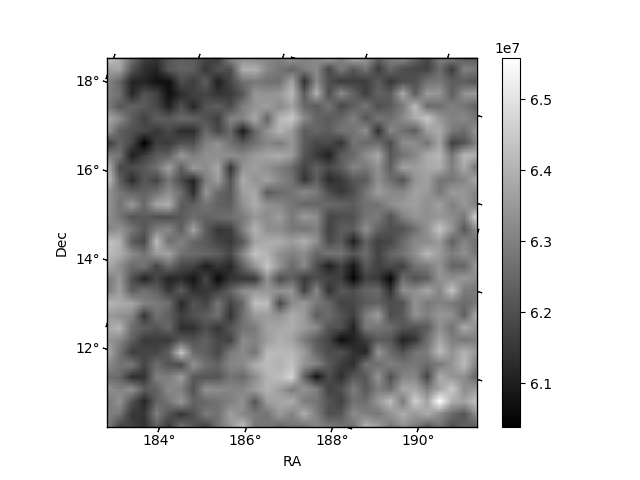
Histogram calculated using DETX and DETY for each event in the final _common_clean file
| Quadrant A | 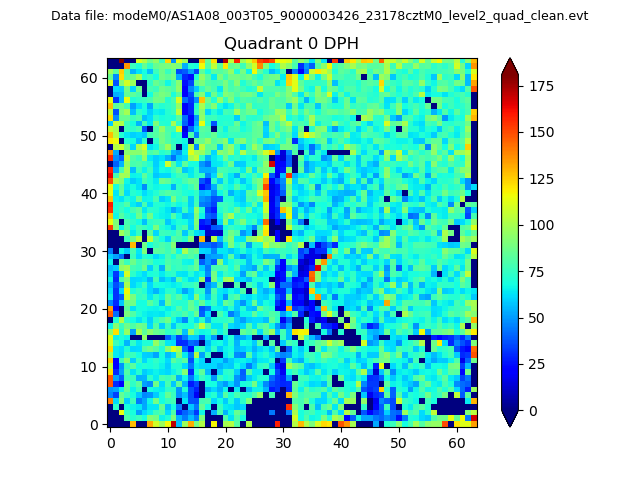 |
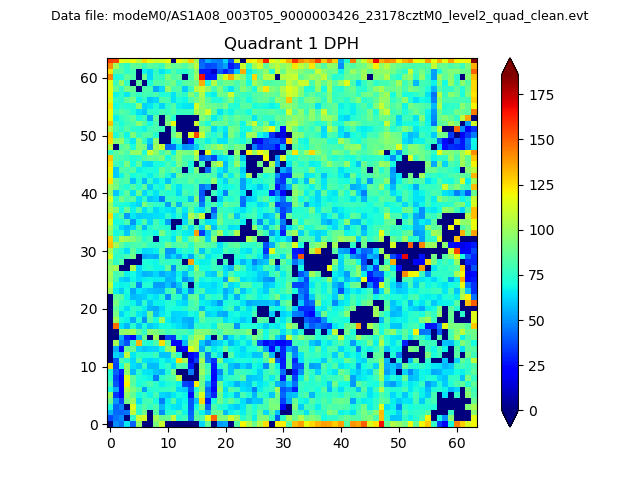 |
Quadrant B |
|---|---|---|---|
| Quadrant D | 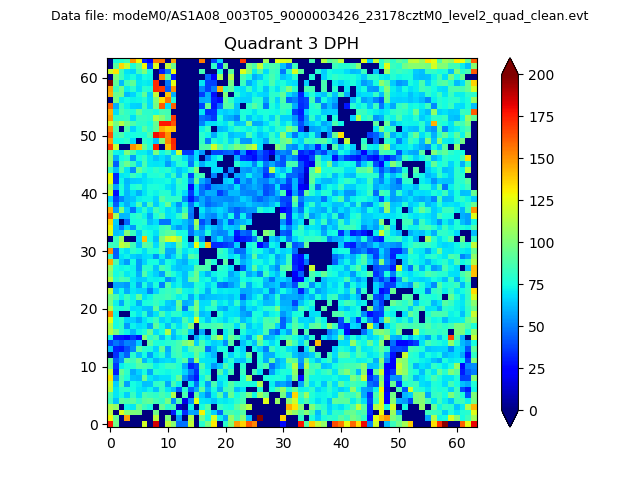 |
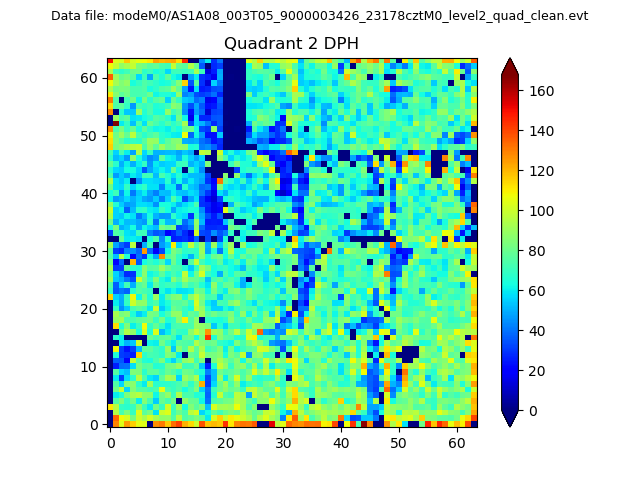 |
Quadrant C |
| Plot type | Count rate plots | Images |
|---|---|---|
| Comparison with Poisson distribution Blue bars denote a histogram of data divided into 1 sec bins. Red curve is a Poisson curve with rate = median count rate of data. |
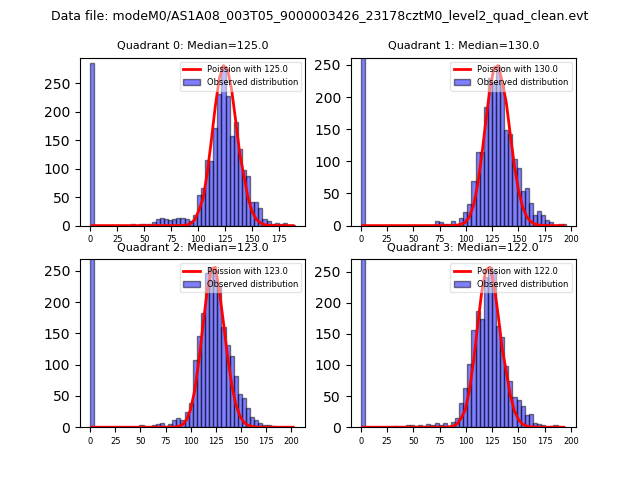 |
 |
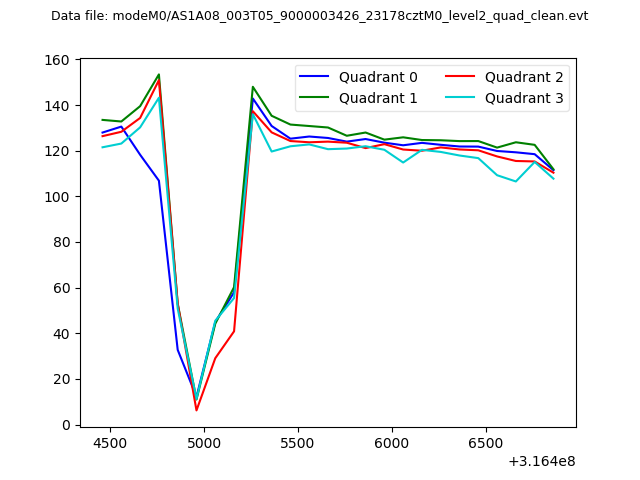
| Quadrant-wise count rates Data is divided into 100 sec bins |
 |
|
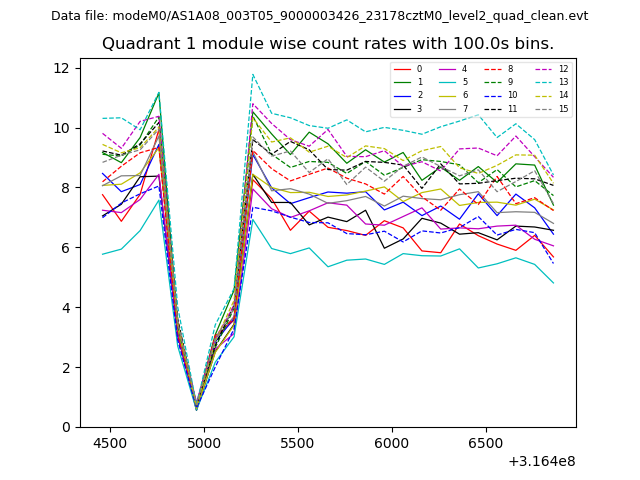
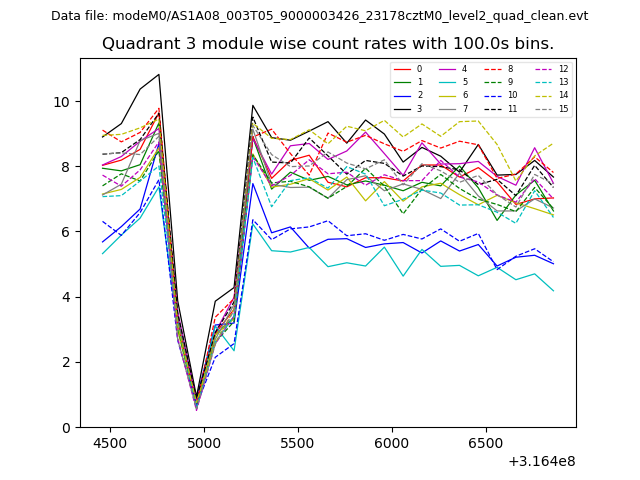
| Module-wise count rates for Quadrant A Data is divided into 100 sec bins |
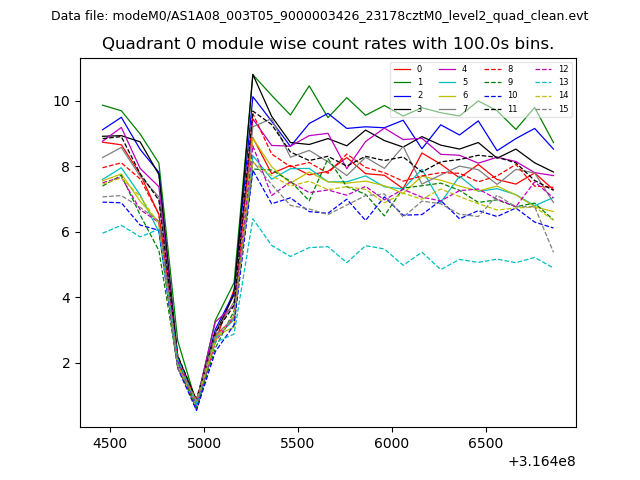 |
 |
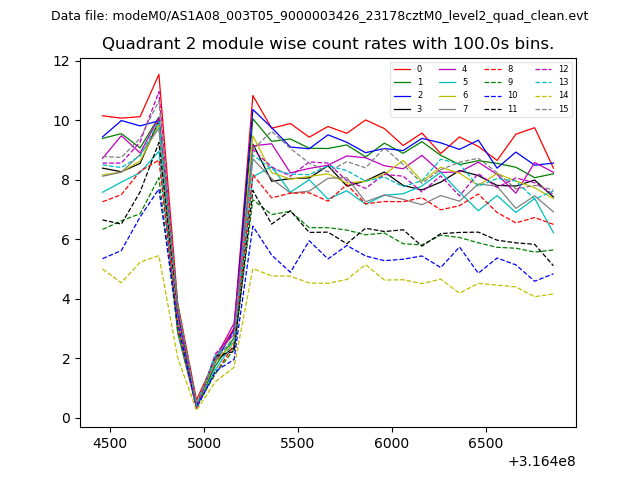
| Module-wise count rates for Quadrant B Data is divided into 100 sec bins |
 |
 |
| Module-wise count rates for Quadrant C Data is divided into 100 sec bins |
 |
 |
| Module-wise count rates for Quadrant D Data is divided into 100 sec bins |
 |
 |
| Parameter | Plot |
|---|---|
| CZT HV Monitor | 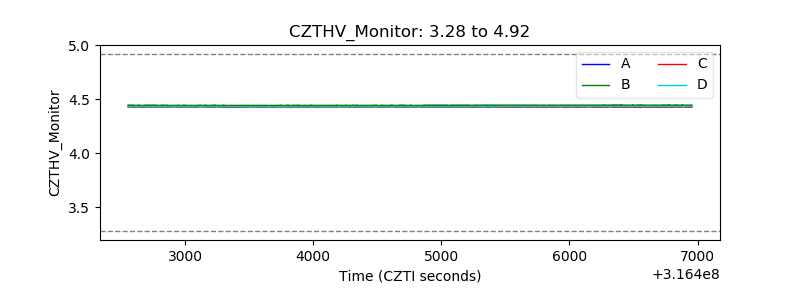 |
| D_VDD | 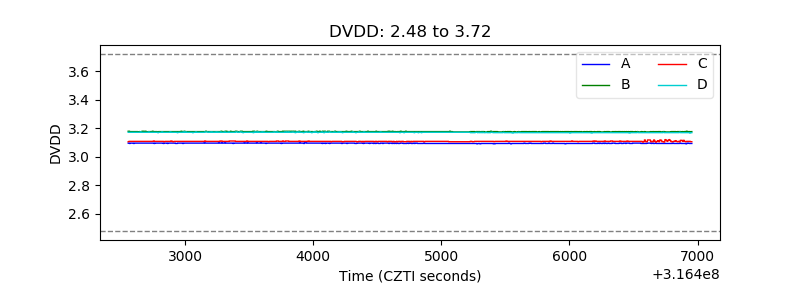 |
| Temperature 1 | 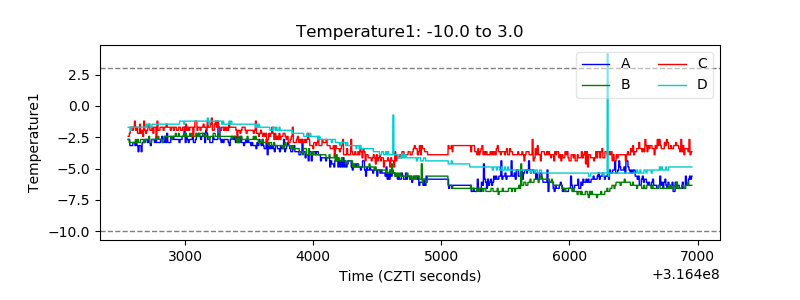 |
| Veto HV Monitor | 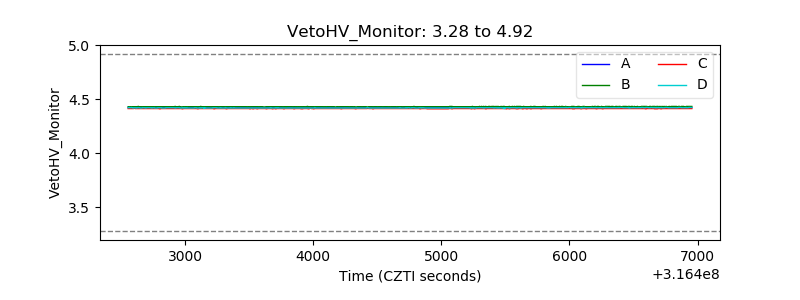 |
| Veto LLD | 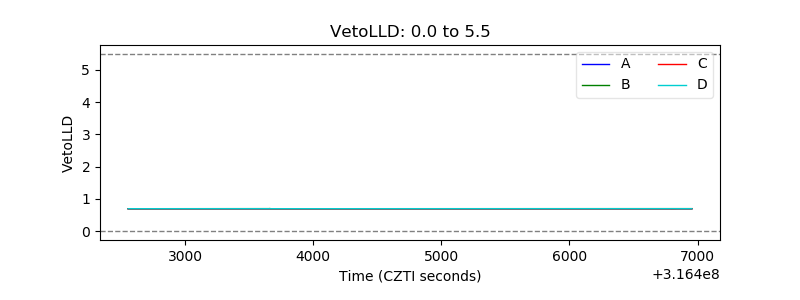 |
| Alpha Counter | 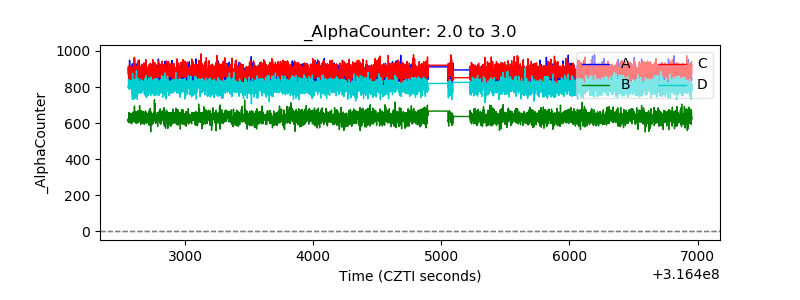 |
| _CPM_Rate | 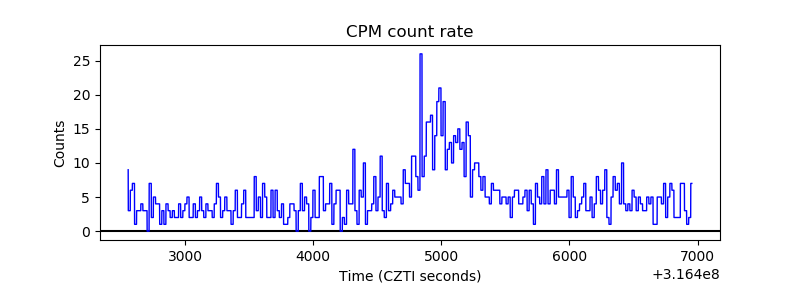 |
| CZT Counter | 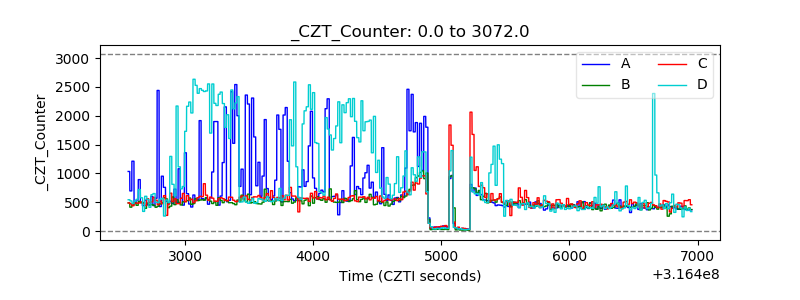 |
| +2.5 Volts monitor |  |
| +5 Volts monitor | 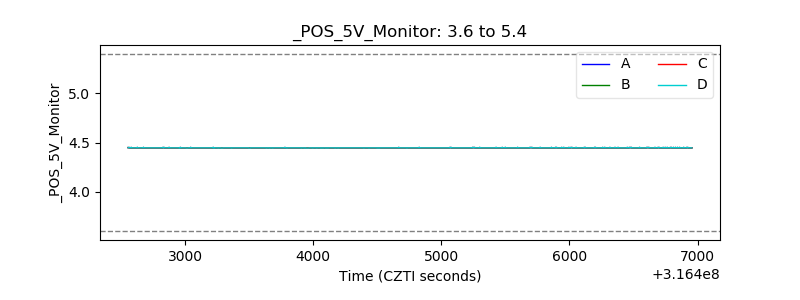 |
| _ROLL_ROT | 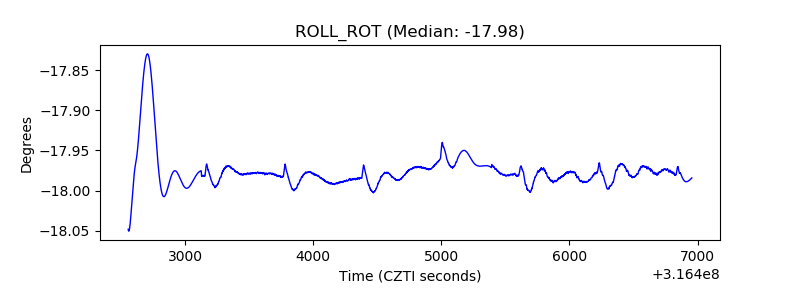 |
| _Roll_DEC | 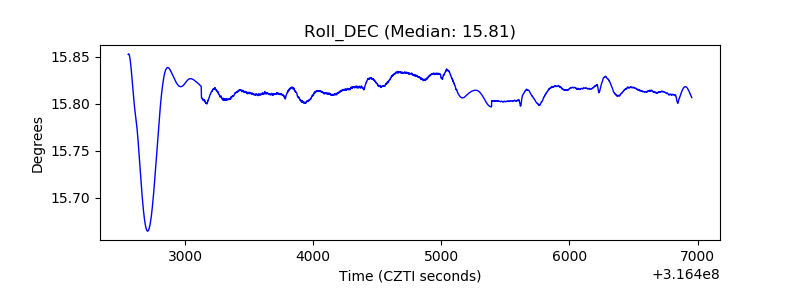 |
| _Roll_RA | 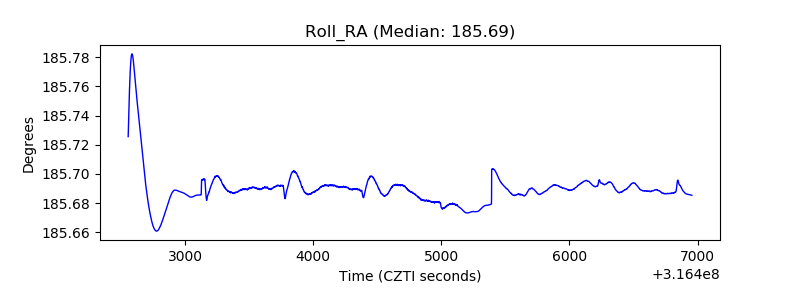 |
| Veto Counter |  |