| Param | Original file | Final file |
|---|---|---|
| Filename | modeM0/AS1A08_003T05_9000003426_23182cztM0_level2.evt | modeM0/AS1A08_003T05_9000003426_23182cztM0_level2_quad_clean.evt |
| Size (bytes) | 1,683,146,880 | 233,519,040 |
| Size | 1.6 GB | 222.7 MB |
| Events in quadrant A | 13,538,841 | 1,415,428 |
| Events in quadrant B | 9,111,029 | 1,513,379 |
| Events in quadrant C | 10,382,701 | 1,446,348 |
| Events in quadrant D | 16,660,208 | 1,387,029 |
| Mode M9 | |||
|---|---|---|---|
| Quadrant | BADHDUFLAG | Total packets | Discarded packets |
| A | 0 | 20 | 0 |
| B | 0 | 20 | 0 |
| C | 0 | 20 | 0 |
| D | 0 | 20 | 0 |
| Mode M0 | |||
|---|---|---|---|
| Quadrant | BADHDUFLAG | Total packets | Discarded packets |
| A | 0 | 52509 | 4 |
| B | 0 | 39065 | 4 |
| C | 0 | 42546 | 4 |
| D | 0 | 62490 | 4 |
| Mode SS | |||
|---|---|---|---|
| Quadrant | BADHDUFLAG | Total packets | Discarded packets |
| A | 0 | 388 | 0 |
| B | 0 | 388 | 0 |
| C | 0 | 388 | 0 |
| D | 0 | 388 | 0 |
| Quadrant | Total seconds | Saturated seconds | Saturation percentage |
|---|---|---|---|
| A | 19008 | 1911 | 10.053662% |
| B | 19009 | 300 | 1.578200% |
| C | 19009 | 604 | 3.177442% |
| D | 19009 | 2041 | 10.737019% |
Noise dominated data is calculated using 1-second bins in cleaned event files. If a bin has >2000 counts, and if more than 50% of those come from <1% of pixels, then it is considered to be noise-dominated and hence unusable.
| Quadrant | # 1 sec bins | Bins with >0 counts | Bins with >2000 counts | High rate bins dominated by noise | Noise dominated (total time) | Noise dominated (detector-on time) | Marked lightcurve |
|---|---|---|---|---|---|---|---|
| A | 20868 | 19012 | 1346 | 1346 | 6.45% | 7.08% | 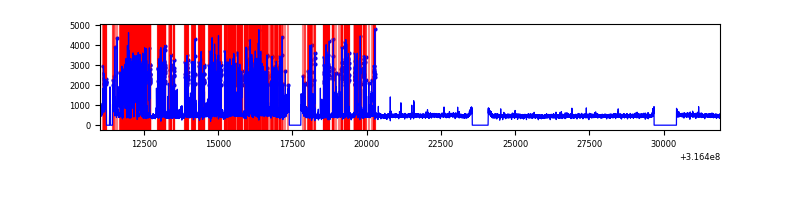 |
| B | 20869 | 19014 | 8 | 8 | 0.04% | 0.04% | 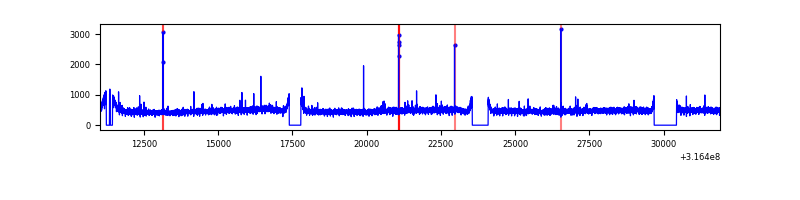 |
| C | 20869 | 19014 | 171 | 171 | 0.82% | 0.90% | 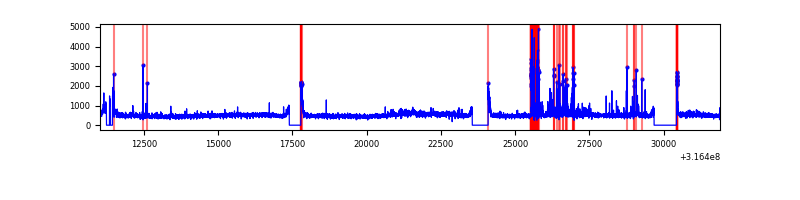 |
| D | 20869 | 19013 | 1439 | 1439 | 6.90% | 7.57% | 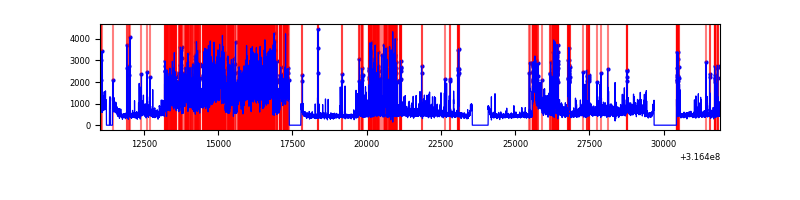 |
Top three noisy pixels from each quadrant. If the there are fewer than three noisy pixels in the level2.evt file, extra rows are filled as -1
| Pixel properties | Quadrant properties | ||||||
|---|---|---|---|---|---|---|---|
| Quadrant | DetID | PixID | Counts | Sigma | Mean | Median | Sigma |
| A | 6 | 16 | 4897846 | 10813.91 | 2240 | 2186 | 452.7 |
| A | 13 | 254 | 25968 | 52.53 | 2240 | 2186 | 452.7 |
| A | 3 | 137 | 20275 | 39.96 | 2240 | 2186 | 452.7 |
| B | 12 | 111 | 55974 | 119.89 | 2306 | 2245 | 448.2 |
| B | 11 | 111 | 50393 | 107.44 | 2306 | 2245 | 448.2 |
| B | 14 | 111 | 44724 | 94.79 | 2306 | 2245 | 448.2 |
| C | 0 | 10 | 705677 | 1369.1 | 2201 | 2210 | 513.8 |
| C | 10 | 9 | 546461 | 1059.23 | 2201 | 2210 | 513.8 |
| C | 14 | 238 | 345568 | 668.25 | 2201 | 2210 | 513.8 |
| D | 7 | 238 | 5046721 | 9464.03 | 2182 | 2116 | 533.0 |
| D | 12 | 233 | 1959797 | 3672.75 | 2182 | 2116 | 533.0 |
| D | 1 | 52 | 512722 | 957.93 | 2182 | 2116 | 533.0 |
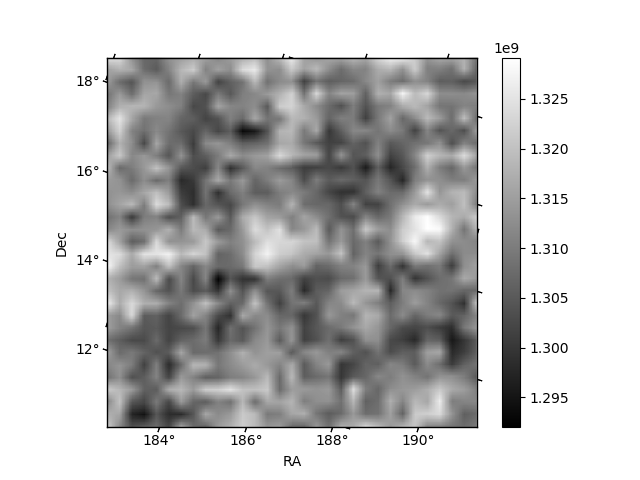
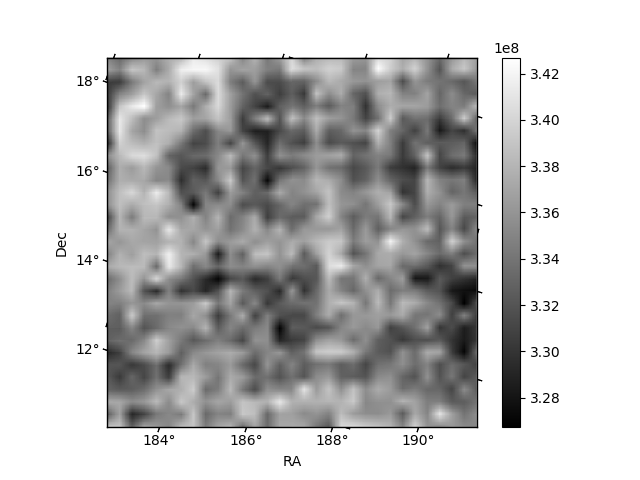
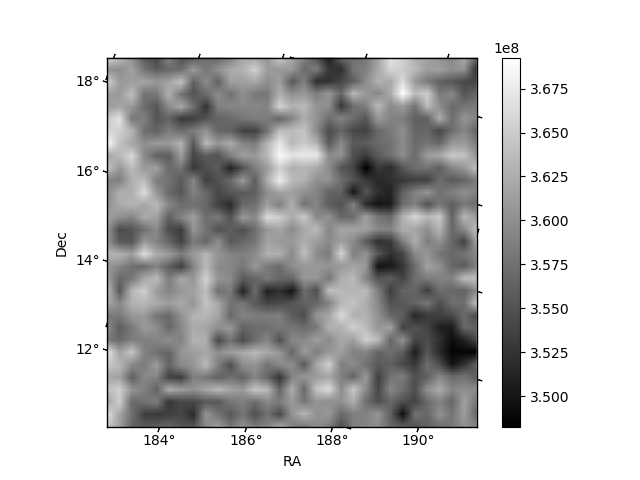
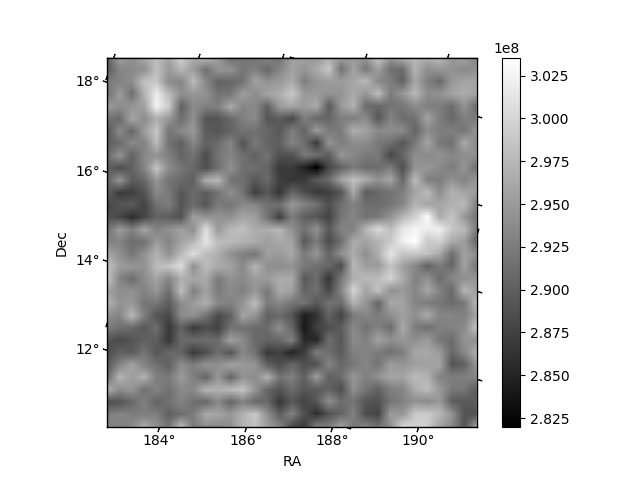
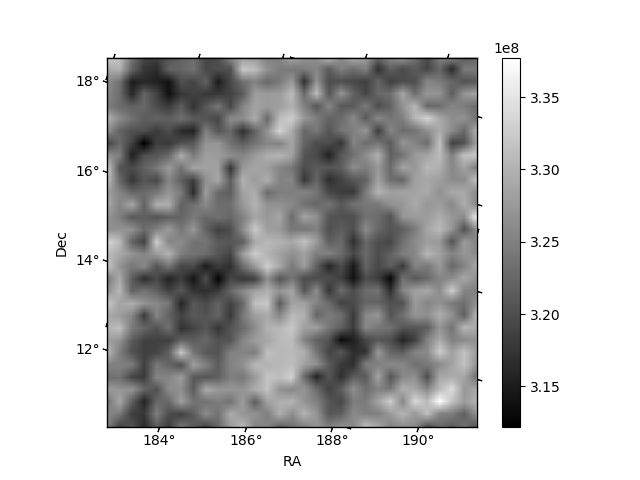
Histogram calculated using DETX and DETY for each event in the final _common_clean file
| Quadrant A | 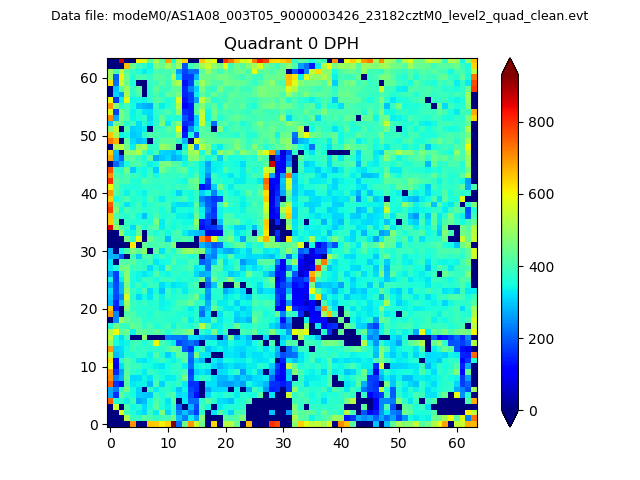 |
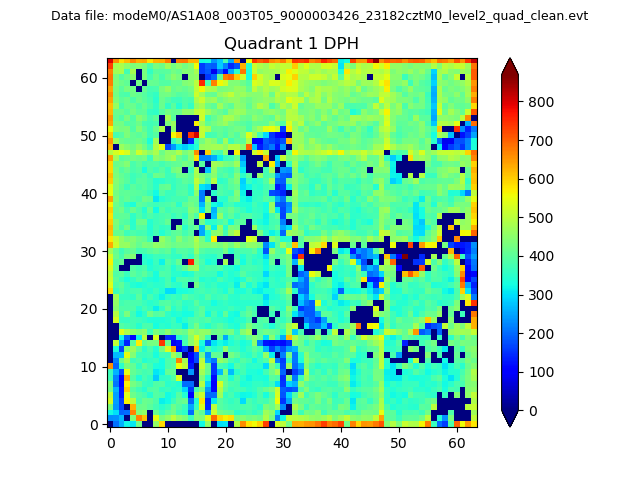 |
Quadrant B |
|---|---|---|---|
| Quadrant D | 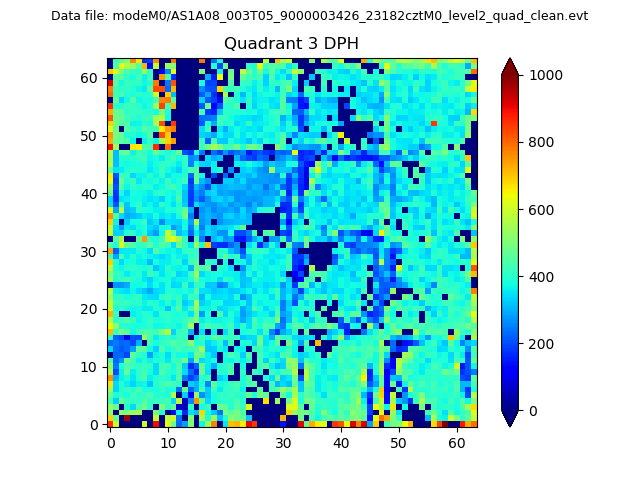 |
 |
Quadrant C |
| Plot type | Count rate plots | Images |
|---|---|---|
| Comparison with Poisson distribution Blue bars denote a histogram of data divided into 1 sec bins. Red curve is a Poisson curve with rate = median count rate of data. |
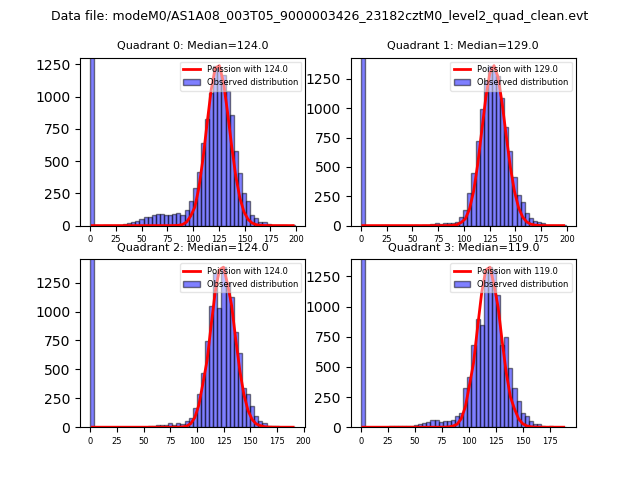 |
 |
| Quadrant-wise count rates Data is divided into 100 sec bins |
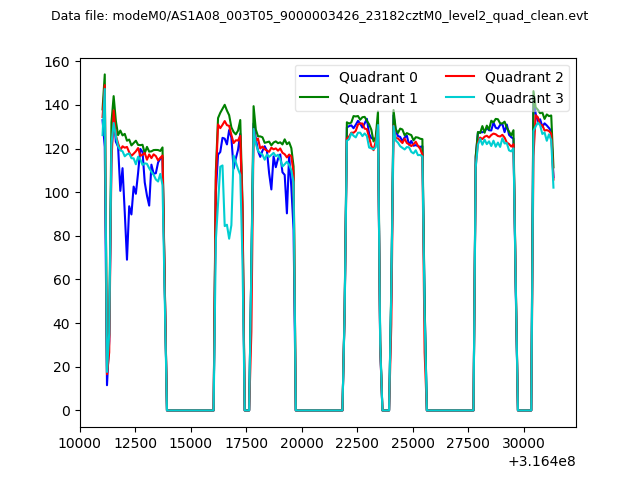 |
|
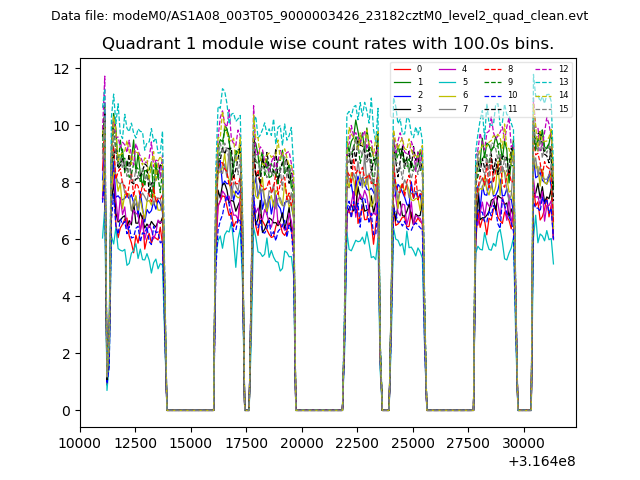
| Module-wise count rates for Quadrant A Data is divided into 100 sec bins |
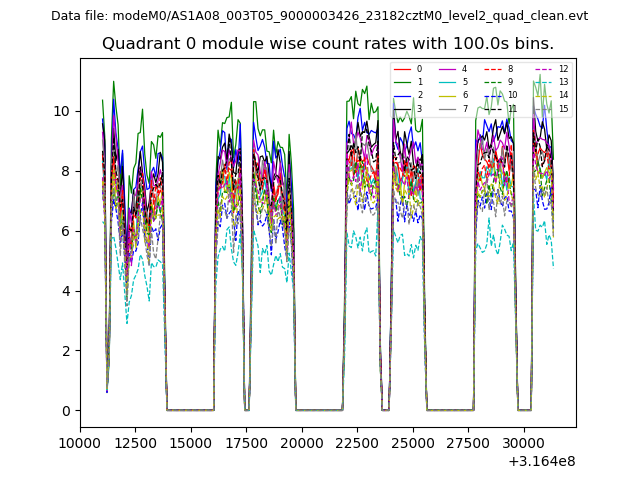 |
 |
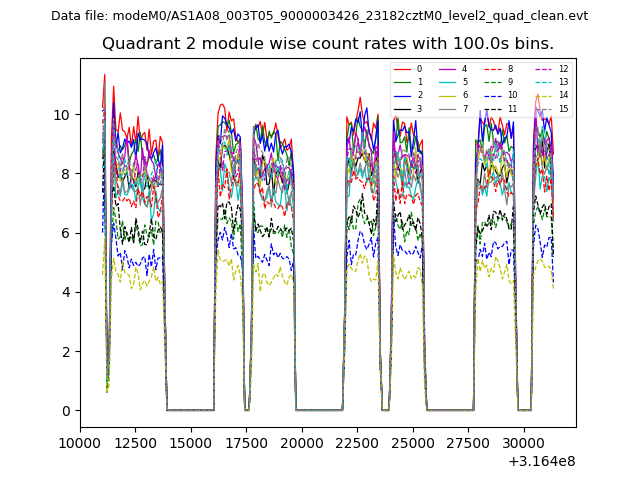
| Module-wise count rates for Quadrant B Data is divided into 100 sec bins |
 |
 |
| Module-wise count rates for Quadrant C Data is divided into 100 sec bins |
 |
 |
| Module-wise count rates for Quadrant D Data is divided into 100 sec bins |
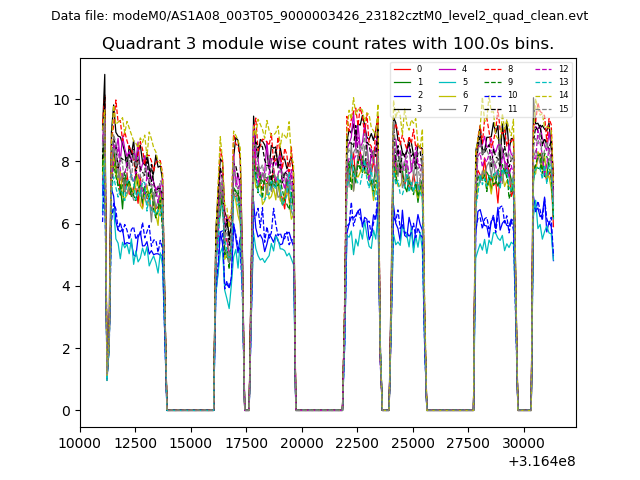 |
 |
| Parameter | Plot |
|---|---|
| CZT HV Monitor |  |
| D_VDD | 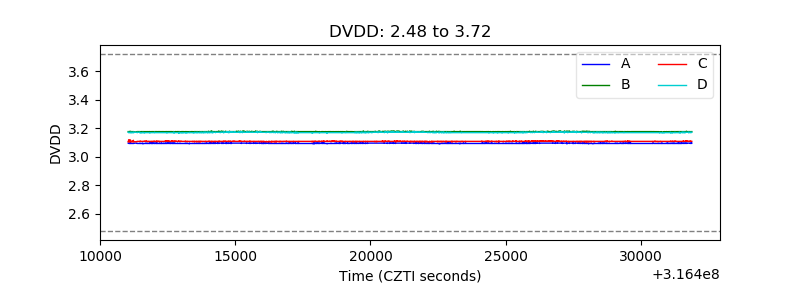 |
| Temperature 1 |  |
| Veto HV Monitor | 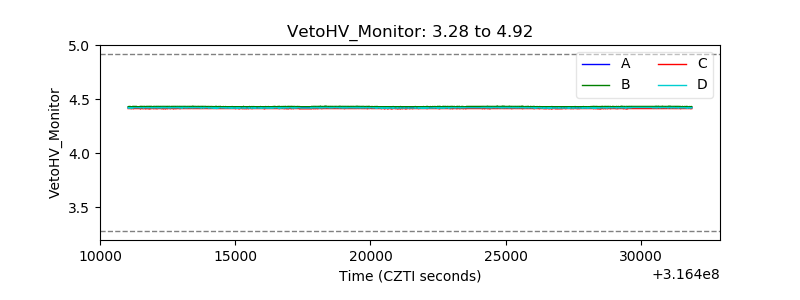 |
| Veto LLD | 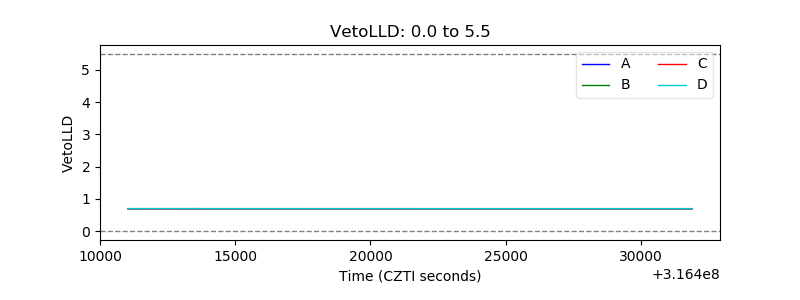 |
| Alpha Counter | 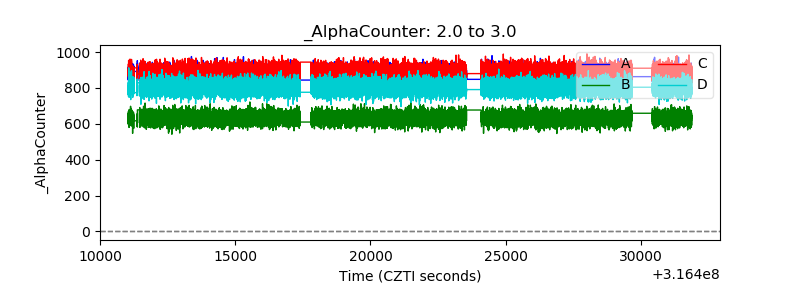 |
| _CPM_Rate | 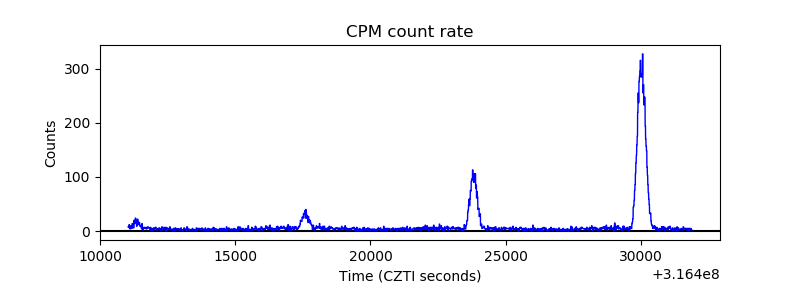 |
| CZT Counter |  |
| +2.5 Volts monitor |  |
| +5 Volts monitor |  |
| _ROLL_ROT | 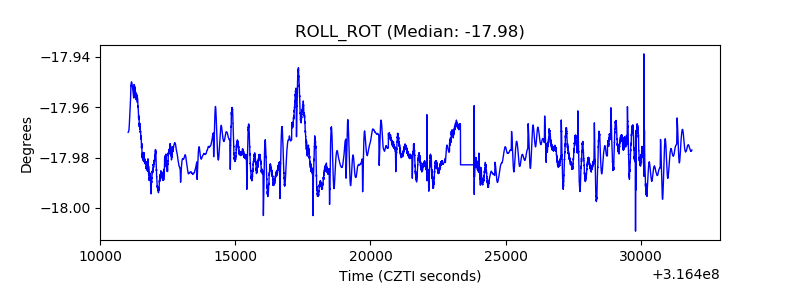 |
| _Roll_DEC | 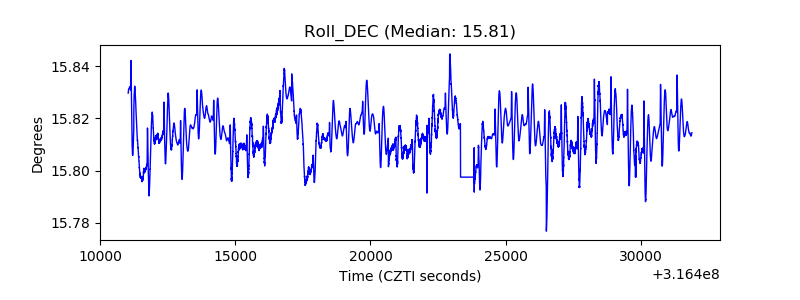 |
| _Roll_RA |  |
| Veto Counter | 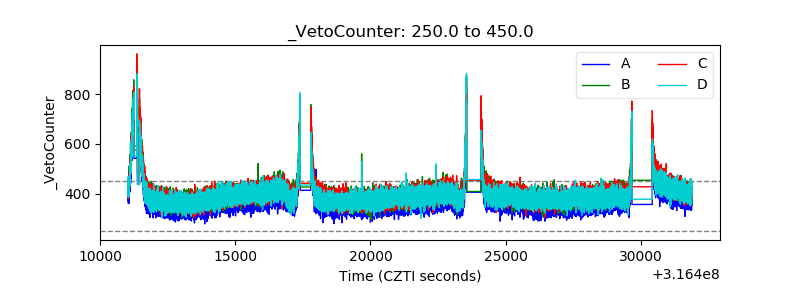 |