| Param | Original file | Final file |
|---|---|---|
| Filename | modeM0/AS1A08_003T05_9000003426_23183cztM0_level2.evt | modeM0/AS1A08_003T05_9000003426_23183cztM0_level2_quad_clean.evt |
| Size (bytes) | 560,378,880 | 79,128,000 |
| Size | 534.4 MB | 75.5 MB |
| Events in quadrant A | 3,334,844 | 487,404 |
| Events in quadrant B | 3,408,027 | 499,964 |
| Events in quadrant C | 3,606,266 | 476,006 |
| Events in quadrant D | 6,154,256 | 451,818 |
| Mode M9 | |||
|---|---|---|---|
| Quadrant | BADHDUFLAG | Total packets | Discarded packets |
| A | 0 | 9 | 0 |
| B | 0 | 10 | 0 |
| C | 0 | 10 | 0 |
| D | 0 | 10 | 0 |
| Mode M0 | |||
|---|---|---|---|
| Quadrant | BADHDUFLAG | Total packets | Discarded packets |
| A | 0 | 14154 | 2 |
| B | 0 | 14276 | 2 |
| C | 0 | 14821 | 2 |
| D | 0 | 22898 | 5 |
| Mode SS | |||
|---|---|---|---|
| Quadrant | BADHDUFLAG | Total packets | Discarded packets |
| A | 0 | 140 | 0 |
| B | 0 | 140 | 0 |
| C | 0 | 140 | 0 |
| D | 0 | 140 | 0 |
| Quadrant | Total seconds | Saturated seconds | Saturation percentage |
|---|---|---|---|
| A | 6897 | 80 | 1.159925% |
| B | 6897 | 82 | 1.188923% |
| C | 6897 | 166 | 2.406844% |
| D | 6896 | 747 | 10.832367% |
Noise dominated data is calculated using 1-second bins in cleaned event files. If a bin has >2000 counts, and if more than 50% of those come from <1% of pixels, then it is considered to be noise-dominated and hence unusable.
| Quadrant | # 1 sec bins | Bins with >0 counts | Bins with >2000 counts | High rate bins dominated by noise | Noise dominated (total time) | Noise dominated (detector-on time) | Marked lightcurve |
|---|---|---|---|---|---|---|---|
| A | 7772 | 6897 | 0 | 0 | 0.00% | 0.00% | 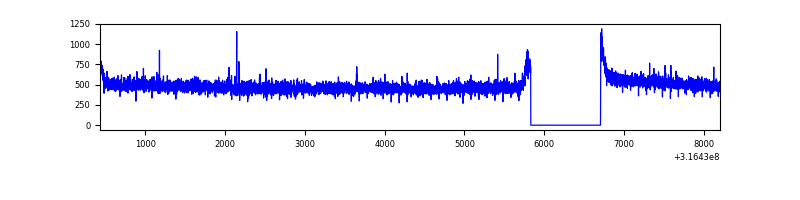 |
| B | 7772 | 6897 | 1 | 1 | 0.01% | 0.01% | 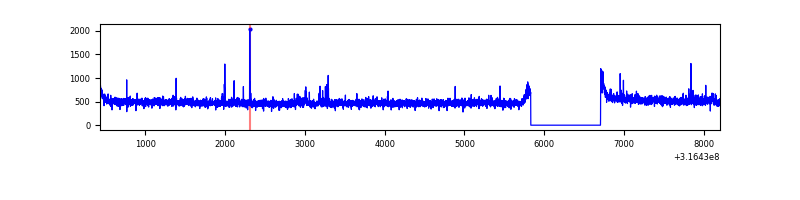 |
| C | 7772 | 6897 | 22 | 22 | 0.28% | 0.32% | 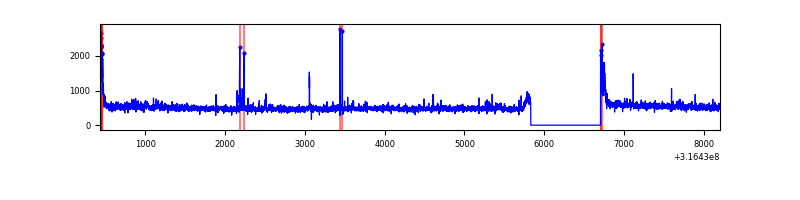 |
| D | 7770 | 6895 | 570 | 570 | 7.34% | 8.27% | 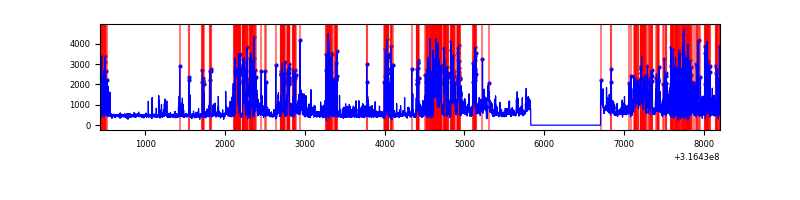 |
Top three noisy pixels from each quadrant. If the there are fewer than three noisy pixels in the level2.evt file, extra rows are filled as -1
| Pixel properties | Quadrant properties | ||||||
|---|---|---|---|---|---|---|---|
| Quadrant | DetID | PixID | Counts | Sigma | Mean | Median | Sigma |
| A | 13 | 254 | 9953 | 52.44 | 863 | 846 | 173.7 |
| A | 3 | 137 | 7637 | 39.11 | 863 | 846 | 173.7 |
| A | 0 | 226 | 7347 | 37.44 | 863 | 846 | 173.7 |
| B | 0 | 190 | 32776 | 192.84 | 855 | 832 | 165.7 |
| B | 12 | 111 | 20163 | 116.7 | 855 | 832 | 165.7 |
| B | 11 | 111 | 18487 | 106.58 | 855 | 832 | 165.7 |
| C | 0 | 10 | 178879 | 917.53 | 824 | 830 | 194.1 |
| C | 14 | 238 | 130102 | 666.17 | 824 | 830 | 194.1 |
| C | 7 | 247 | 45925 | 232.39 | 824 | 830 | 194.1 |
| D | 1 | 52 | 2524322 | 12521.91 | 815 | 789 | 201.5 |
| D | 12 | 233 | 294736 | 1458.58 | 815 | 789 | 201.5 |
| D | 7 | 238 | 120696 | 594.99 | 815 | 789 | 201.5 |
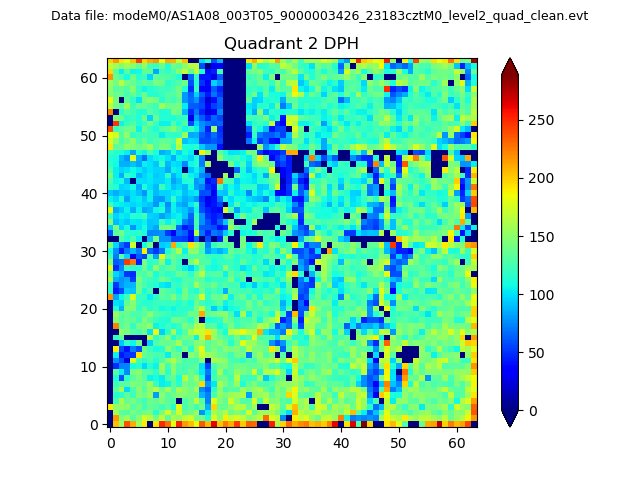
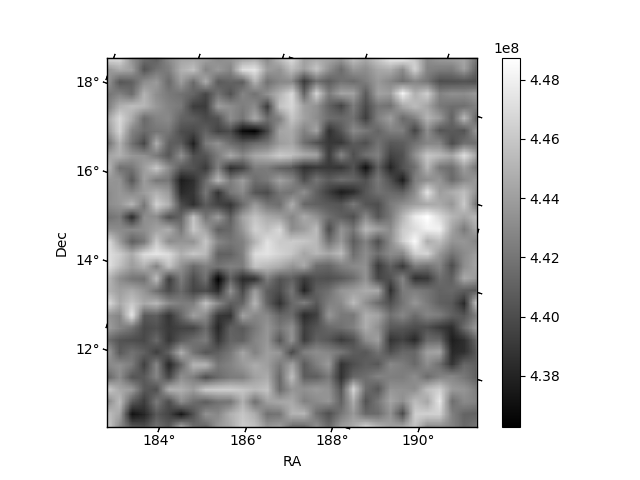
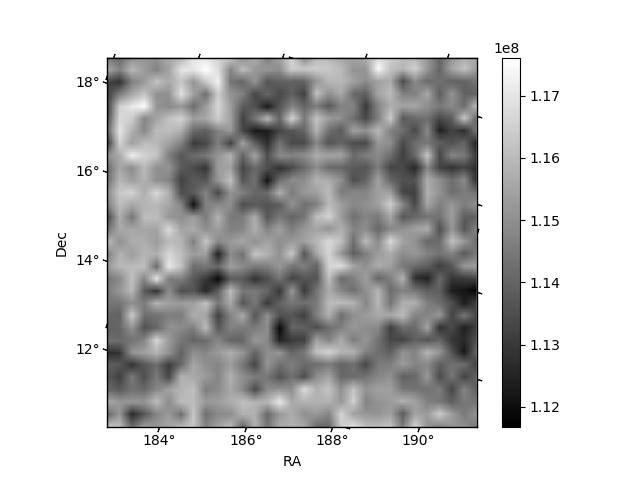
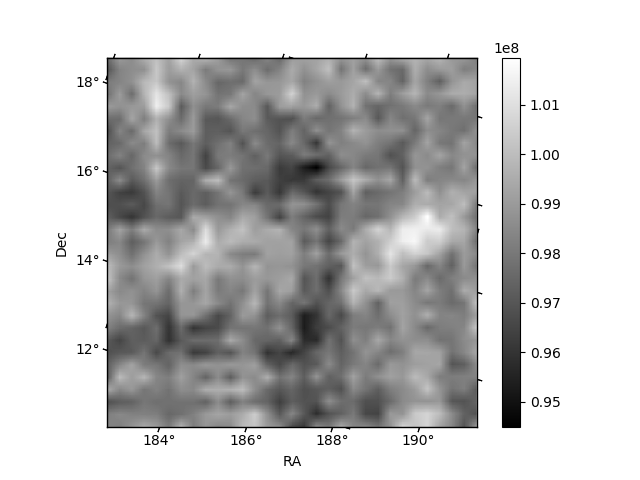
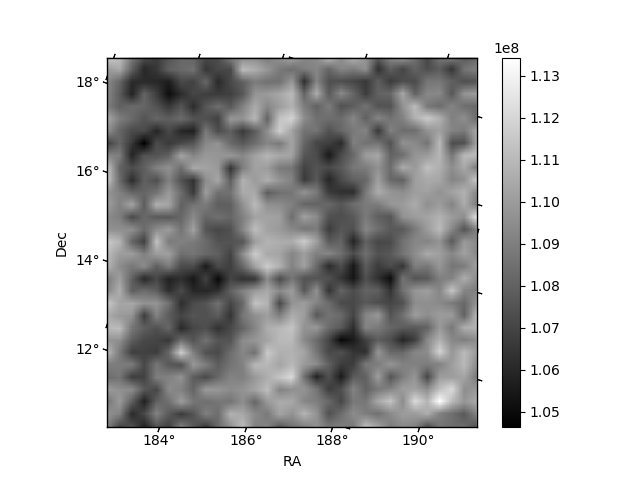
Histogram calculated using DETX and DETY for each event in the final _common_clean file
| Quadrant A | 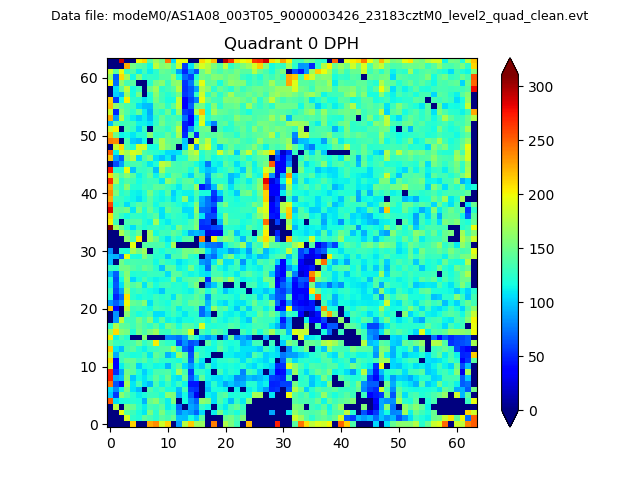 |
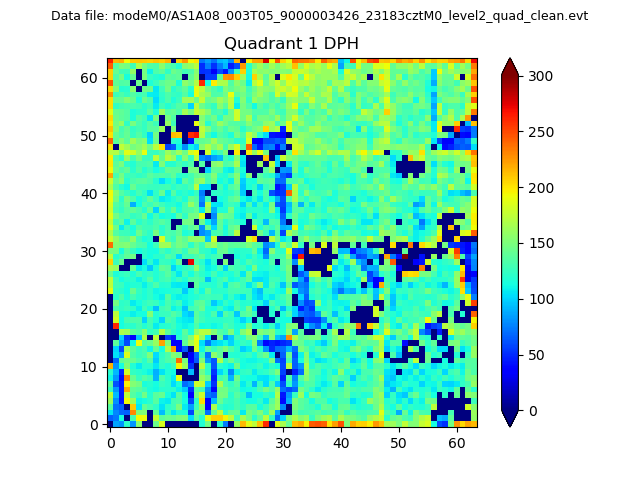 |
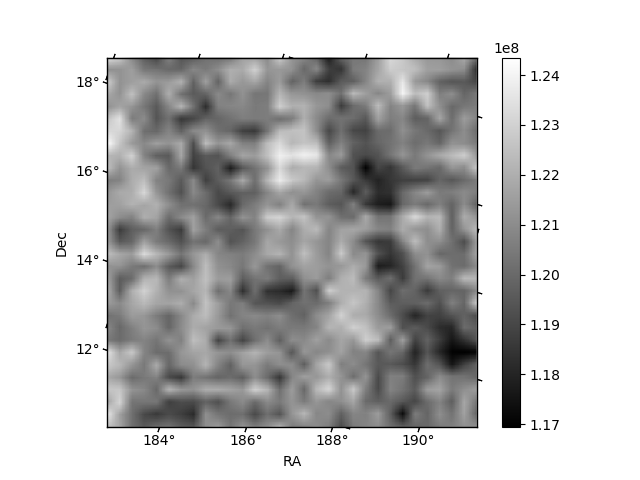
Quadrant B |
|---|---|---|---|
| Quadrant D | 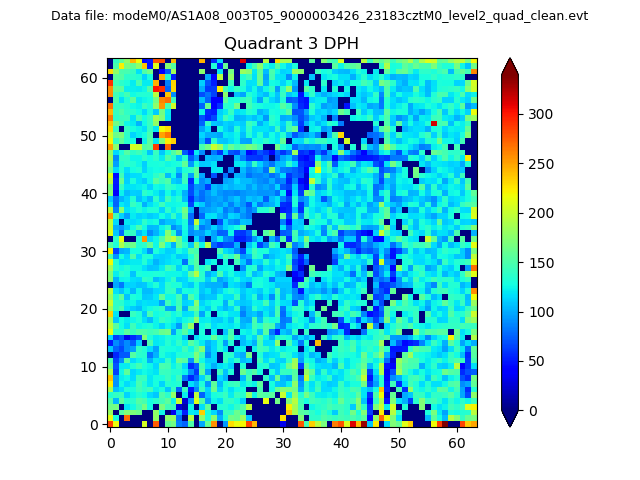 |
 |
Quadrant C |
| Plot type | Count rate plots | Images |
|---|---|---|
| Comparison with Poisson distribution Blue bars denote a histogram of data divided into 1 sec bins. Red curve is a Poisson curve with rate = median count rate of data. |
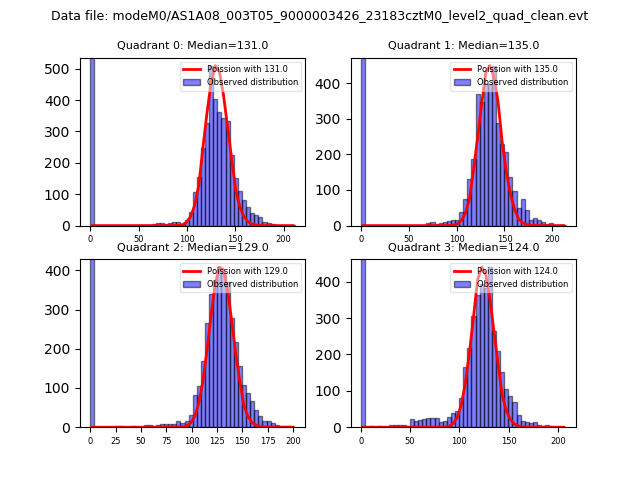 |
 |
| Quadrant-wise count rates Data is divided into 100 sec bins |
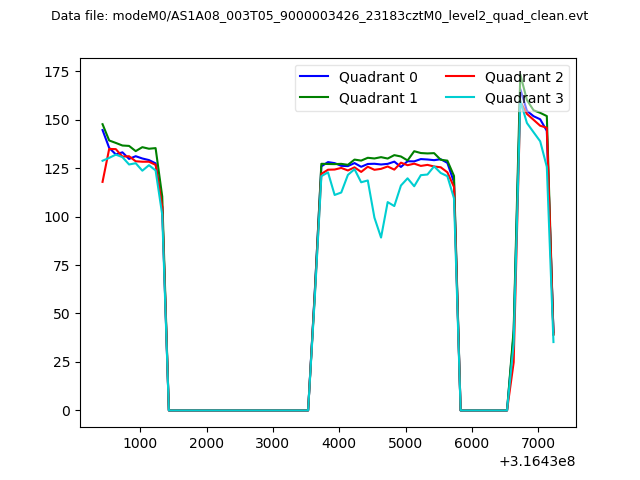 |
|
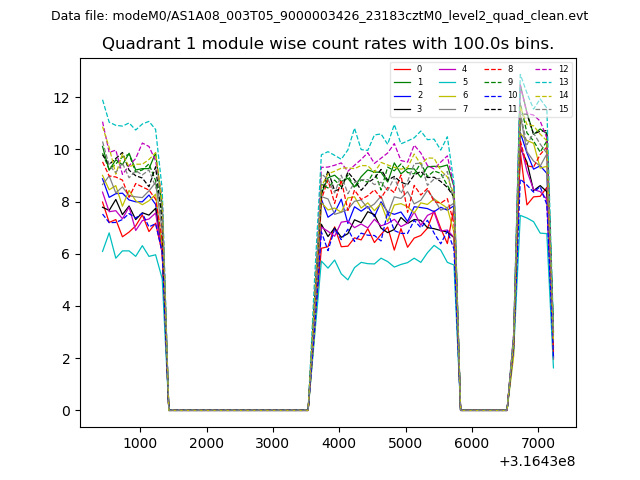
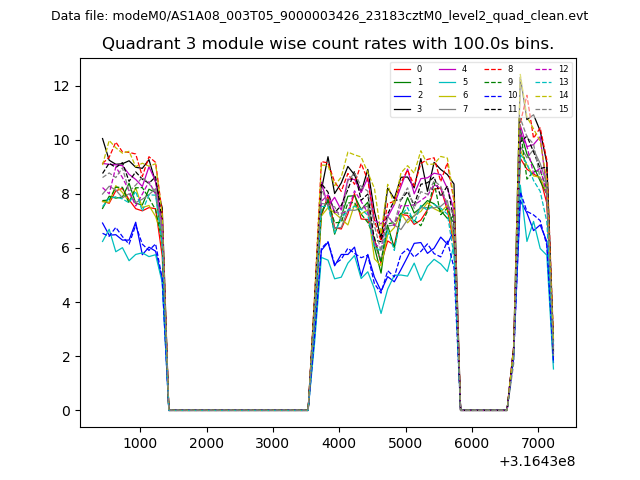
| Module-wise count rates for Quadrant A Data is divided into 100 sec bins |
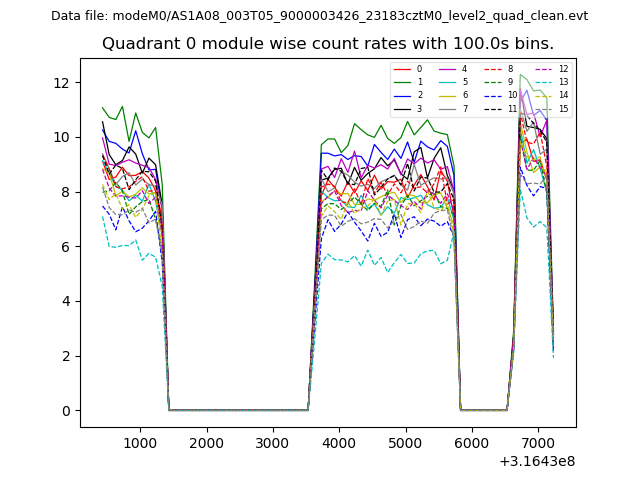 |
 |
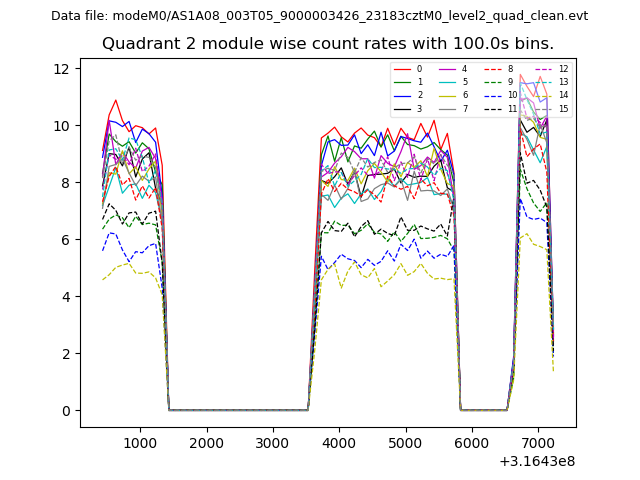
| Module-wise count rates for Quadrant B Data is divided into 100 sec bins |
 |
 |
| Module-wise count rates for Quadrant C Data is divided into 100 sec bins |
 |
 |
| Module-wise count rates for Quadrant D Data is divided into 100 sec bins |
 |
 |
| Parameter | Plot |
|---|---|
| CZT HV Monitor | 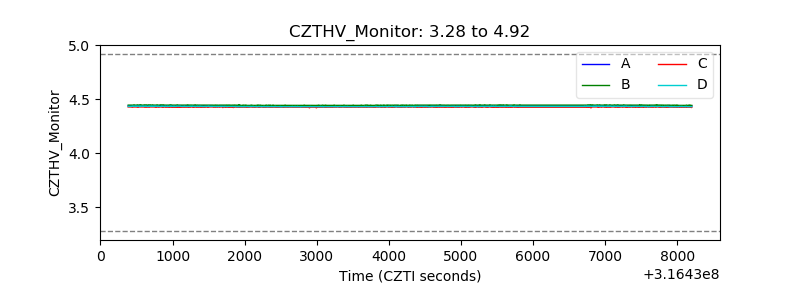 |
| D_VDD | 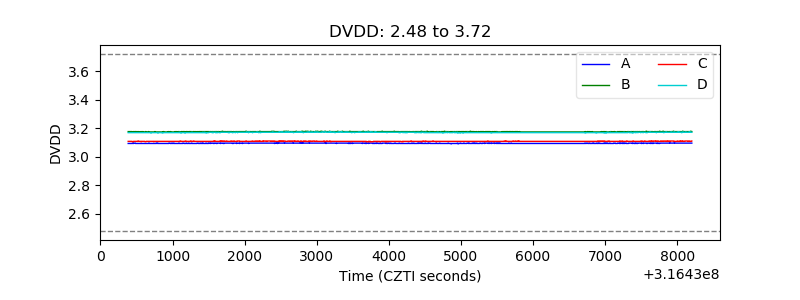 |
| Temperature 1 | 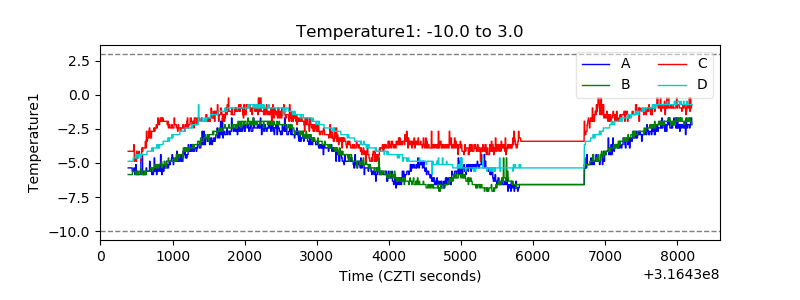 |
| Veto HV Monitor | 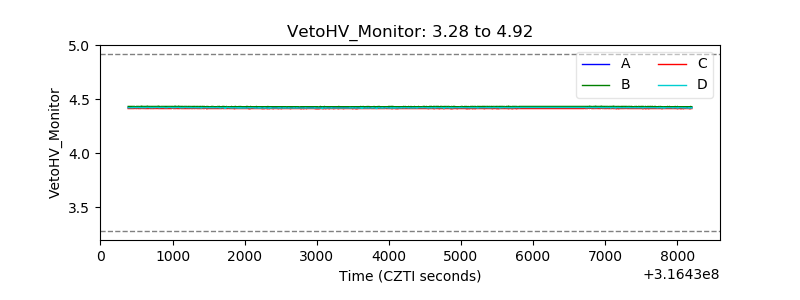 |
| Veto LLD | 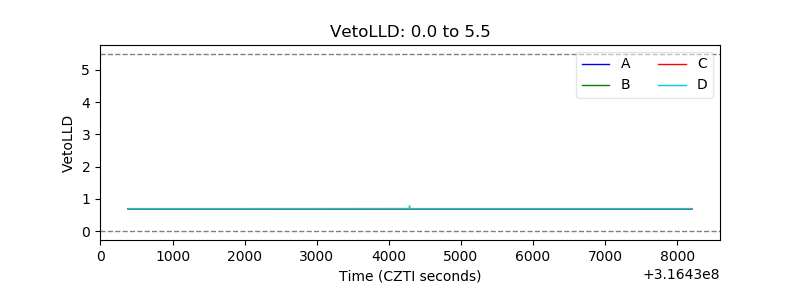 |
| Alpha Counter | 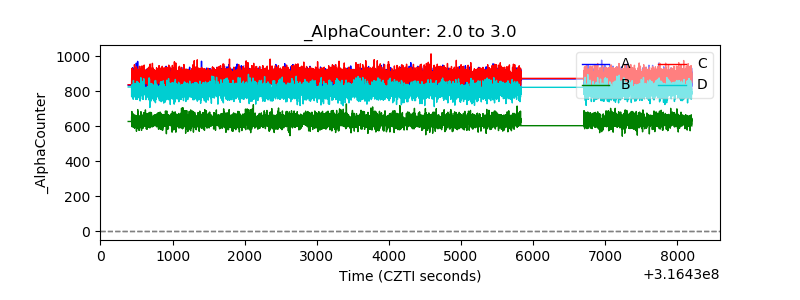 |
| _CPM_Rate | 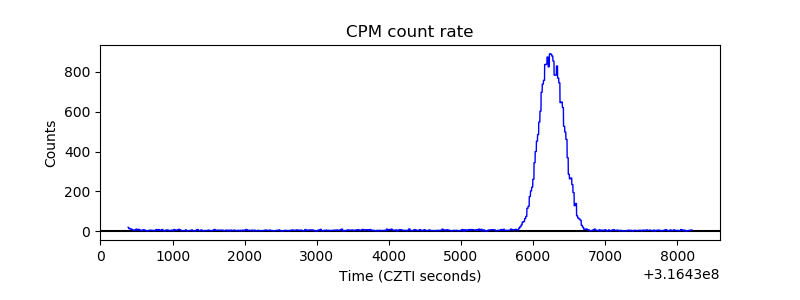 |
| CZT Counter | 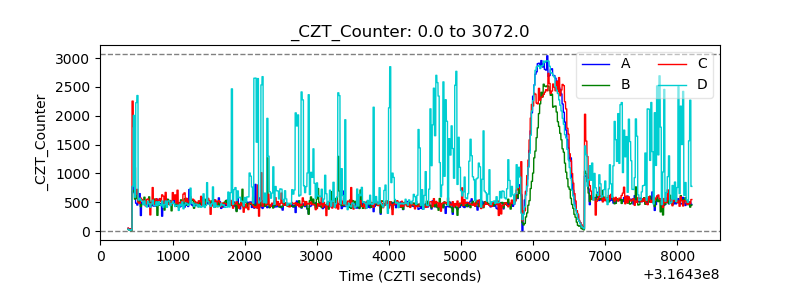 |
| +2.5 Volts monitor |  |
| +5 Volts monitor | 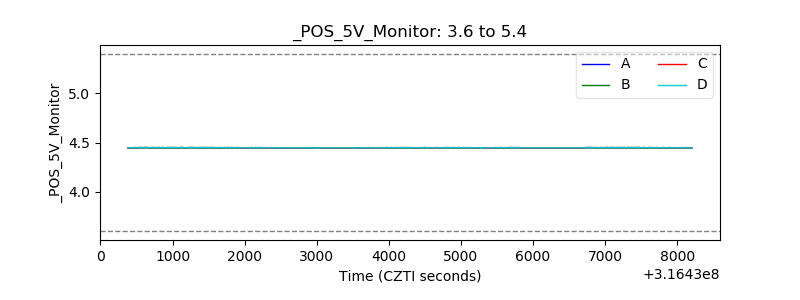 |
| _ROLL_ROT | 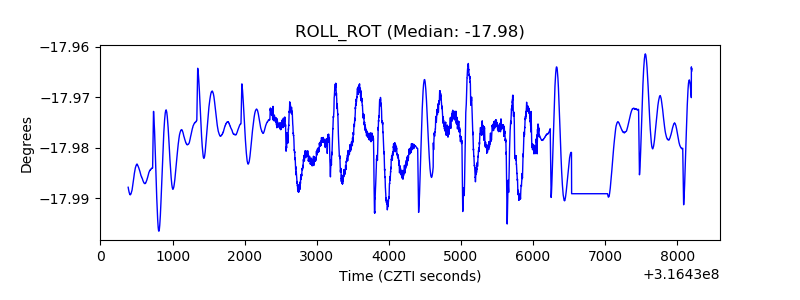 |
| _Roll_DEC | 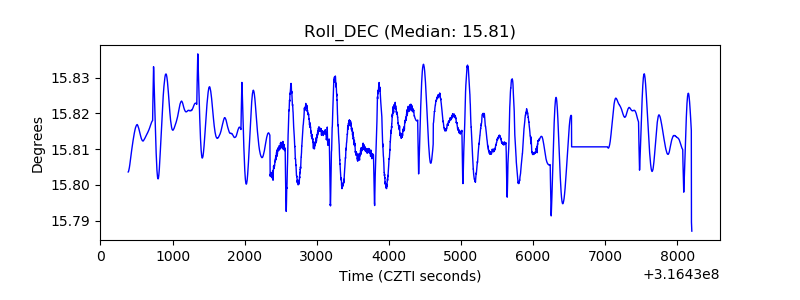 |
| _Roll_RA | 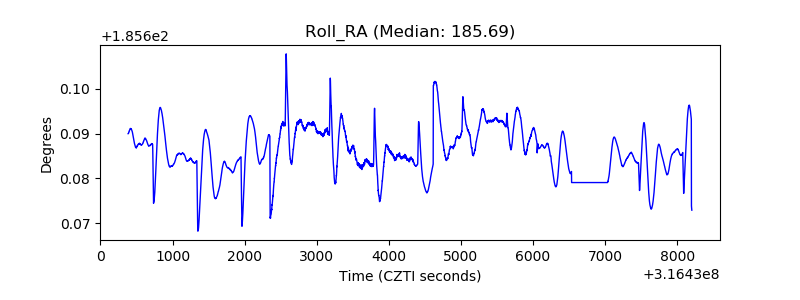 |
| Veto Counter | 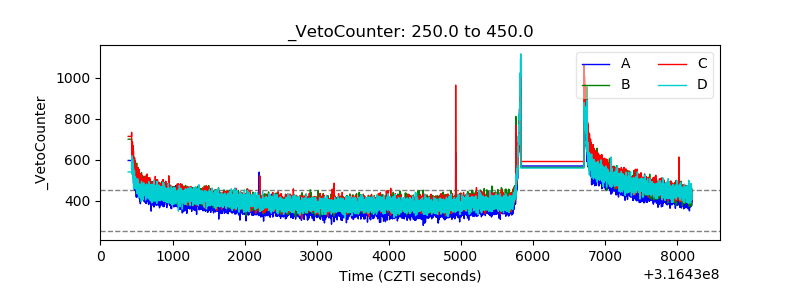 |