| Param | Original file | Final file |
|---|---|---|
| Filename | modeM0/AS1A08_003T05_9000003426_23185cztM0_level2.evt | modeM0/AS1A08_003T05_9000003426_23185cztM0_level2_quad_clean.evt |
| Size (bytes) | 534,234,240 | 61,945,920 |
| Size | 509.5 MB | 59.1 MB |
| Events in quadrant A | 3,222,520 | 362,212 |
| Events in quadrant B | 3,321,179 | 366,474 |
| Events in quadrant C | 3,498,638 | 348,743 |
| Events in quadrant D | 5,697,498 | 345,848 |
| Mode M9 | |||
|---|---|---|---|
| Quadrant | BADHDUFLAG | Total packets | Discarded packets |
| A | 0 | 11 | 0 |
| B | 0 | 11 | 0 |
| C | 0 | 11 | 0 |
| D | 0 | 11 | 0 |
| Mode M0 | |||
|---|---|---|---|
| Quadrant | BADHDUFLAG | Total packets | Discarded packets |
| A | 0 | 13595 | 1 |
| B | 0 | 13851 | 1 |
| C | 0 | 14378 | 1 |
| D | 0 | 21405 | 1 |
| Mode SS | |||
|---|---|---|---|
| Quadrant | BADHDUFLAG | Total packets | Discarded packets |
| A | 0 | 132 | 0 |
| B | 0 | 132 | 0 |
| C | 0 | 132 | 0 |
| D | 0 | 132 | 0 |
| Quadrant | Total seconds | Saturated seconds | Saturation percentage |
|---|---|---|---|
| A | 6479 | 33 | 0.509338% |
| B | 6479 | 37 | 0.571076% |
| C | 6480 | 126 | 1.944444% |
| D | 6480 | 610 | 9.413580% |
Noise dominated data is calculated using 1-second bins in cleaned event files. If a bin has >2000 counts, and if more than 50% of those come from <1% of pixels, then it is considered to be noise-dominated and hence unusable.
| Quadrant | # 1 sec bins | Bins with >0 counts | Bins with >2000 counts | High rate bins dominated by noise | Noise dominated (total time) | Noise dominated (detector-on time) | Marked lightcurve |
|---|---|---|---|---|---|---|---|
| A | 7564 | 6479 | 0 | 0 | 0.00% | 0.00% | 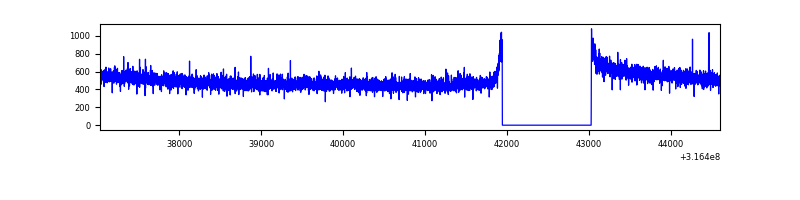 |
| B | 7564 | 6479 | 1 | 1 | 0.01% | 0.02% | 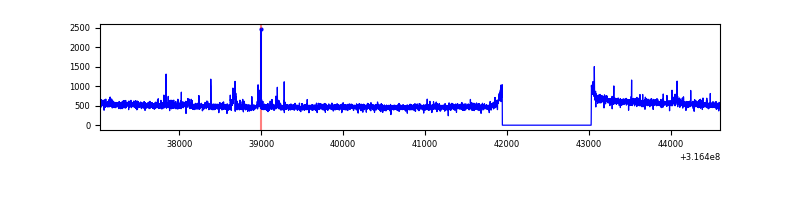 |
| C | 7565 | 6481 | 33 | 33 | 0.44% | 0.51% | 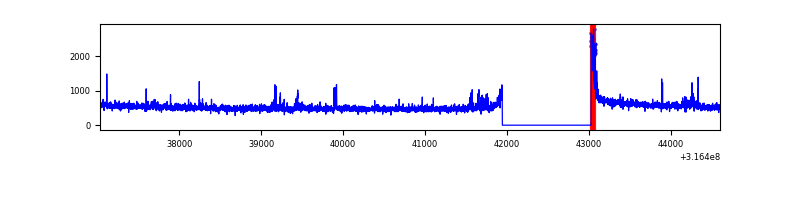 |
| D | 7565 | 6480 | 479 | 479 | 6.33% | 7.39% | 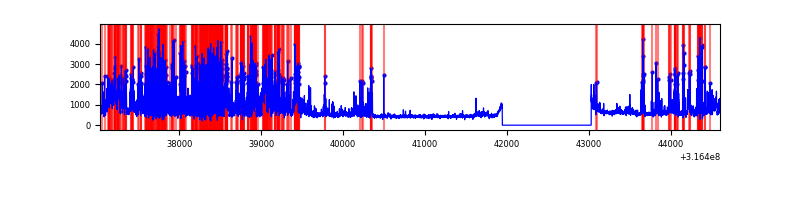 |
Top three noisy pixels from each quadrant. If the there are fewer than three noisy pixels in the level2.evt file, extra rows are filled as -1
| Pixel properties | Quadrant properties | ||||||
|---|---|---|---|---|---|---|---|
| Quadrant | DetID | PixID | Counts | Sigma | Mean | Median | Sigma |
| A | 13 | 254 | 9844 | 53.6 | 835 | 818 | 168.4 |
| A | 0 | 226 | 7292 | 38.45 | 835 | 818 | 168.4 |
| A | 3 | 137 | 7127 | 37.47 | 835 | 818 | 168.4 |
| B | 0 | 190 | 63807 | 403.55 | 825 | 803 | 156.1 |
| B | 12 | 111 | 18775 | 115.11 | 825 | 803 | 156.1 |
| B | 11 | 111 | 17082 | 104.27 | 825 | 803 | 156.1 |
| C | 0 | 10 | 151046 | 808.28 | 799 | 806 | 185.9 |
| C | 14 | 238 | 127343 | 680.76 | 799 | 806 | 185.9 |
| C | 7 | 247 | 69203 | 367.97 | 799 | 806 | 185.9 |
| D | 1 | 52 | 2045458 | 10641.91 | 792 | 770 | 192.1 |
| D | 12 | 233 | 471937 | 2452.26 | 792 | 770 | 192.1 |
| D | 13 | 153 | 90666 | 467.88 | 792 | 770 | 192.1 |
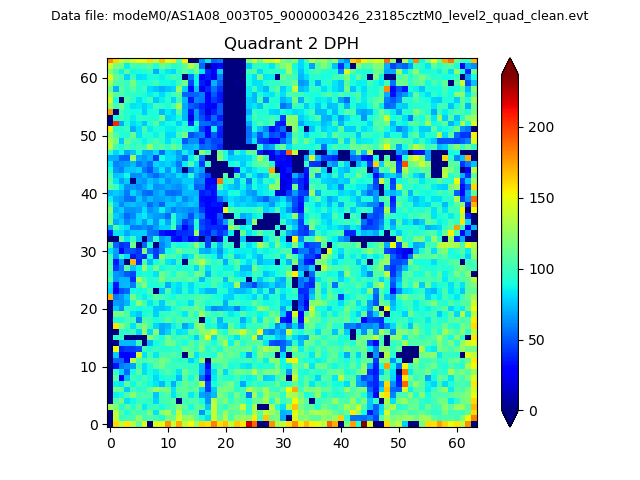
Histogram calculated using DETX and DETY for each event in the final _common_clean file
| Quadrant A | 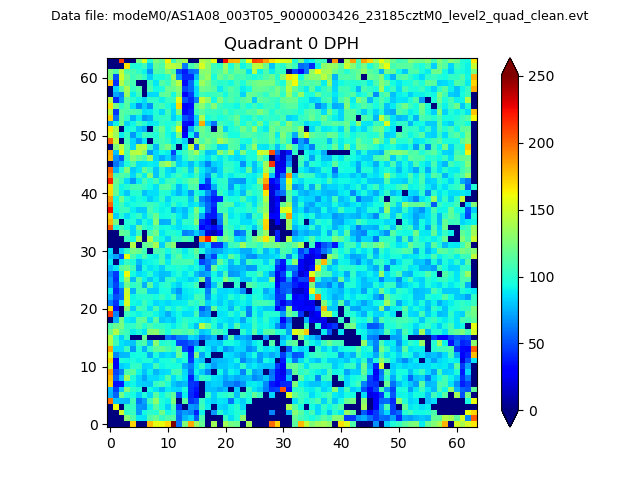 |
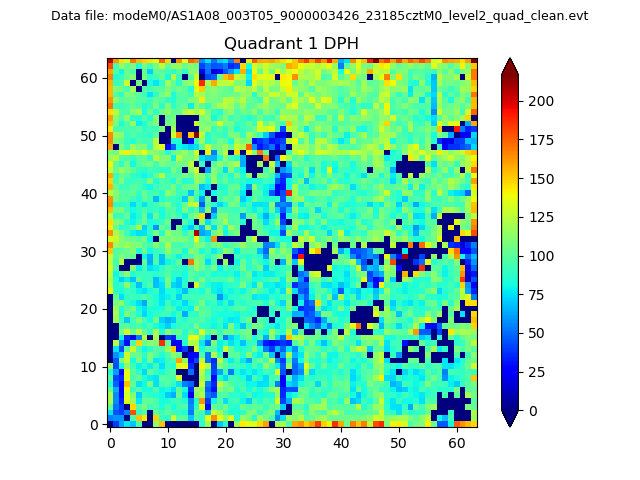 |
Quadrant B |
|---|---|---|---|
| Quadrant D | 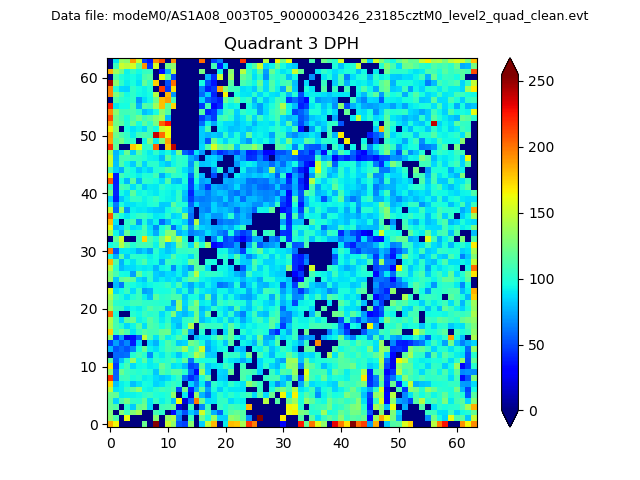 |
 |
Quadrant C |
| Plot type | Count rate plots | Images |
|---|---|---|
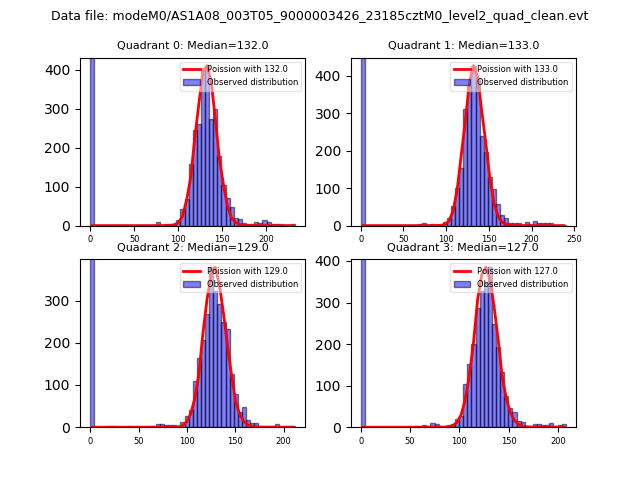
| Comparison with Poisson distribution Blue bars denote a histogram of data divided into 1 sec bins. Red curve is a Poisson curve with rate = median count rate of data. |
 |
 |
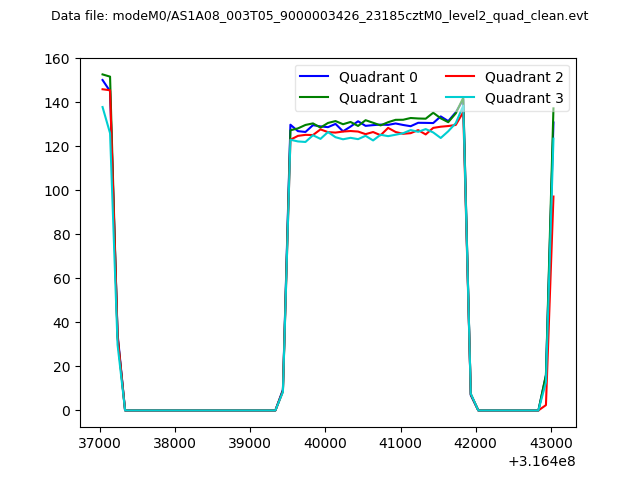
| Quadrant-wise count rates Data is divided into 100 sec bins |
 |
|
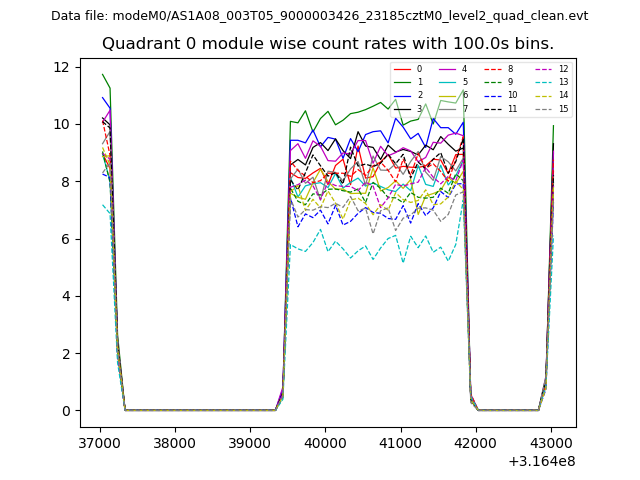
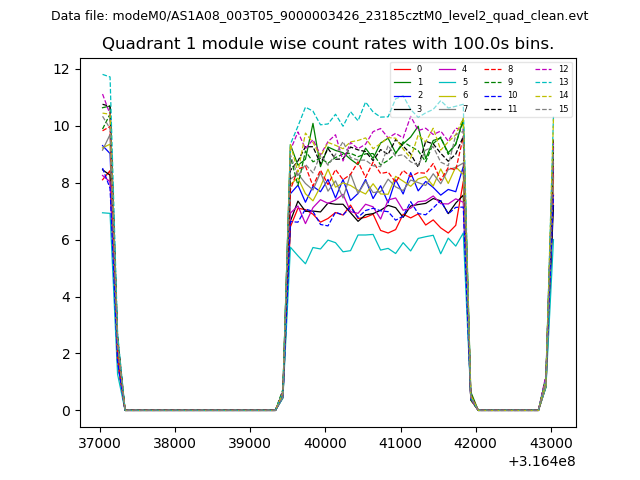
| Module-wise count rates for Quadrant A Data is divided into 100 sec bins |
 |
 |
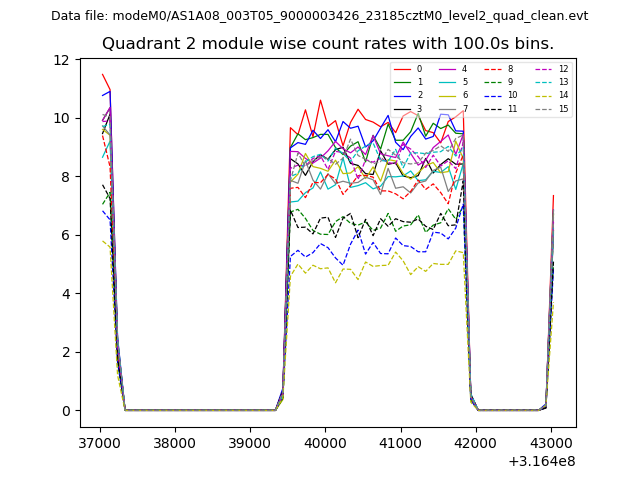
| Module-wise count rates for Quadrant B Data is divided into 100 sec bins |
 |
 |
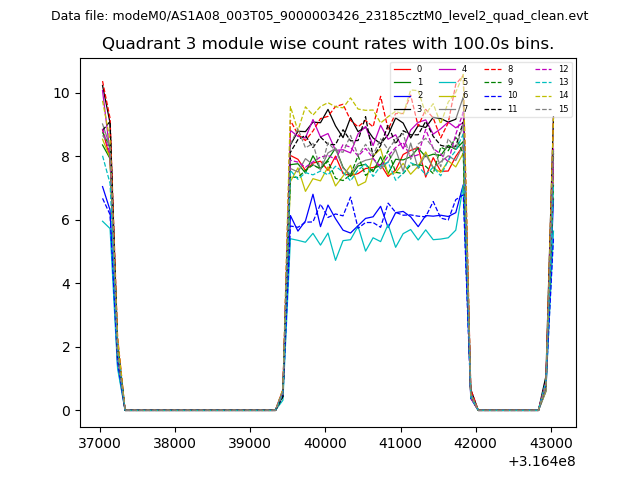
| Module-wise count rates for Quadrant C Data is divided into 100 sec bins |
 |
 |
| Module-wise count rates for Quadrant D Data is divided into 100 sec bins |
 |
 |
| Parameter | Plot |
|---|---|
| CZT HV Monitor | 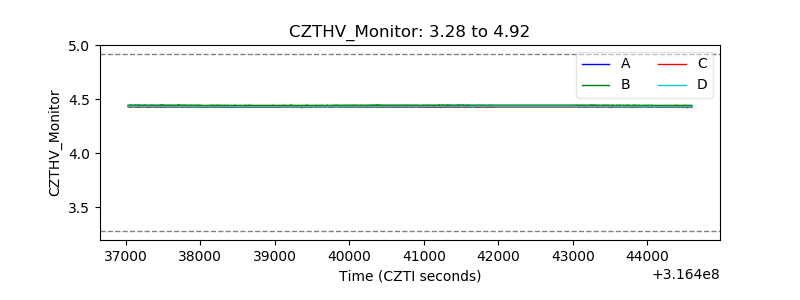 |
| D_VDD |  |
| Temperature 1 |  |
| Veto HV Monitor | 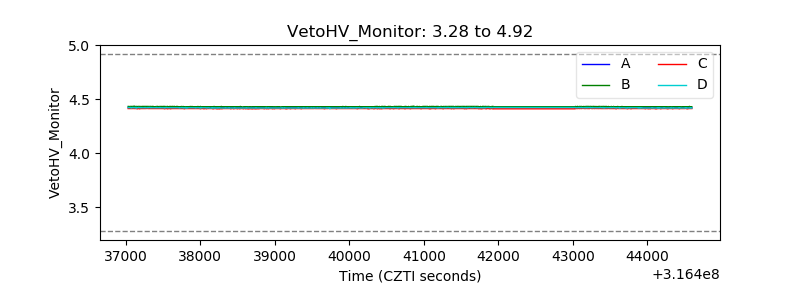 |
| Veto LLD | 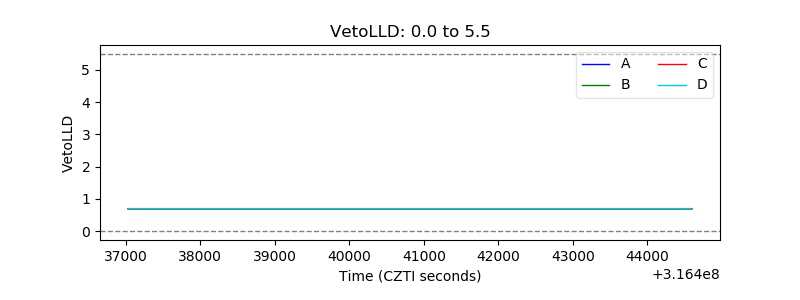 |
| Alpha Counter | 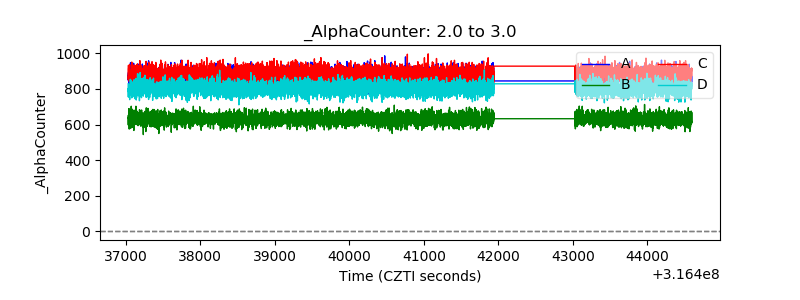 |
| _CPM_Rate | 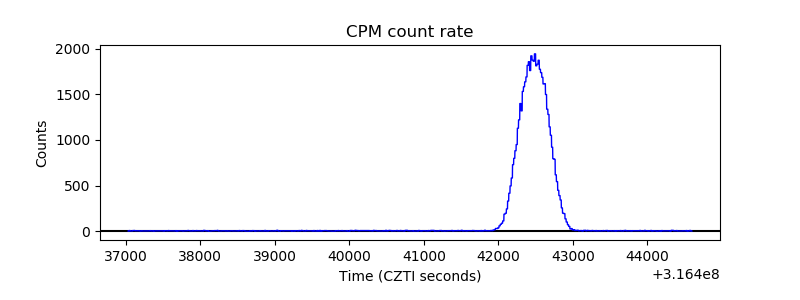 |
| CZT Counter | 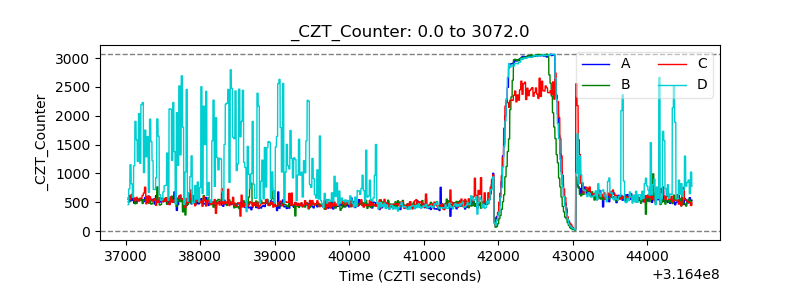 |
| +2.5 Volts monitor |  |
| +5 Volts monitor |  |
| _ROLL_ROT | 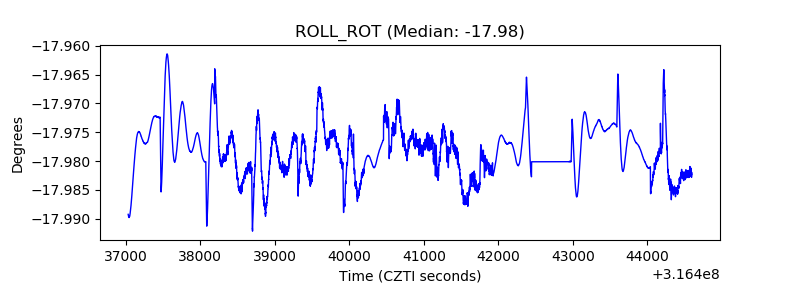 |
| _Roll_DEC | 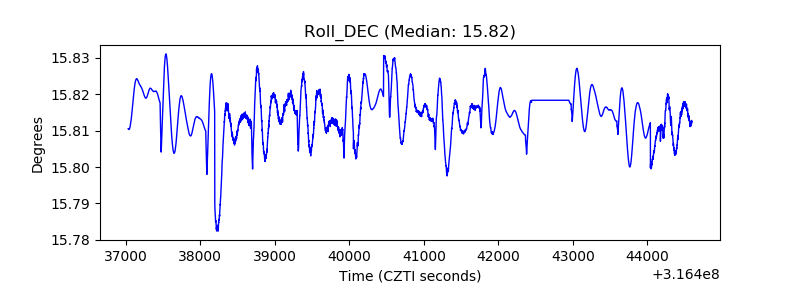 |
| _Roll_RA | 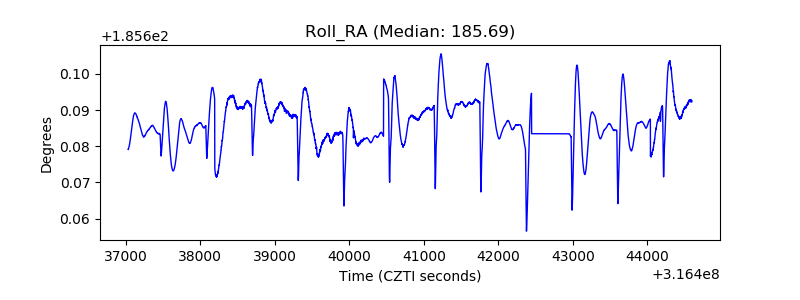 |
| Veto Counter | 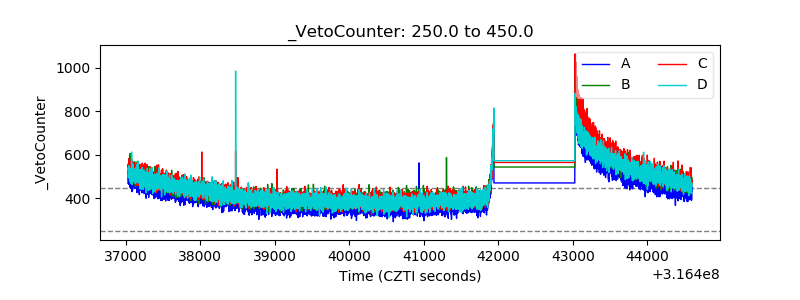 |