| Param | Original file | Final file |
|---|---|---|
| Filename | modeM0/AS1A08_003T05_9000003426_23186cztM0_level2.evt | modeM0/AS1A08_003T05_9000003426_23186cztM0_level2_quad_clean.evt |
| Size (bytes) | 593,628,480 | 64,837,440 |
| Size | 566.1 MB | 61.8 MB |
| Events in quadrant A | 3,519,339 | 383,591 |
| Events in quadrant B | 3,686,024 | 387,003 |
| Events in quadrant C | 4,133,178 | 369,684 |
| Events in quadrant D | 6,190,745 | 360,508 |
| Mode M9 | |||
|---|---|---|---|
| Quadrant | BADHDUFLAG | Total packets | Discarded packets |
| A | 0 | 11 | 0 |
| B | 0 | 12 | 0 |
| C | 0 | 12 | 0 |
| D | 0 | 12 | 0 |
| Mode M0 | |||
|---|---|---|---|
| Quadrant | BADHDUFLAG | Total packets | Discarded packets |
| A | 0 | 14712 | 2 |
| B | 0 | 15183 | 2 |
| C | 0 | 16560 | 2 |
| D | 0 | 22909 | 5 |
| Mode SS | |||
|---|---|---|---|
| Quadrant | BADHDUFLAG | Total packets | Discarded packets |
| A | 0 | 136 | 0 |
| B | 0 | 136 | 0 |
| C | 0 | 136 | 0 |
| D | 0 | 136 | 0 |
| Quadrant | Total seconds | Saturated seconds | Saturation percentage |
|---|---|---|---|
| A | 6625 | 78 | 1.177358% |
| B | 6625 | 87 | 1.313208% |
| C | 6625 | 260 | 3.924528% |
| D | 6624 | 719 | 10.854469% |
Noise dominated data is calculated using 1-second bins in cleaned event files. If a bin has >2000 counts, and if more than 50% of those come from <1% of pixels, then it is considered to be noise-dominated and hence unusable.
| Quadrant | # 1 sec bins | Bins with >0 counts | Bins with >2000 counts | High rate bins dominated by noise | Noise dominated (total time) | Noise dominated (detector-on time) | Marked lightcurve |
|---|---|---|---|---|---|---|---|
| A | 7795 | 6625 | 0 | 0 | 0.00% | 0.00% | 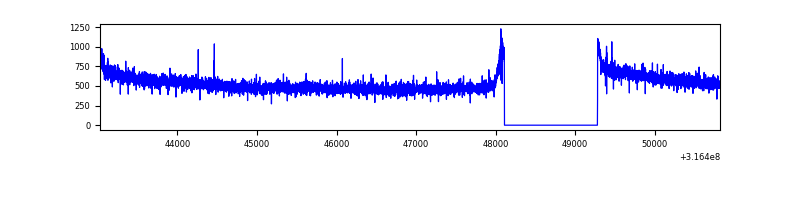 |
| B | 7795 | 6625 | 0 | 0 | 0.00% | 0.00% | 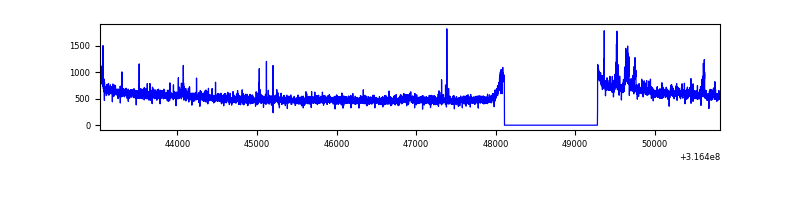 |
| C | 7795 | 6625 | 88 | 88 | 1.13% | 1.33% | 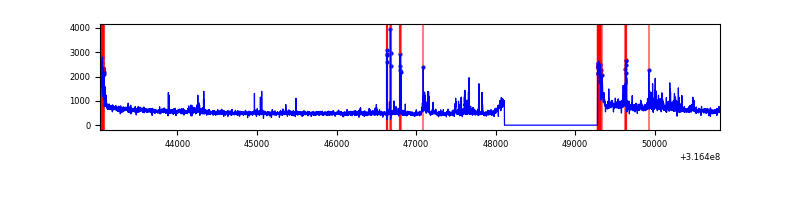 |
| D | 7793 | 6623 | 483 | 483 | 6.20% | 7.29% | 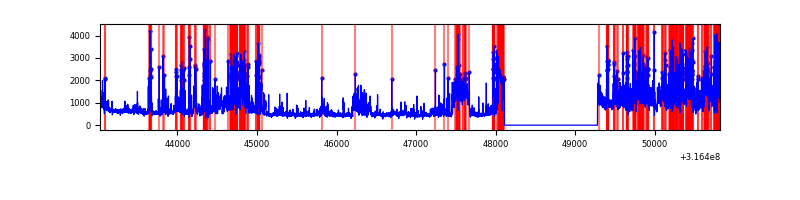 |
Top three noisy pixels from each quadrant. If the there are fewer than three noisy pixels in the level2.evt file, extra rows are filled as -1
| Pixel properties | Quadrant properties | ||||||
|---|---|---|---|---|---|---|---|
| Quadrant | DetID | PixID | Counts | Sigma | Mean | Median | Sigma |
| A | 6 | 16 | 24244 | 129.52 | 907 | 889 | 180.3 |
| A | 13 | 254 | 9892 | 49.93 | 907 | 889 | 180.3 |
| A | 0 | 226 | 7892 | 38.84 | 907 | 889 | 180.3 |
| B | 0 | 190 | 89639 | 522.3 | 900 | 878 | 169.9 |
| B | 0 | 229 | 55219 | 319.76 | 900 | 878 | 169.9 |
| B | 12 | 111 | 19540 | 109.81 | 900 | 878 | 169.9 |
| C | 0 | 10 | 291856 | 1451.51 | 866 | 874 | 200.5 |
| C | 7 | 247 | 146023 | 724.05 | 866 | 874 | 200.5 |
| C | 14 | 238 | 138066 | 684.35 | 866 | 874 | 200.5 |
| D | 1 | 52 | 1427968 | 6823.83 | 855 | 832 | 209.1 |
| D | 7 | 238 | 732263 | 3497.32 | 855 | 832 | 209.1 |
| D | 12 | 233 | 607126 | 2898.98 | 855 | 832 | 209.1 |
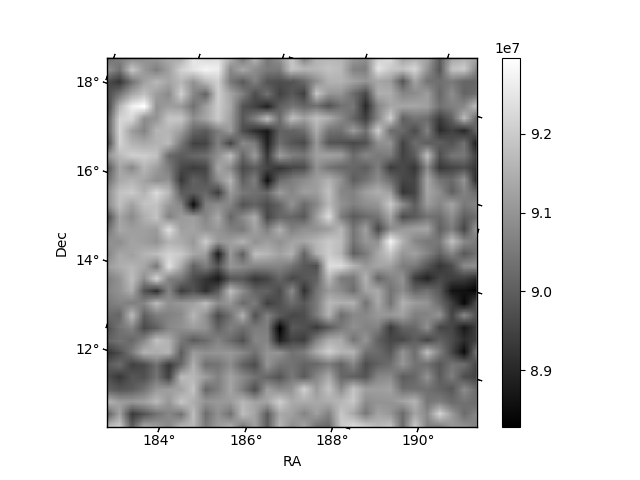
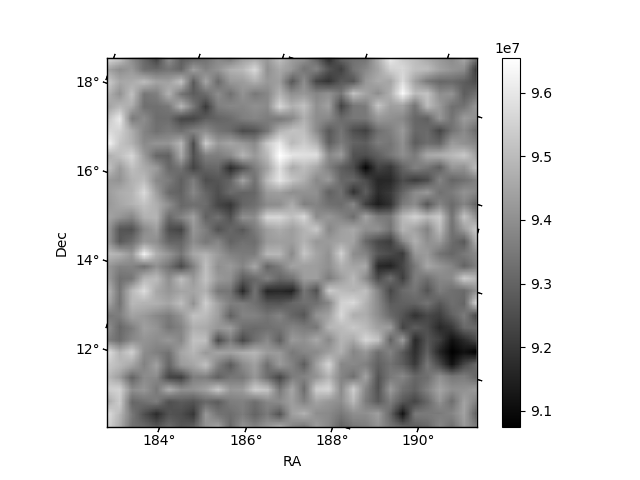
Histogram calculated using DETX and DETY for each event in the final _common_clean file
| Quadrant A |  |
 |
Quadrant B |
|---|---|---|---|
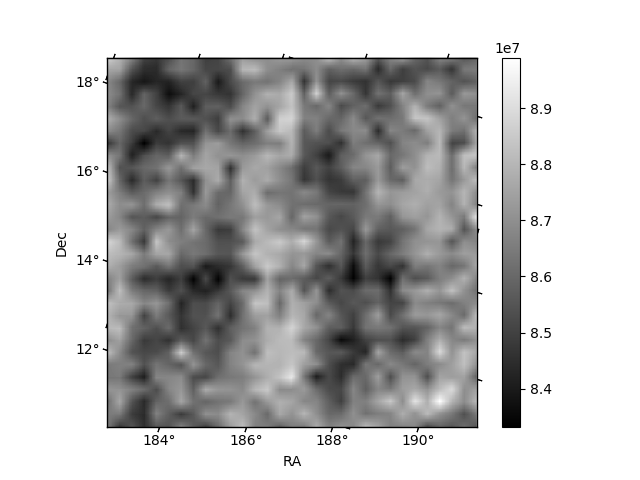
| Quadrant D | 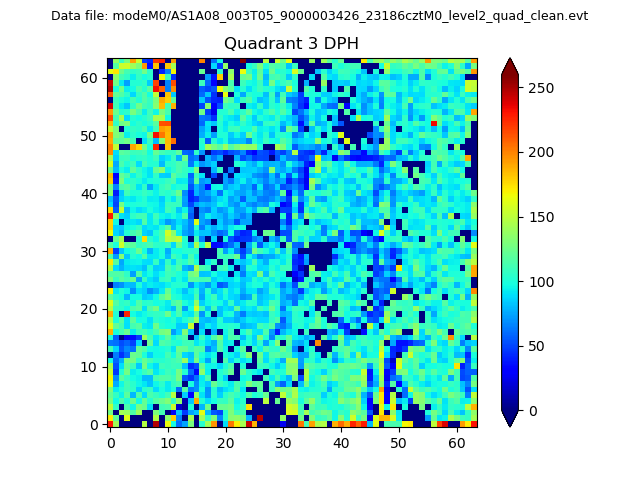 |
 |
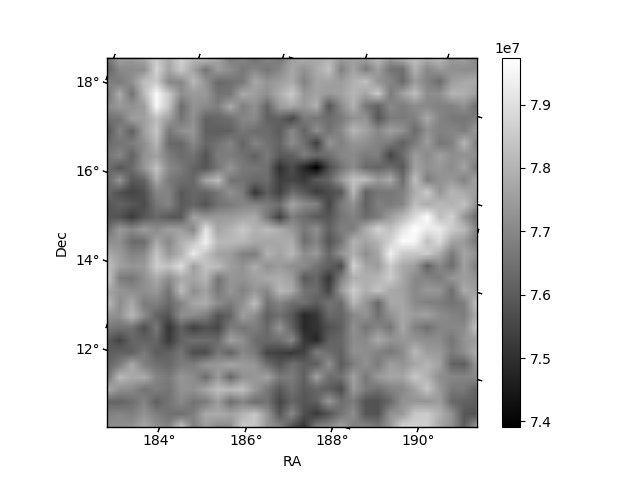
Quadrant C |
| Plot type | Count rate plots | Images |
|---|---|---|
| Comparison with Poisson distribution Blue bars denote a histogram of data divided into 1 sec bins. Red curve is a Poisson curve with rate = median count rate of data. |
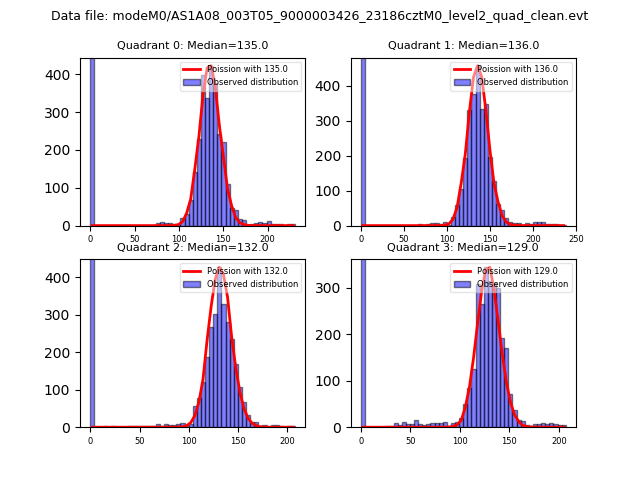 |
 |
| Quadrant-wise count rates Data is divided into 100 sec bins |
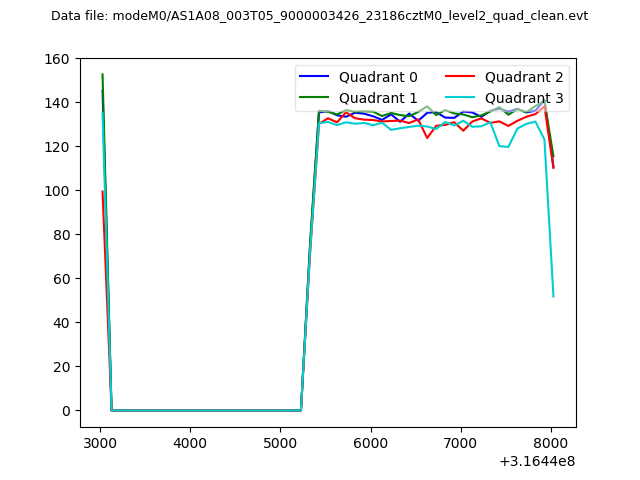 |
|
| Module-wise count rates for Quadrant A Data is divided into 100 sec bins |
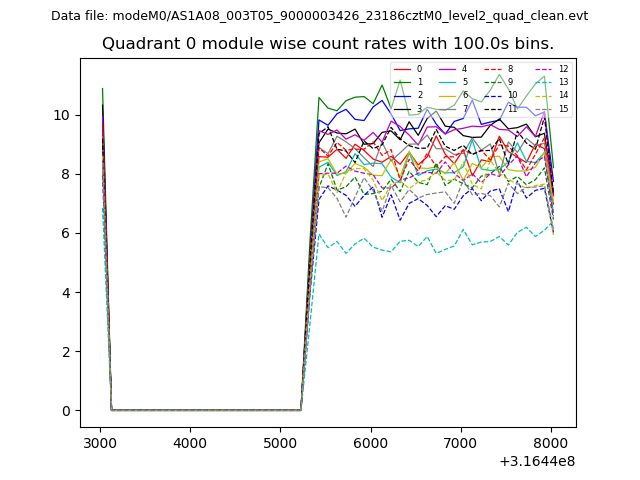 |
 |
| Module-wise count rates for Quadrant B Data is divided into 100 sec bins |
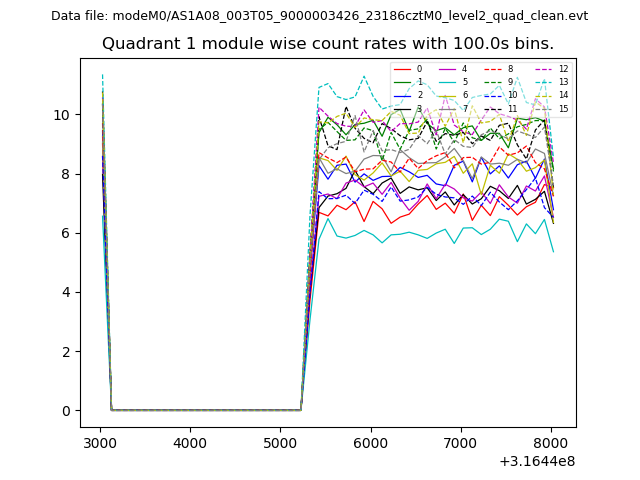 |
 |
| Module-wise count rates for Quadrant C Data is divided into 100 sec bins |
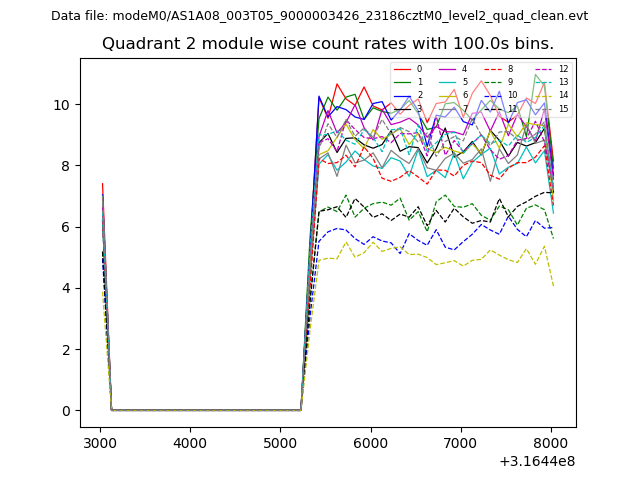 |
 |
| Module-wise count rates for Quadrant D Data is divided into 100 sec bins |
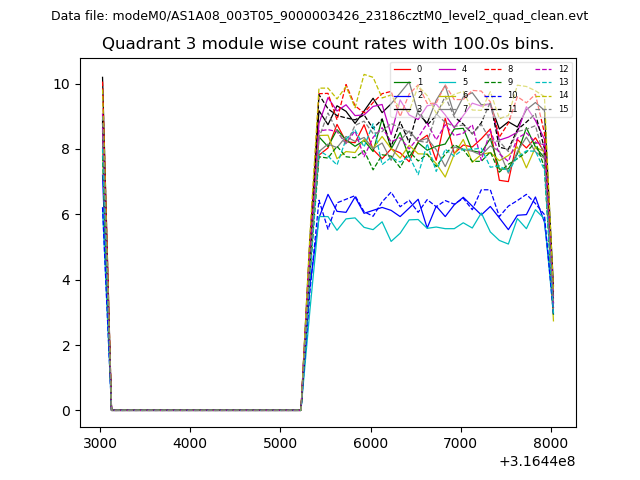 |
 |
| Parameter | Plot |
|---|---|
| CZT HV Monitor | 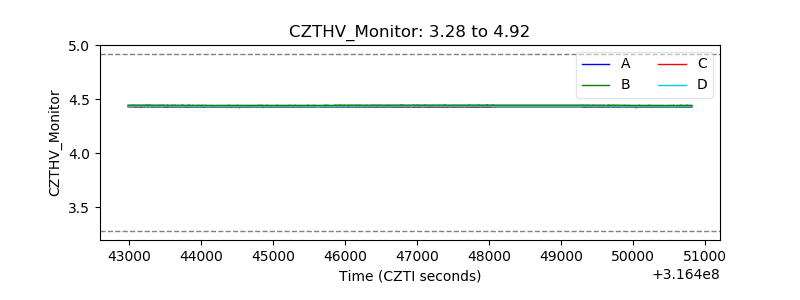 |
| D_VDD | 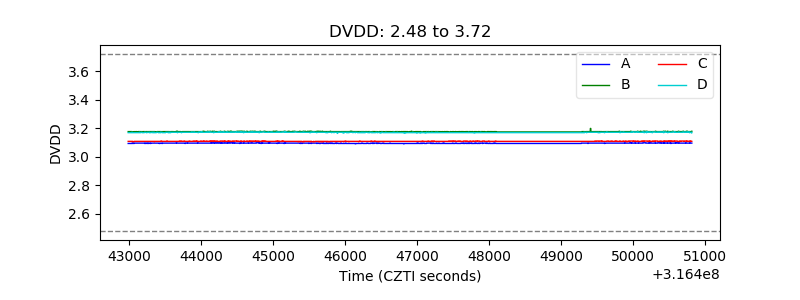 |
| Temperature 1 | 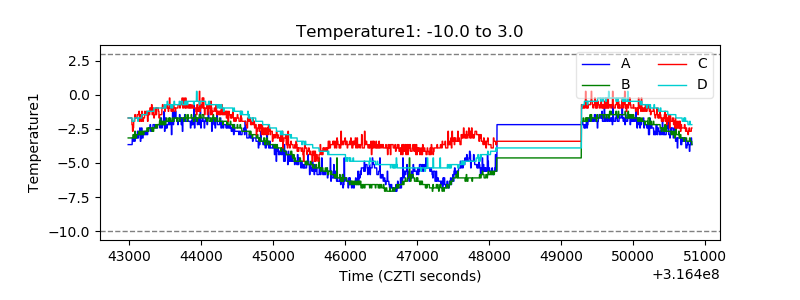 |
| Veto HV Monitor | 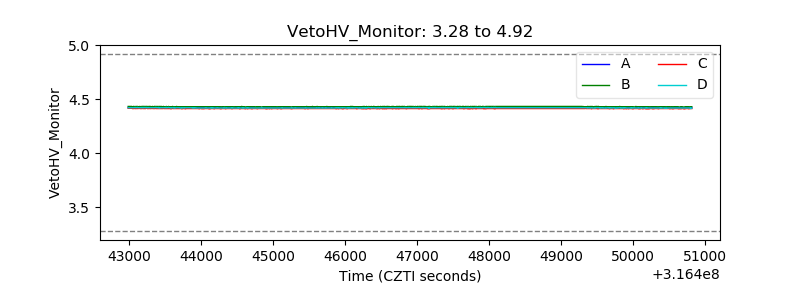 |
| Veto LLD | 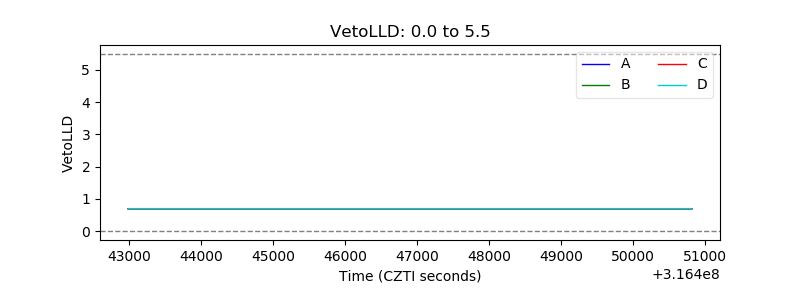 |
| Alpha Counter | 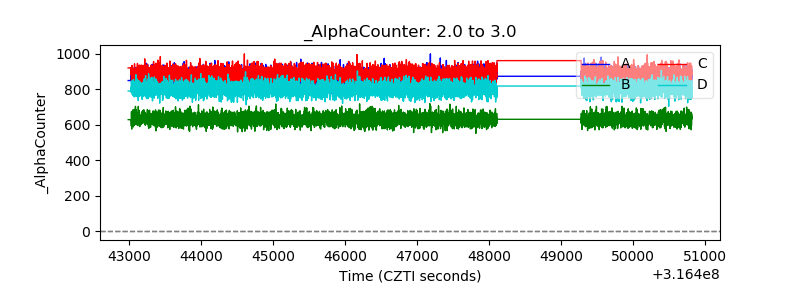 |
| _CPM_Rate | 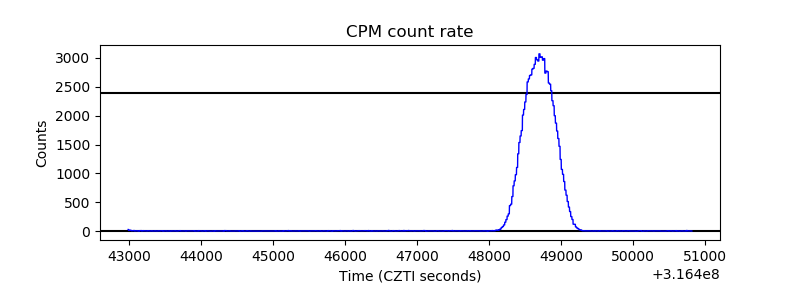 |
| CZT Counter | 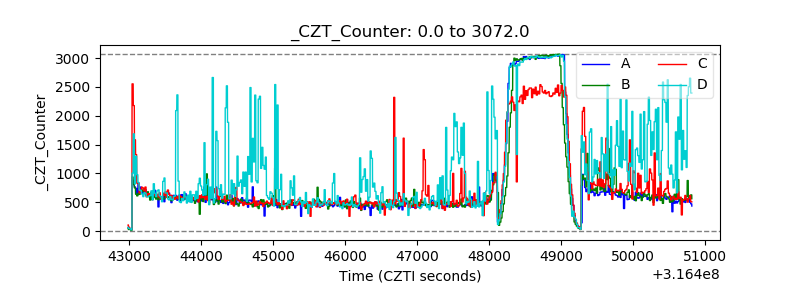 |
| +2.5 Volts monitor |  |
| +5 Volts monitor |  |
| _ROLL_ROT | 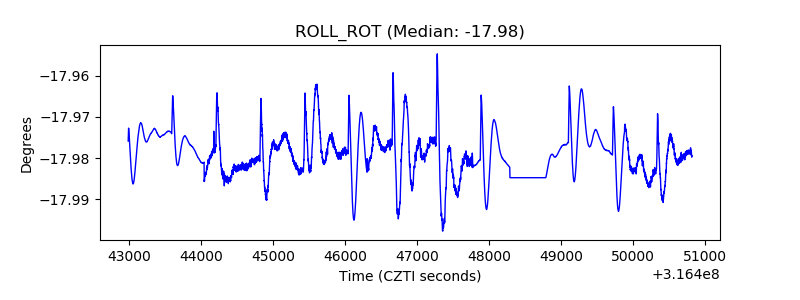 |
| _Roll_DEC | 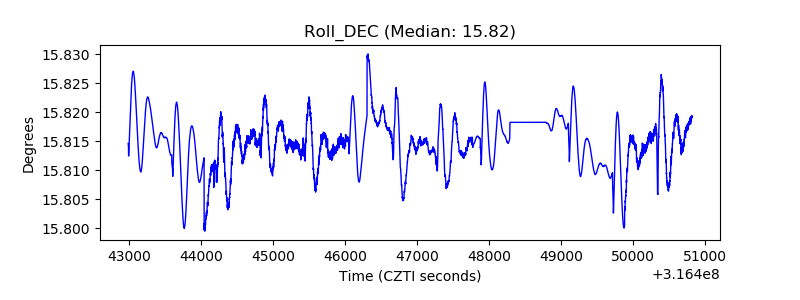 |
| _Roll_RA | 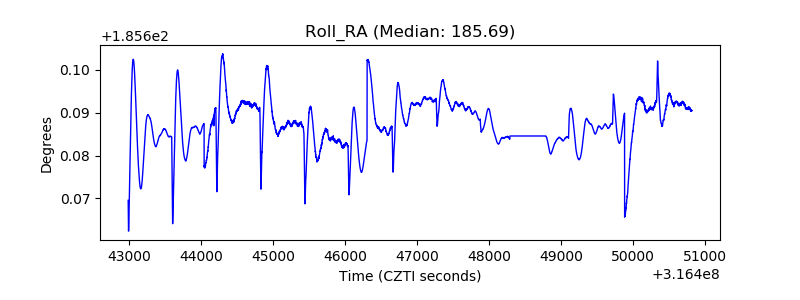 |
| Veto Counter | 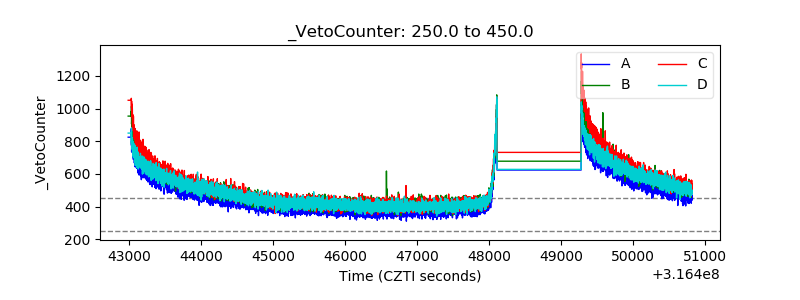 |