| Param | Original file | Final file |
|---|---|---|
| Filename | modeM0/AS1A08_003T05_9000003426_23187cztM0_level2.evt | modeM0/AS1A08_003T05_9000003426_23187cztM0_level2_quad_clean.evt |
| Size (bytes) | 351,270,720 | 25,626,240 |
| Size | 335.0 MB | 24.4 MB |
| Events in quadrant A | 1,643,797 | 151,303 |
| Events in quadrant B | 1,769,139 | 153,429 |
| Events in quadrant C | 2,096,246 | 149,173 |
| Events in quadrant D | 4,924,828 | 107,479 |
| Mode M9 | |||
|---|---|---|---|
| Quadrant | BADHDUFLAG | Total packets | Discarded packets |
| A | 0 | 3 | 0 |
| B | 0 | 4 | 0 |
| C | 0 | 4 | 0 |
| D | 0 | 4 | 0 |
| Mode M0 | |||
|---|---|---|---|
| Quadrant | BADHDUFLAG | Total packets | Discarded packets |
| A | 0 | 6804 | 1 |
| B | 0 | 7187 | 1 |
| C | 0 | 8219 | 1 |
| D | 0 | 16700 | 1 |
| Mode SS | |||
|---|---|---|---|
| Quadrant | BADHDUFLAG | Total packets | Discarded packets |
| A | 0 | 60 | 0 |
| B | 0 | 60 | 0 |
| C | 0 | 60 | 0 |
| D | 0 | 60 | 0 |
| Quadrant | Total seconds | Saturated seconds | Saturation percentage |
|---|---|---|---|
| A | 2996 | 18 | 0.600801% |
| B | 2996 | 32 | 1.068091% |
| C | 2996 | 123 | 4.105474% |
| D | 2996 | 1078 | 35.981308% |
Noise dominated data is calculated using 1-second bins in cleaned event files. If a bin has >2000 counts, and if more than 50% of those come from <1% of pixels, then it is considered to be noise-dominated and hence unusable.
| Quadrant | # 1 sec bins | Bins with >0 counts | Bins with >2000 counts | High rate bins dominated by noise | Noise dominated (total time) | Noise dominated (detector-on time) | Marked lightcurve |
|---|---|---|---|---|---|---|---|
| A | 2996 | 2996 | 0 | 0 | 0.00% | 0.00% | 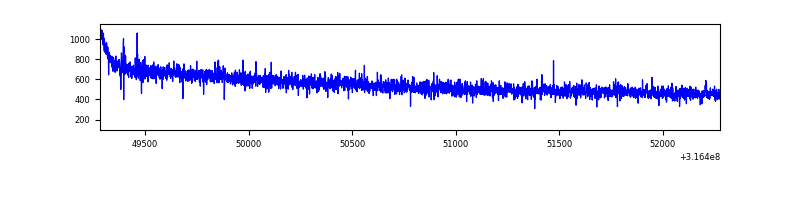 |
| B | 2996 | 2996 | 0 | 0 | 0.00% | 0.00% | 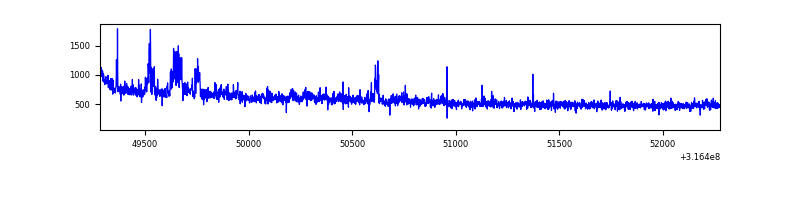 |
| C | 2996 | 2996 | 50 | 50 | 1.67% | 1.67% | 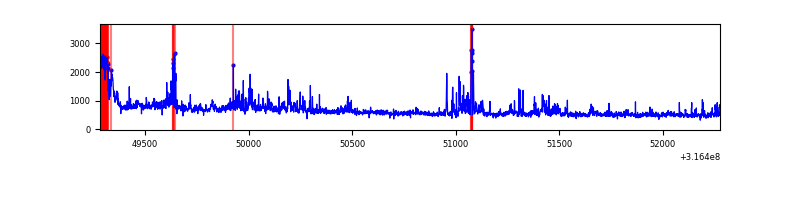 |
| D | 2996 | 2996 | 883 | 883 | 29.47% | 29.47% | 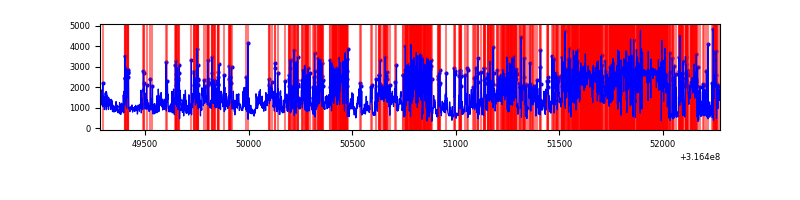 |
Top three noisy pixels from each quadrant. If the there are fewer than three noisy pixels in the level2.evt file, extra rows are filled as -1
| Pixel properties | Quadrant properties | ||||||
|---|---|---|---|---|---|---|---|
| Quadrant | DetID | PixID | Counts | Sigma | Mean | Median | Sigma |
| A | 6 | 16 | 6423 | 70.35 | 424 | 417 | 85.4 |
| A | 13 | 254 | 4561 | 48.54 | 424 | 417 | 85.4 |
| A | 0 | 226 | 3791 | 39.52 | 424 | 417 | 85.4 |
| B | 0 | 190 | 70659 | 890.42 | 422 | 414 | 78.9 |
| B | 0 | 229 | 41032 | 514.87 | 422 | 414 | 78.9 |
| B | 12 | 111 | 8982 | 108.61 | 422 | 414 | 78.9 |
| C | 0 | 10 | 232938 | 2482.48 | 406 | 410 | 93.7 |
| C | 3 | 233 | 85090 | 904.05 | 406 | 410 | 93.7 |
| C | 7 | 247 | 83403 | 886.04 | 406 | 410 | 93.7 |
| D | 7 | 238 | 1677170 | 18662.29 | 369 | 359 | 89.9 |
| D | 1 | 52 | 1440231 | 16025.25 | 369 | 359 | 89.9 |
| D | 12 | 233 | 304833 | 3388.68 | 369 | 359 | 89.9 |
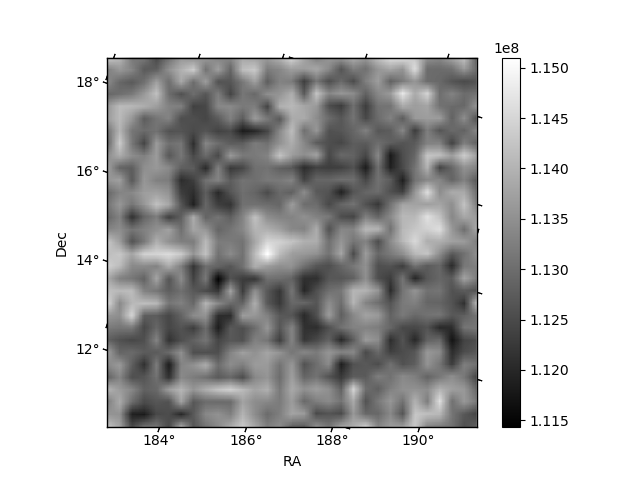
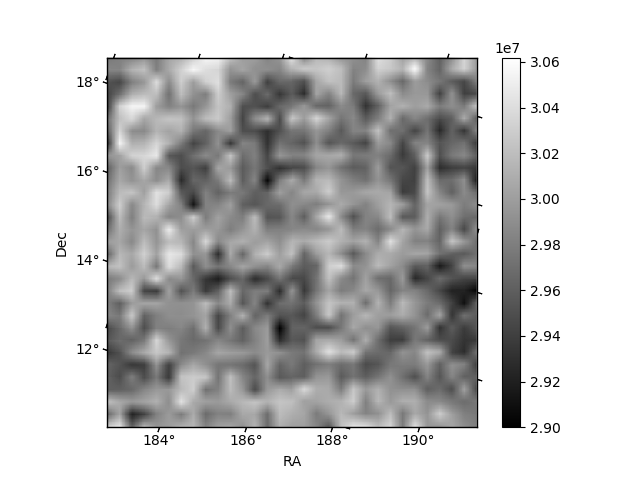
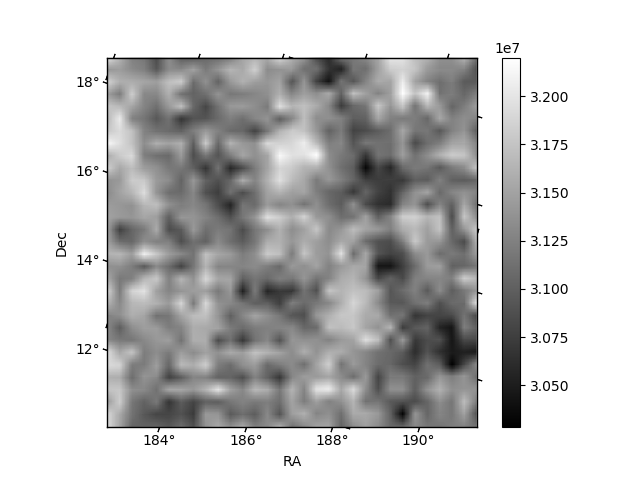
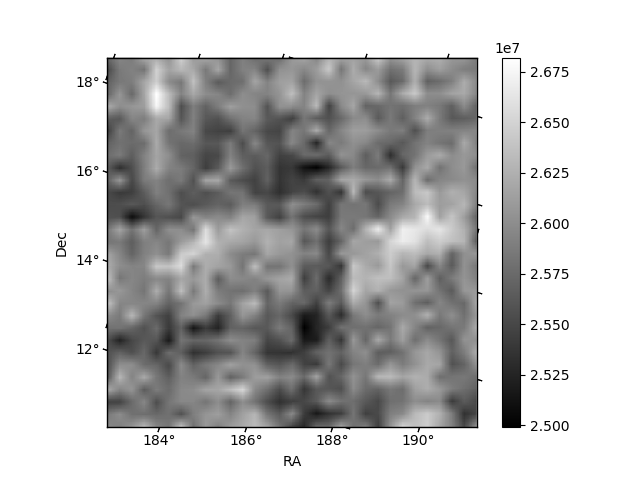
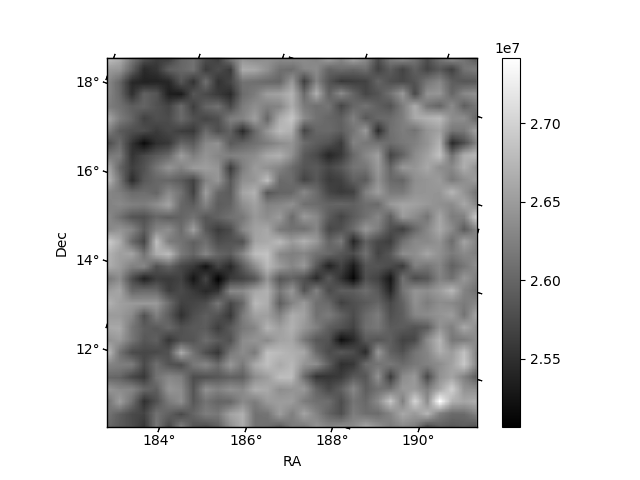
Histogram calculated using DETX and DETY for each event in the final _common_clean file
| Quadrant A | 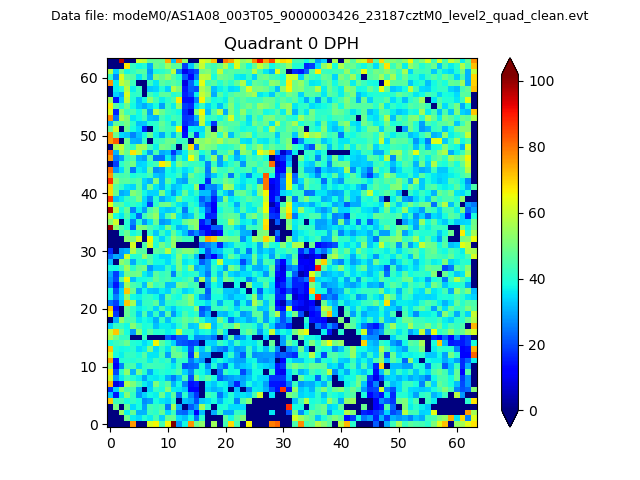 |
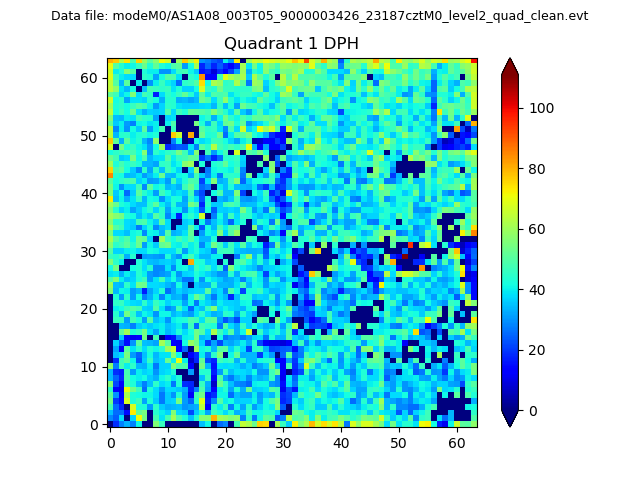 |
Quadrant B |
|---|---|---|---|
| Quadrant D | 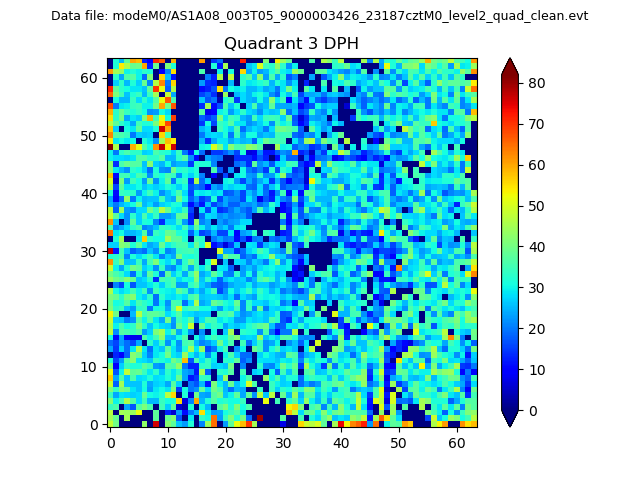 |
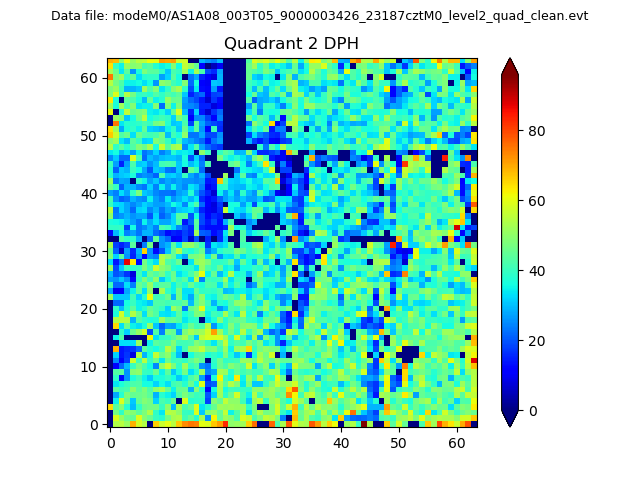 |
Quadrant C |
| Plot type | Count rate plots | Images |
|---|---|---|
| Comparison with Poisson distribution Blue bars denote a histogram of data divided into 1 sec bins. Red curve is a Poisson curve with rate = median count rate of data. |
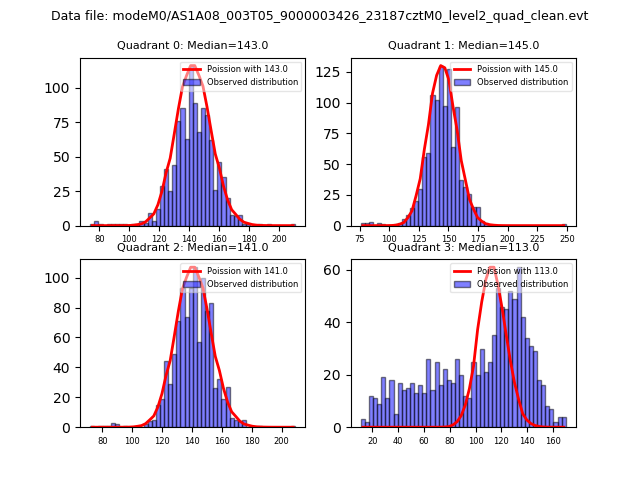 |
 |
| Quadrant-wise count rates Data is divided into 100 sec bins |
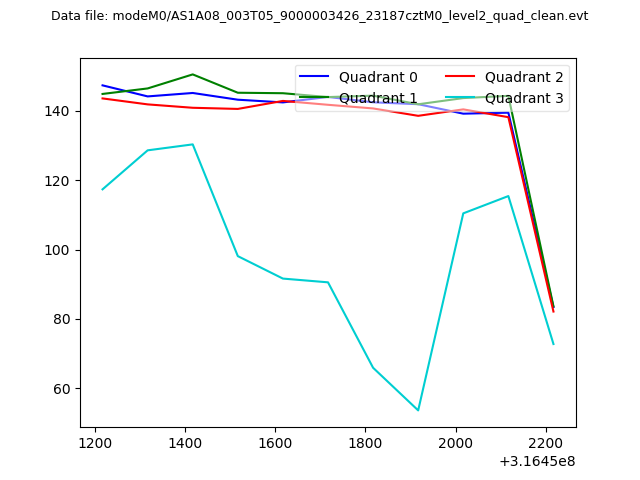 |
|
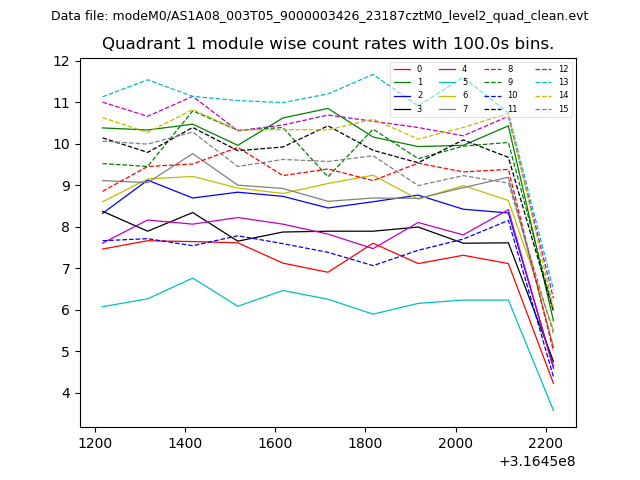
| Module-wise count rates for Quadrant A Data is divided into 100 sec bins |
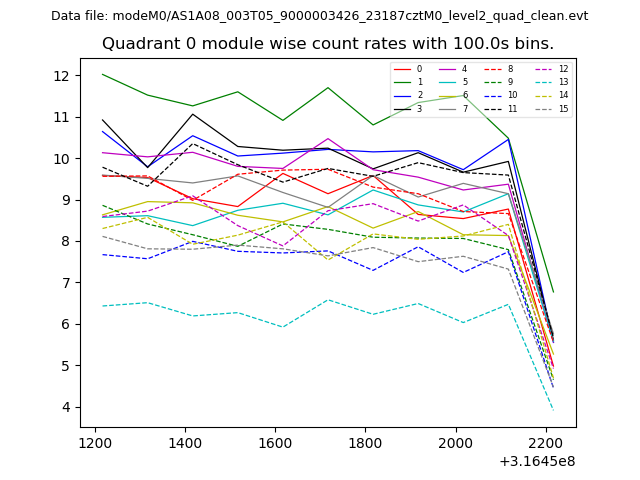 |
 |
| Module-wise count rates for Quadrant B Data is divided into 100 sec bins |
 |
 |
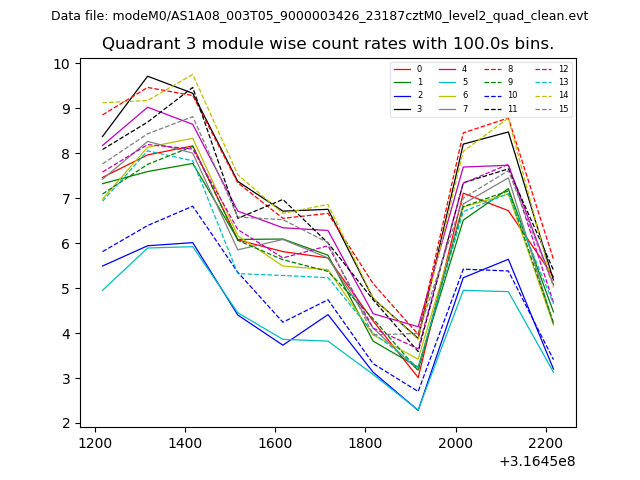
| Module-wise count rates for Quadrant C Data is divided into 100 sec bins |
 |
 |
| Module-wise count rates for Quadrant D Data is divided into 100 sec bins |
 |
 |
| Parameter | Plot |
|---|---|
| CZT HV Monitor | 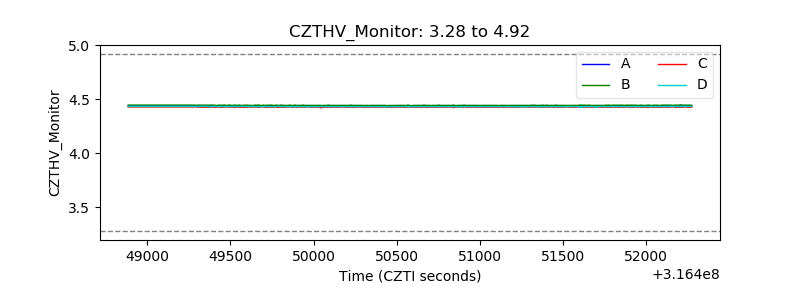 |
| D_VDD | 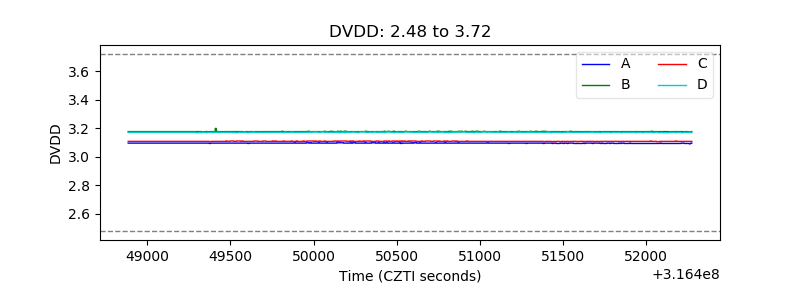 |
| Temperature 1 | 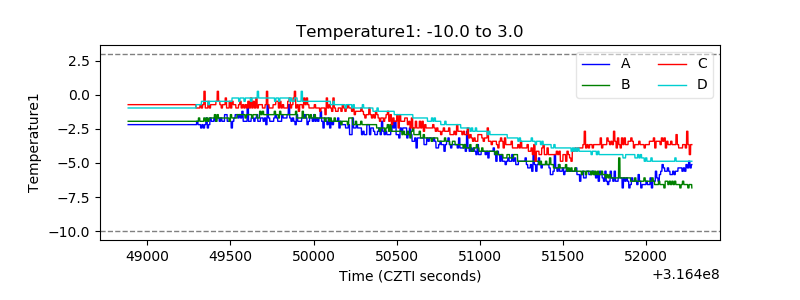 |
| Veto HV Monitor | 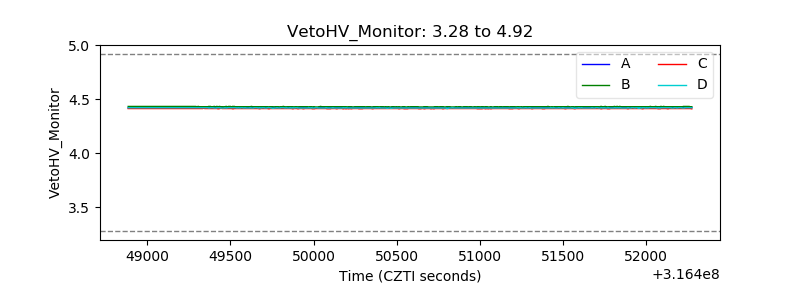 |
| Veto LLD |  |
| Alpha Counter | 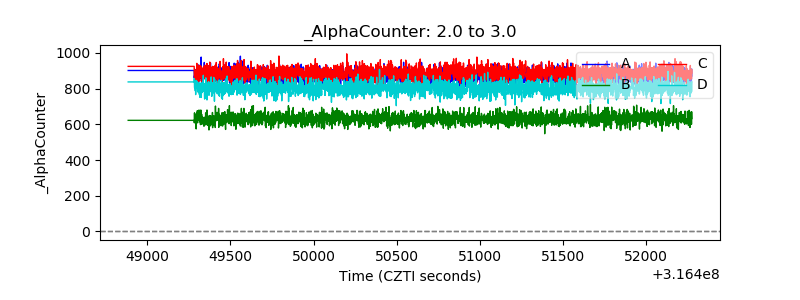 |
| _CPM_Rate | 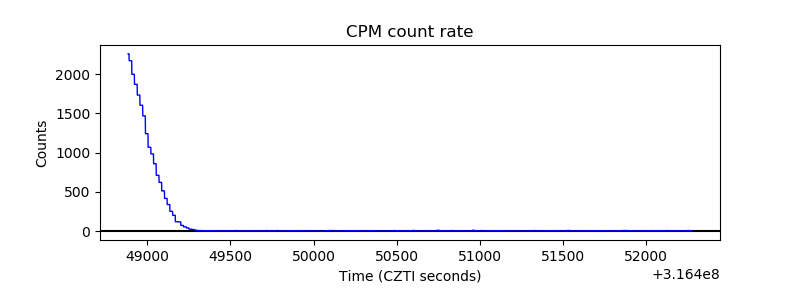 |
| CZT Counter | 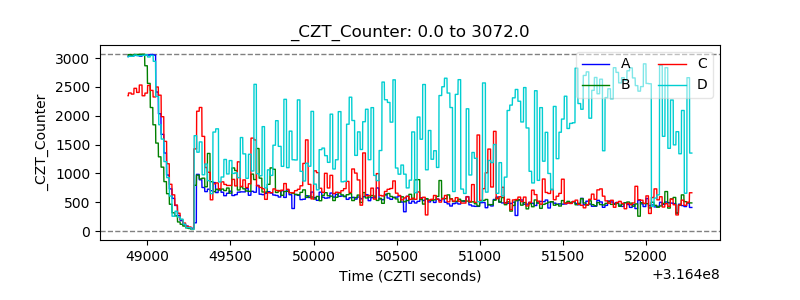 |
| +2.5 Volts monitor |  |
| +5 Volts monitor | 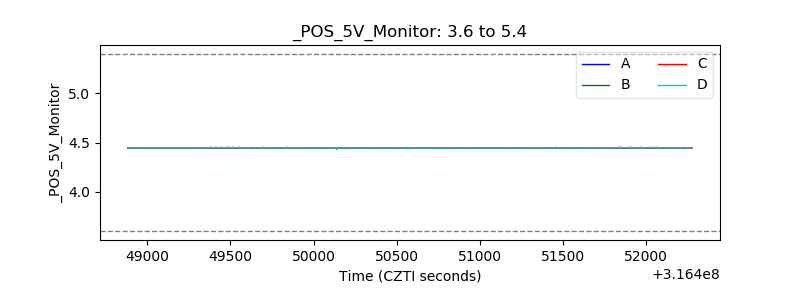 |
| _ROLL_ROT | 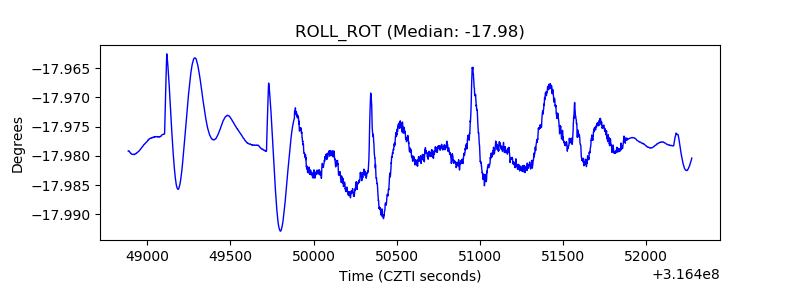 |
| _Roll_DEC | 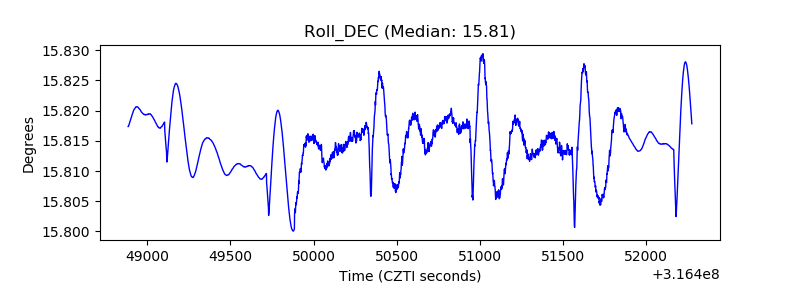 |
| _Roll_RA | 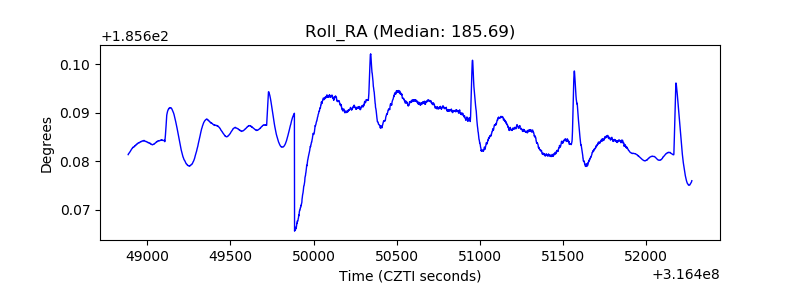 |
| Veto Counter | 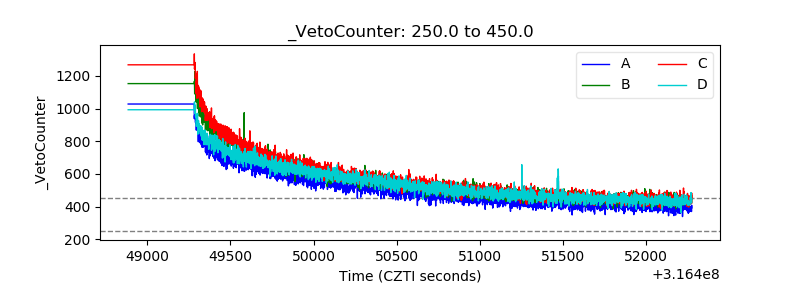 |