| Param | Original file | Final file |
|---|---|---|
| Filename | modeM0/AS1T03_175T01_9000003428cztM0_level2.fits | modeM0/AS1T03_175T01_9000003428cztM0_level2_quad_clean.evt |
| Size (bytes) | 892,517,760 | 761,546,880 |
| Size | 851.2 MB | 726.3 MB |
| Events in quadrant A | 5,602,116 | 4,459,637 |
| Events in quadrant B | 5,384,050 | 4,497,508 |
| Events in quadrant C | 5,497,310 | 4,330,239 |
| Events in quadrant D | 4,515,810 | 3,748,945 |
| Mode SS | |||
|---|---|---|---|
| Quadrant | BADHDUFLAG | Total packets | Discarded packets |
| A | 0 | 1788 | 0 |
| B | 0 | 1788 | 0 |
| C | 0 | 1788 | 0 |
| D | 0 | 1788 | 0 |
| Mode M9 | |||
|---|---|---|---|
| Quadrant | BADHDUFLAG | Total packets | Discarded packets |
| A | 0 | 165 | 0 |
| B | 0 | 165 | 0 |
| C | 0 | 165 | 0 |
| D | 0 | 165 | 0 |
| Mode M0 | |||
|---|---|---|---|
| Quadrant | BADHDUFLAG | Total packets | Discarded packets |
| A | 0 | 185968 | 0 |
| B | 0 | 187666 | 0 |
| C | 0 | 200544 | 0 |
| D | 0 | 281737 | 0 |
| Quadrant | Total seconds | Saturated seconds | Saturation percentage |
|---|---|---|---|
| A | 87915 | 1040 | 1.182961% |
| B | 87915 | 1344 | 1.528749% |
| C | 87915 | 2857 | 3.249730% |
| D | 87915 | 11761 | 13.377694% |
Noise dominated data is calculated using 1-second bins in cleaned event files. If a bin has >2000 counts, and if more than 50% of those come from <1% of pixels, then it is considered to be noise-dominated and hence unusable.
| Quadrant | # 1 sec bins | Bins with >0 counts | Bins with >2000 counts | High rate bins dominated by noise | Noise dominated (total time) | Noise dominated (detector-on time) | Marked lightcurve |
|---|---|---|---|---|---|---|---|
| A | 104250 | 87909 | 0 | 0 | 0.00% | 0.00% |  |
| B | 104250 | 87908 | 0 | 0 | 0.00% | 0.00% |  |
| C | 104250 | 87906 | 0 | 0 | 0.00% | 0.00% | 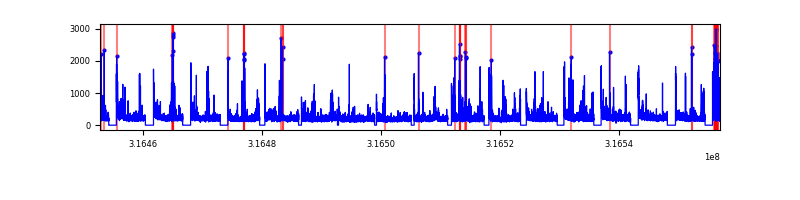 |
| D | 104250 | 87721 | 0 | 0 | 0.00% | 0.00% |  |
Top three noisy pixels from each quadrant. If the there are fewer than three noisy pixels in the level2.evt file, extra rows are filled as -1
| Pixel properties | Quadrant properties | ||||||
|---|---|---|---|---|---|---|---|
| Quadrant | DetID | PixID | Counts | Sigma | Mean | Median | Sigma |
| A | 0 | 29 | 5249 | 10.81 | 1460 | 1370 | 358.9 |
| A | 7 | 110 | 4363 | 8.34 | 1460 | 1370 | 358.9 |
| A | 0 | 30 | 4106 | 7.62 | 1460 | 1370 | 358.9 |
| B | 2 | 9 | 4285 | 10.76 | 1421 | 1360 | 271.9 |
| B | 2 | 8 | 3579 | 8.16 | 1421 | 1360 | 271.9 |
| B | 3 | 80 | 3509 | 7.9 | 1421 | 1360 | 271.9 |
| C | 3 | 126 | 3798 | 6.68 | 1455 | 1368 | 363.6 |
| C | 12 | 241 | 3635 | 6.24 | 1455 | 1368 | 363.6 |
| C | 12 | 250 | 3627 | 6.21 | 1455 | 1368 | 363.6 |
| D | 15 | 46 | 3306 | 6.21 | 1292 | 1180 | 342.6 |
| D | 3 | 14 | 3261 | 6.07 | 1292 | 1180 | 342.6 |
| D | 7 | 3 | 3162 | 5.79 | 1292 | 1180 | 342.6 |
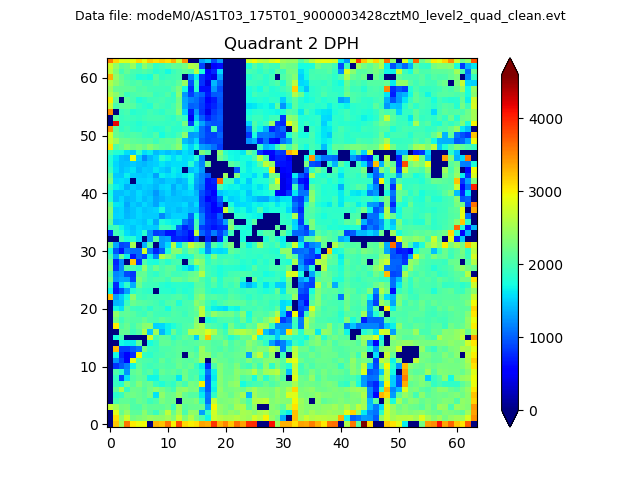
Histogram calculated using DETX and DETY for each event in the final _common_clean file
| Quadrant A |  |
 |
Quadrant B |
|---|---|---|---|
| Quadrant D |  |
 |
Quadrant C |
| Plot type | Count rate plots | Images |
|---|---|---|
| Comparison with Poisson distribution Blue bars denote a histogram of data divided into 1 sec bins. Red curve is a Poisson curve with rate = median count rate of data. |
 |
 |
| Quadrant-wise count rates Data is divided into 100 sec bins |
 |
|
| Module-wise count rates for Quadrant A Data is divided into 100 sec bins |
 |
 |
| Module-wise count rates for Quadrant B Data is divided into 100 sec bins |
 |
 |
| Module-wise count rates for Quadrant C Data is divided into 100 sec bins |
 |
 |
| Module-wise count rates for Quadrant D Data is divided into 100 sec bins |
 |
 |
| Parameter | Plot |
|---|---|
| CZT HV Monitor |  |
| D_VDD | 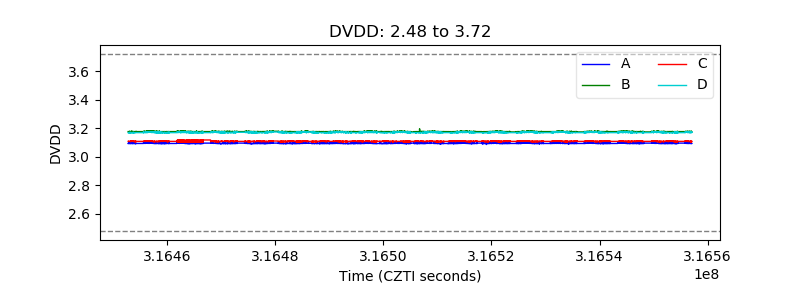 |
| Temperature 1 |  |
| Veto HV Monitor |  |
| Veto LLD | 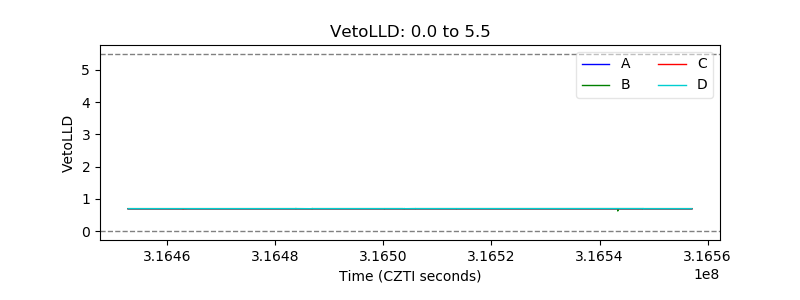 |
| Alpha Counter | 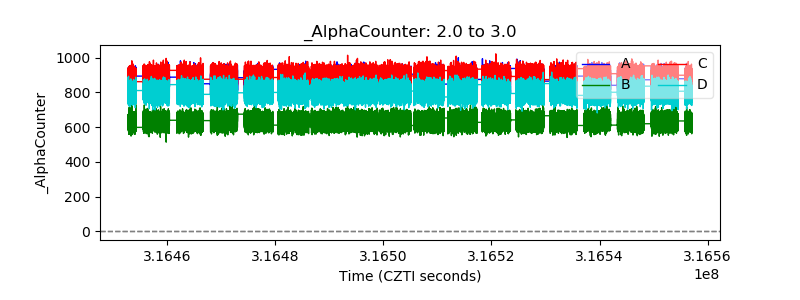 |
| _CPM_Rate |  |
| CZT Counter |  |
| +2.5 Volts monitor |  |
| +5 Volts monitor |  |
| _ROLL_ROT | 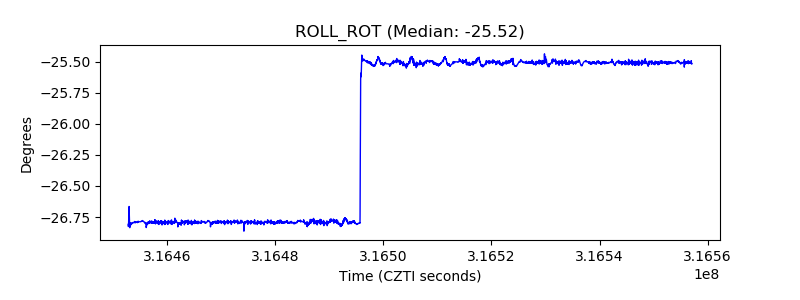 |
| _Roll_DEC |  |
| _Roll_RA |  |
| Veto Counter |  |