| Param | Original file | Final file |
|---|---|---|
| Filename | modeM0/AS1T03_175T01_9000003428_23187cztM0_level2.evt | modeM0/AS1T03_175T01_9000003428_23187cztM0_level2_quad_clean.evt |
| Size (bytes) | 323,948,160 | 33,701,760 |
| Size | 308.9 MB | 32.1 MB |
| Events in quadrant A | 1,644,313 | 203,617 |
| Events in quadrant B | 1,799,729 | 208,220 |
| Events in quadrant C | 1,970,206 | 200,887 |
| Events in quadrant D | 4,195,138 | 197,321 |
| Mode SS | |||
|---|---|---|---|
| Quadrant | BADHDUFLAG | Total packets | Discarded packets |
| A | 0 | 62 | 0 |
| B | 0 | 62 | 0 |
| C | 0 | 62 | 0 |
| D | 0 | 62 | 0 |
| Mode M9 | |||
|---|---|---|---|
| Quadrant | BADHDUFLAG | Total packets | Discarded packets |
| A | 0 | 12 | 0 |
| B | 0 | 12 | 0 |
| C | 0 | 12 | 0 |
| D | 0 | 12 | 0 |
| Mode M0 | |||
|---|---|---|---|
| Quadrant | BADHDUFLAG | Total packets | Discarded packets |
| A | 0 | 6884 | 1 |
| B | 0 | 7335 | 1 |
| C | 0 | 7798 | 1 |
| D | 0 | 14454 | 1 |
| Quadrant | Total seconds | Saturated seconds | Saturation percentage |
|---|---|---|---|
| A | 2940 | 77 | 2.619048% |
| B | 2940 | 87 | 2.959184% |
| C | 2940 | 166 | 5.646259% |
| D | 2940 | 1325 | 45.068027% |
Noise dominated data is calculated using 1-second bins in cleaned event files. If a bin has >2000 counts, and if more than 50% of those come from <1% of pixels, then it is considered to be noise-dominated and hence unusable.
| Quadrant | # 1 sec bins | Bins with >0 counts | Bins with >2000 counts | High rate bins dominated by noise | Noise dominated (total time) | Noise dominated (detector-on time) | Marked lightcurve |
|---|---|---|---|---|---|---|---|
| A | 4215 | 2940 | 0 | 0 | 0.00% | 0.00% | 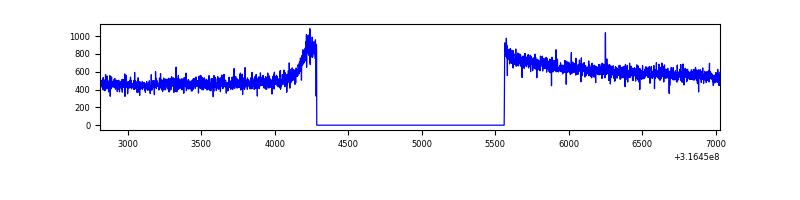 |
| B | 4215 | 2940 | 0 | 0 | 0.00% | 0.00% | 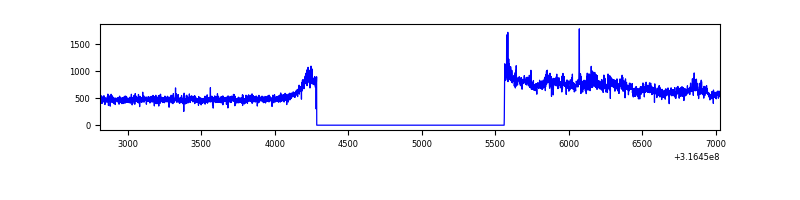 |
| C | 4215 | 2940 | 36 | 36 | 0.85% | 1.22% | 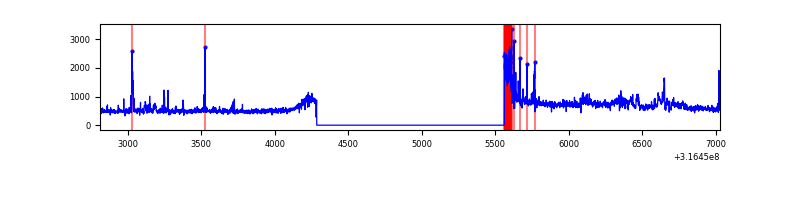 |
| D | 4215 | 2940 | 975 | 975 | 23.13% | 33.16% | 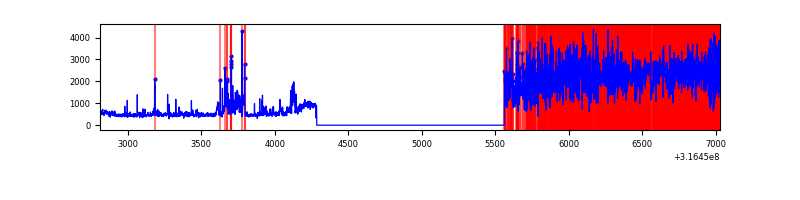 |
Top three noisy pixels from each quadrant. If the there are fewer than three noisy pixels in the level2.evt file, extra rows are filled as -1
| Pixel properties | Quadrant properties | ||||||
|---|---|---|---|---|---|---|---|
| Quadrant | DetID | PixID | Counts | Sigma | Mean | Median | Sigma |
| A | 13 | 254 | 4442 | 46.55 | 426 | 417 | 86.5 |
| A | 0 | 226 | 3809 | 39.23 | 426 | 417 | 86.5 |
| A | 3 | 137 | 3559 | 36.34 | 426 | 417 | 86.5 |
| B | 0 | 229 | 70438 | 875.71 | 423 | 413 | 80.0 |
| B | 0 | 190 | 67924 | 844.27 | 423 | 413 | 80.0 |
| B | 0 | 245 | 9021 | 107.65 | 423 | 413 | 80.0 |
| C | 0 | 10 | 169426 | 1788.2 | 409 | 414 | 94.5 |
| C | 8 | 208 | 79968 | 841.71 | 409 | 414 | 94.5 |
| C | 14 | 238 | 64956 | 682.87 | 409 | 414 | 94.5 |
| D | 1 | 52 | 2281844 | 27699.03 | 341 | 331 | 82.4 |
| D | 7 | 238 | 397589 | 4822.97 | 341 | 331 | 82.4 |
| D | 13 | 153 | 183569 | 2224.63 | 341 | 331 | 82.4 |
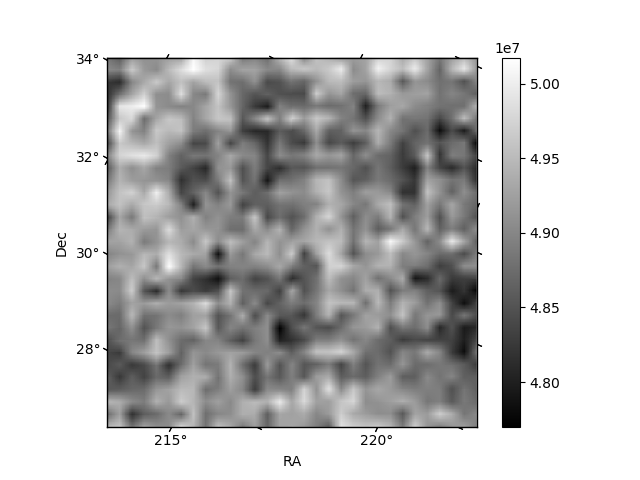
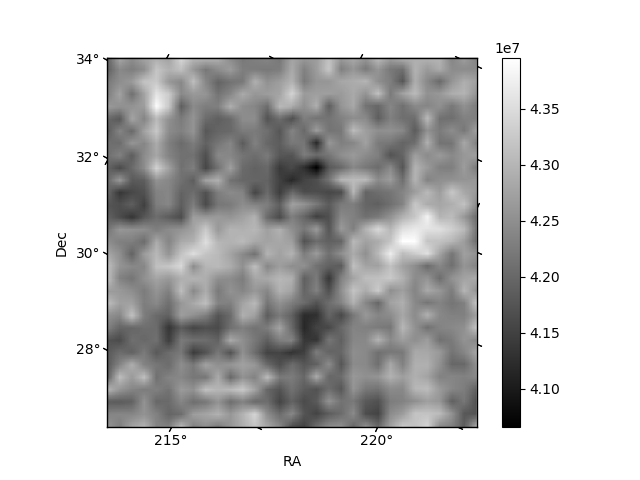
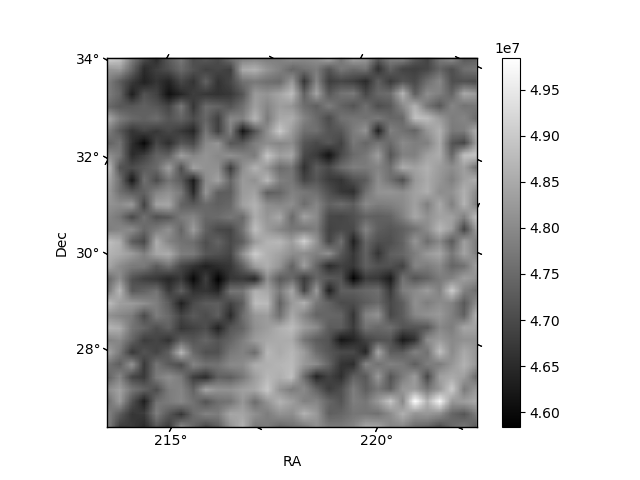
Histogram calculated using DETX and DETY for each event in the final _common_clean file
| Quadrant A | 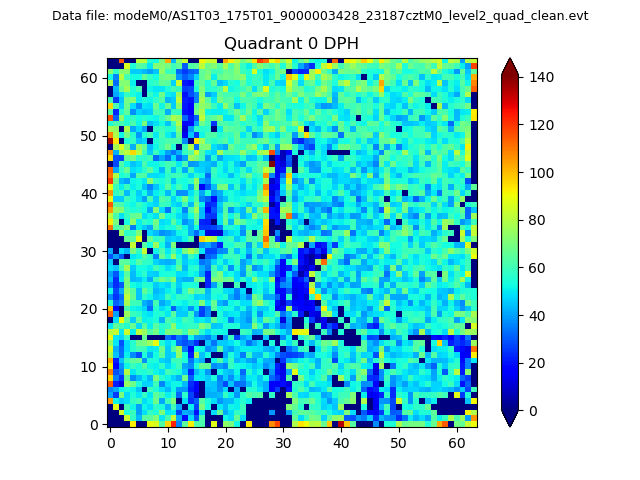 |
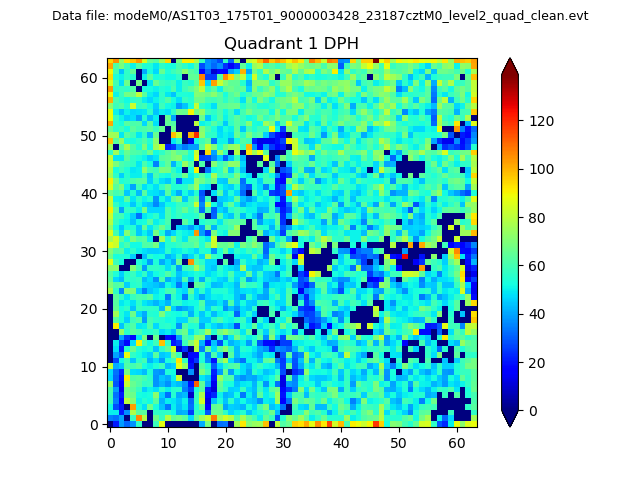 |
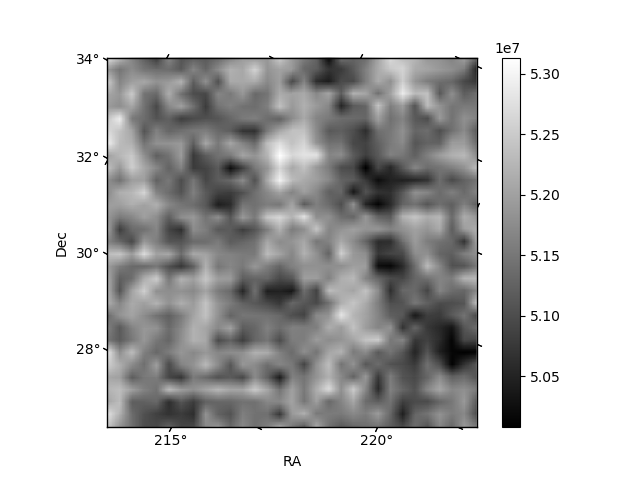
Quadrant B |
|---|---|---|---|
| Quadrant D | 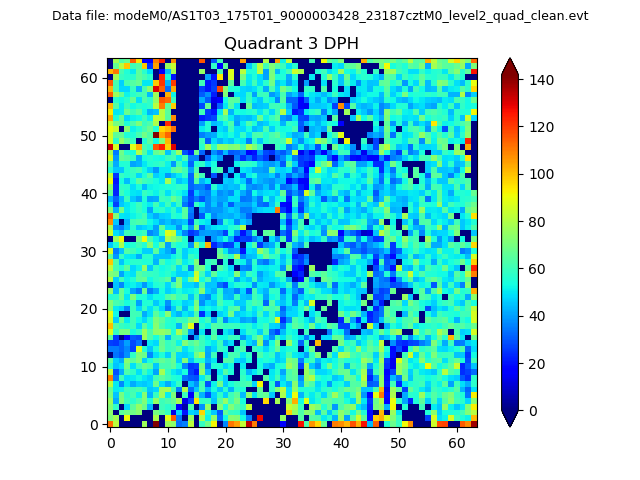 |
 |
Quadrant C |
| Plot type | Count rate plots | Images |
|---|---|---|
| Comparison with Poisson distribution Blue bars denote a histogram of data divided into 1 sec bins. Red curve is a Poisson curve with rate = median count rate of data. |
 |
 |
| Quadrant-wise count rates Data is divided into 100 sec bins |
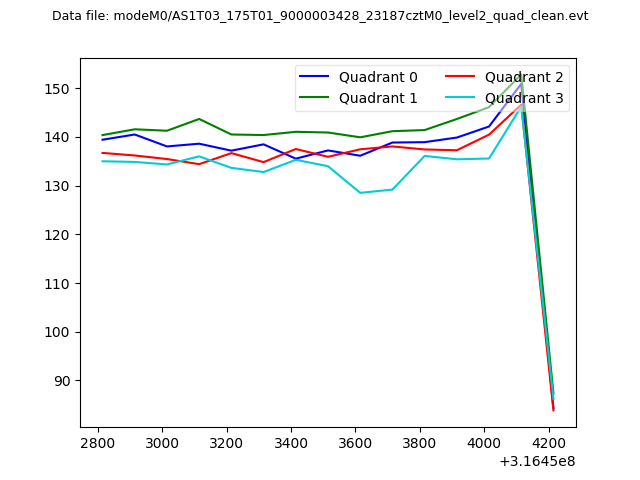 |
|
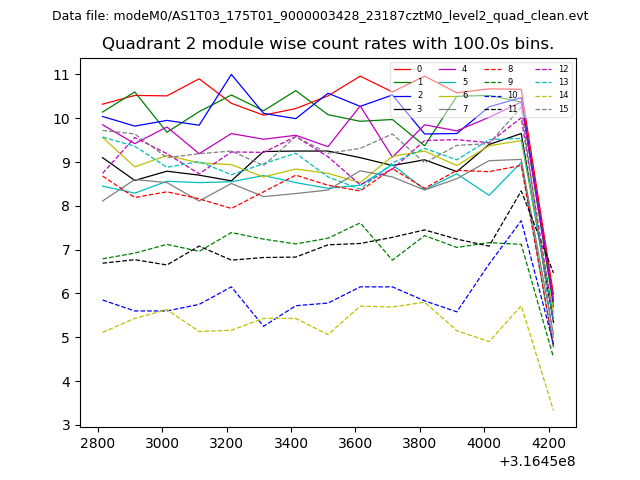
| Module-wise count rates for Quadrant A Data is divided into 100 sec bins |
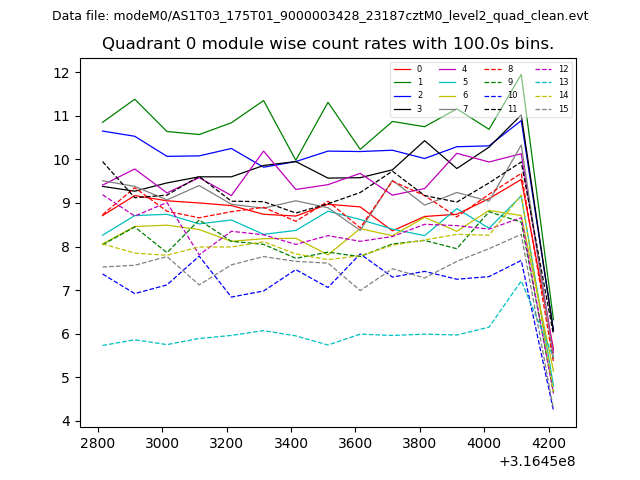 |
 |
| Module-wise count rates for Quadrant B Data is divided into 100 sec bins |
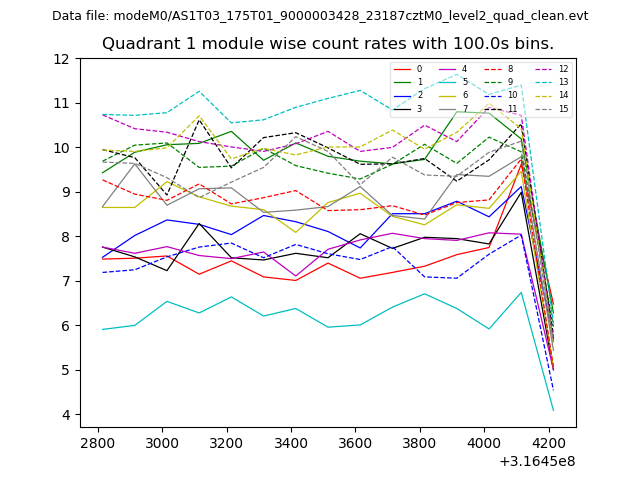 |
 |
| Module-wise count rates for Quadrant C Data is divided into 100 sec bins |
 |
 |
| Module-wise count rates for Quadrant D Data is divided into 100 sec bins |
 |
 |
| Parameter | Plot |
|---|---|
| CZT HV Monitor | 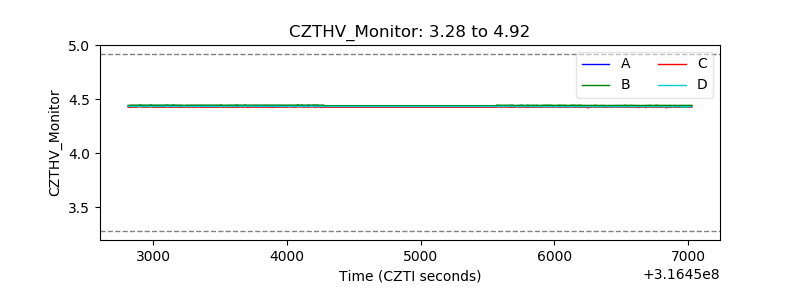 |
| D_VDD | 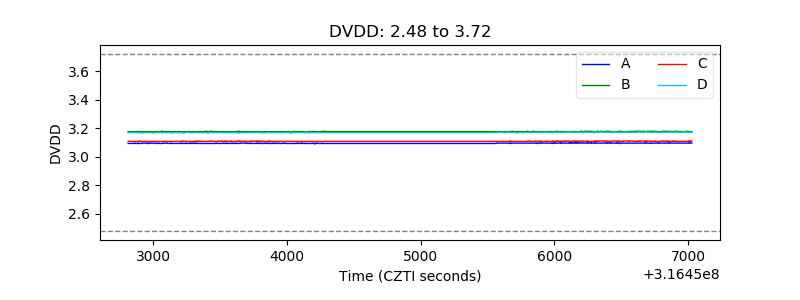 |
| Temperature 1 |  |
| Veto HV Monitor | 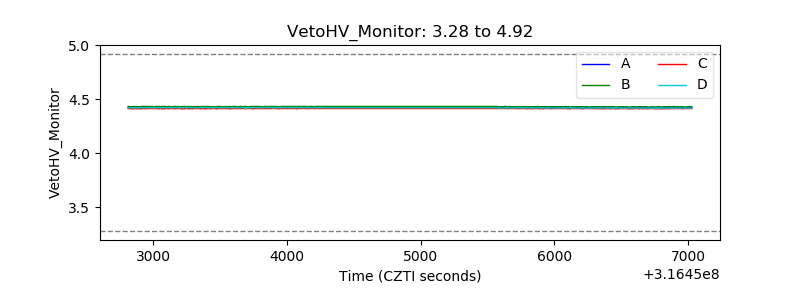 |
| Veto LLD | 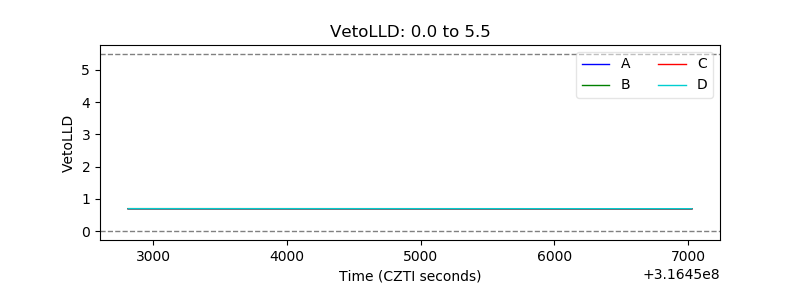 |
| Alpha Counter | 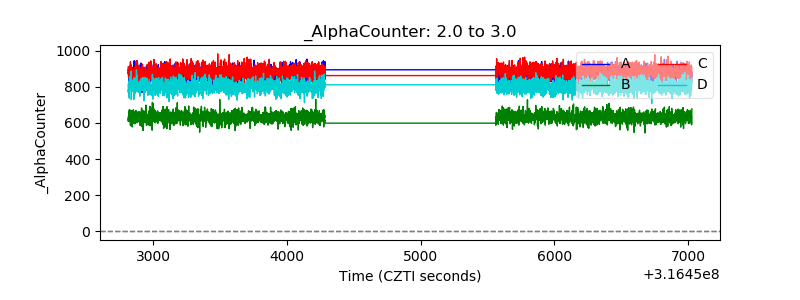 |
| _CPM_Rate | 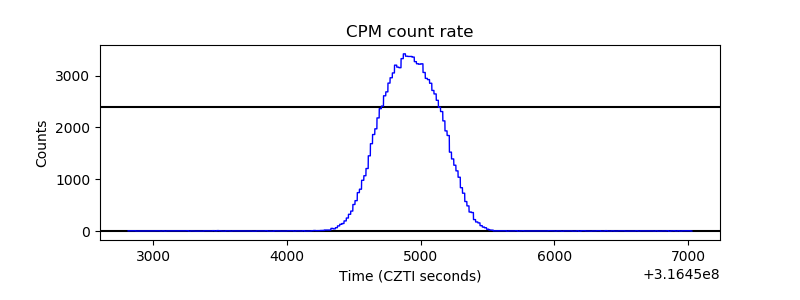 |
| CZT Counter |  |
| +2.5 Volts monitor |  |
| +5 Volts monitor |  |
| _ROLL_ROT |  |
| _Roll_DEC |  |
| _Roll_RA |  |
| Veto Counter |  |