| Param | Original file | Final file |
|---|---|---|
| Filename | modeM0/AS1T03_175T01_9000003428_23189cztM0_level2.evt | modeM0/AS1T03_175T01_9000003428_23189cztM0_level2_quad_clean.evt |
| Size (bytes) | 775,877,760 | 74,499,840 |
| Size | 739.9 MB | 71.0 MB |
| Events in quadrant A | 3,097,116 | 515,270 |
| Events in quadrant B | 3,144,696 | 527,157 |
| Events in quadrant C | 3,496,503 | 512,903 |
| Events in quadrant D | 13,364,336 | 291,173 |
| Mode SS | |||
|---|---|---|---|
| Quadrant | BADHDUFLAG | Total packets | Discarded packets |
| A | 0 | 120 | 0 |
| B | 0 | 120 | 0 |
| C | 0 | 120 | 0 |
| D | 0 | 120 | 0 |
| Mode M9 | |||
|---|---|---|---|
| Quadrant | BADHDUFLAG | Total packets | Discarded packets |
| A | 0 | 13 | 0 |
| B | 0 | 13 | 0 |
| C | 0 | 13 | 0 |
| D | 0 | 13 | 0 |
| Mode M0 | |||
|---|---|---|---|
| Quadrant | BADHDUFLAG | Total packets | Discarded packets |
| A | 0 | 12875 | 1 |
| B | 0 | 13016 | 1 |
| C | 0 | 14253 | 1 |
| D | 0 | 43706 | 2 |
| Quadrant | Total seconds | Saturated seconds | Saturation percentage |
|---|---|---|---|
| A | 5834 | 80 | 1.371272% |
| B | 5835 | 104 | 1.782348% |
| C | 5835 | 213 | 3.650386% |
| D | 5834 | 4636 | 79.465204% |
Noise dominated data is calculated using 1-second bins in cleaned event files. If a bin has >2000 counts, and if more than 50% of those come from <1% of pixels, then it is considered to be noise-dominated and hence unusable.
| Quadrant | # 1 sec bins | Bins with >0 counts | Bins with >2000 counts | High rate bins dominated by noise | Noise dominated (total time) | Noise dominated (detector-on time) | Marked lightcurve |
|---|---|---|---|---|---|---|---|
| A | 7174 | 5834 | 2 | 2 | 0.03% | 0.03% | 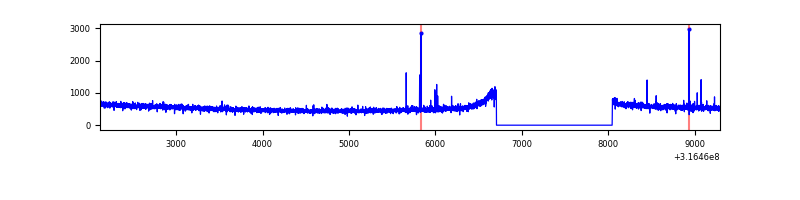 |
| B | 7175 | 5836 | 1 | 1 | 0.01% | 0.02% | 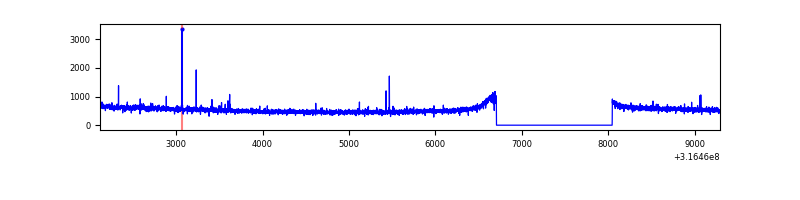 |
| C | 7175 | 5836 | 36 | 36 | 0.50% | 0.62% | 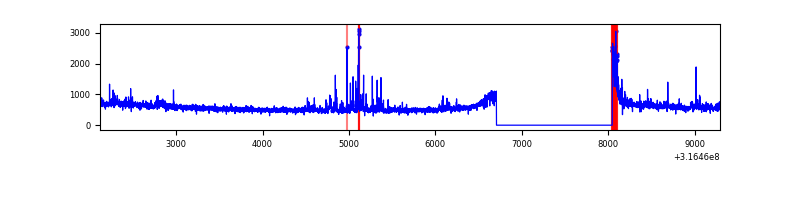 |
| D | 7174 | 5834 | 3828 | 3828 | 53.36% | 65.62% | 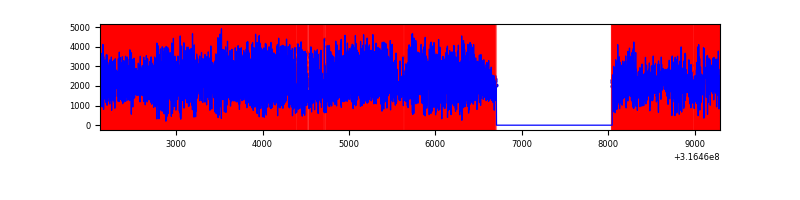 |
Top three noisy pixels from each quadrant. If the there are fewer than three noisy pixels in the level2.evt file, extra rows are filled as -1
| Pixel properties | Quadrant properties | ||||||
|---|---|---|---|---|---|---|---|
| Quadrant | DetID | PixID | Counts | Sigma | Mean | Median | Sigma |
| A | 6 | 16 | 26330 | 160.53 | 797 | 782 | 159.1 |
| A | 13 | 254 | 9103 | 52.29 | 797 | 782 | 159.1 |
| A | 0 | 226 | 6890 | 38.38 | 797 | 782 | 159.1 |
| B | 12 | 111 | 16973 | 108.0 | 798 | 781 | 149.9 |
| B | 0 | 190 | 15375 | 97.34 | 798 | 781 | 149.9 |
| B | 11 | 111 | 14949 | 94.5 | 798 | 781 | 149.9 |
| C | 0 | 10 | 194407 | 1089.61 | 775 | 785 | 177.7 |
| C | 14 | 238 | 124094 | 693.92 | 775 | 785 | 177.7 |
| C | 7 | 247 | 109240 | 610.33 | 775 | 785 | 177.7 |
| D | 1 | 52 | 9878924 | 85210.79 | 481 | 469 | 115.9 |
| D | 7 | 238 | 1043232 | 8994.79 | 481 | 469 | 115.9 |
| D | 12 | 233 | 261244 | 2249.42 | 481 | 469 | 115.9 |
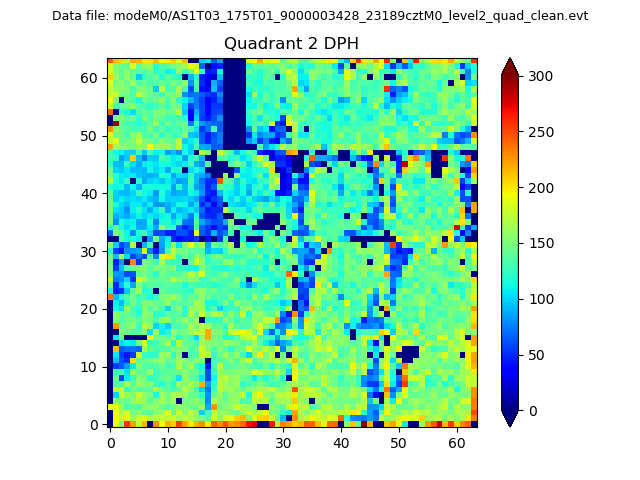
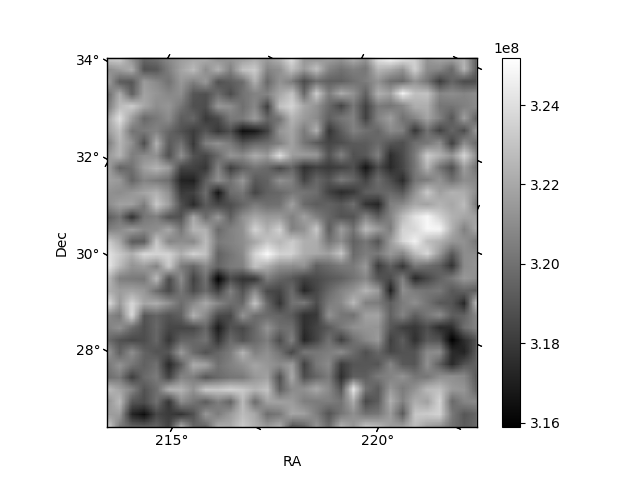
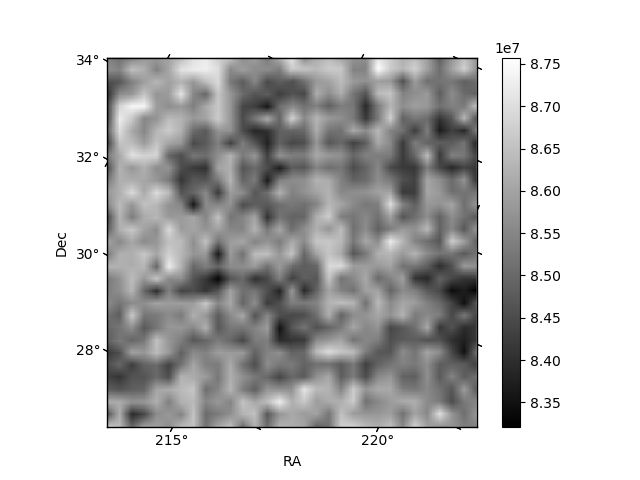
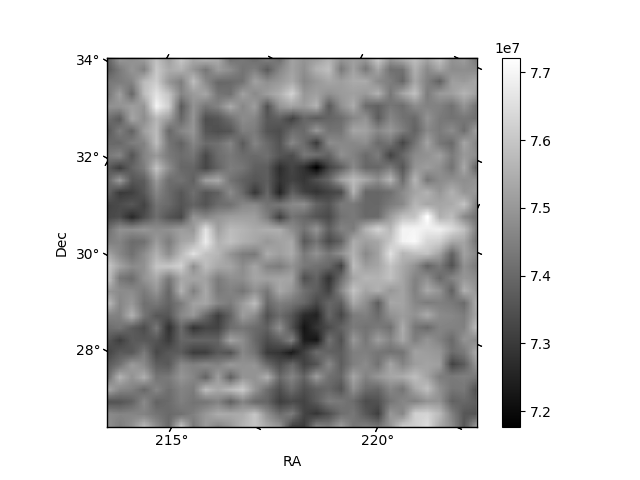
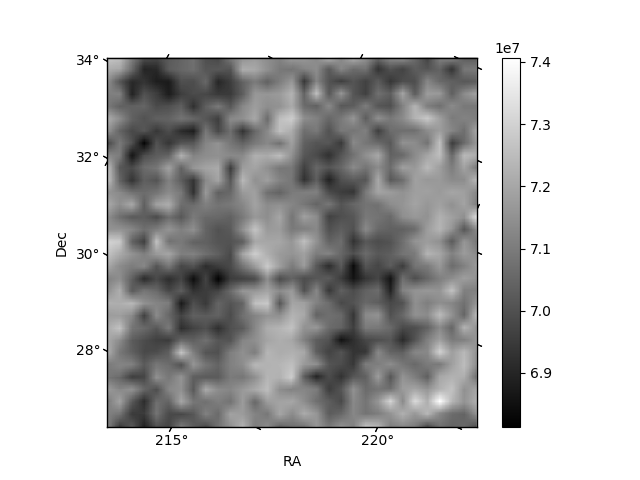
Histogram calculated using DETX and DETY for each event in the final _common_clean file
| Quadrant A | 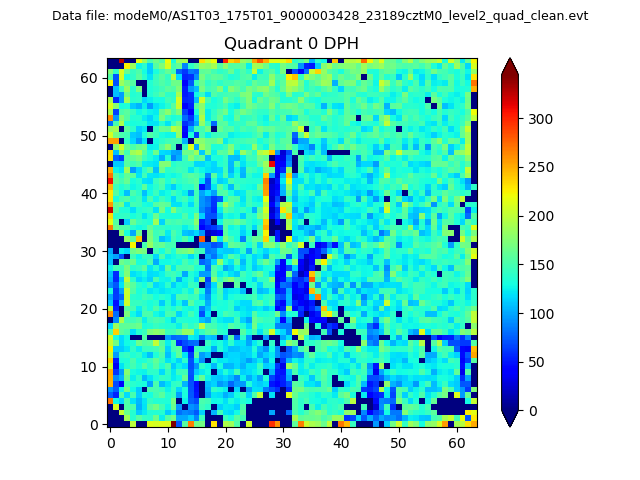 |
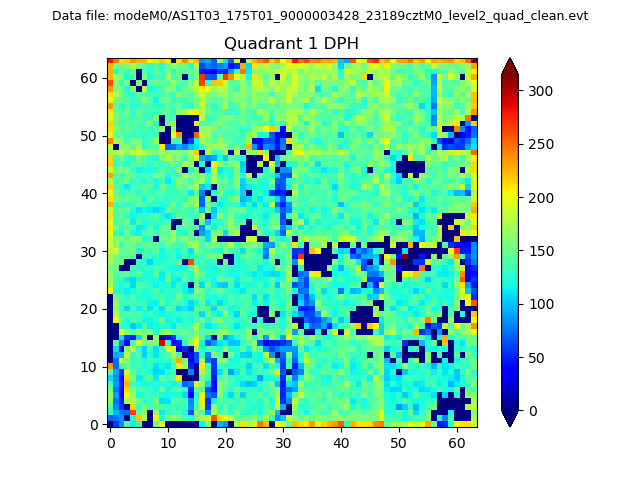 |
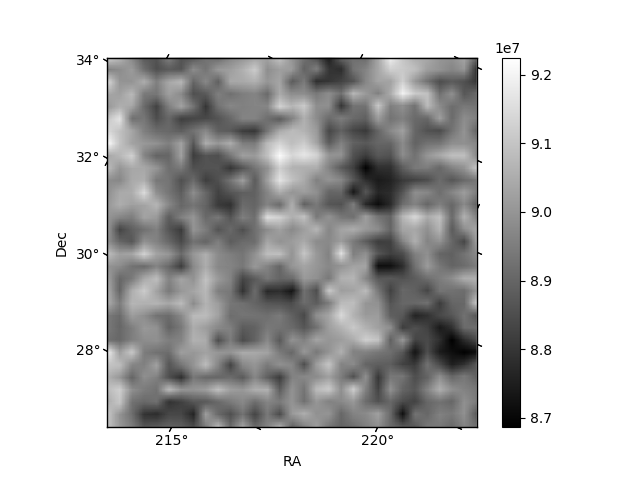
Quadrant B |
|---|---|---|---|
| Quadrant D | 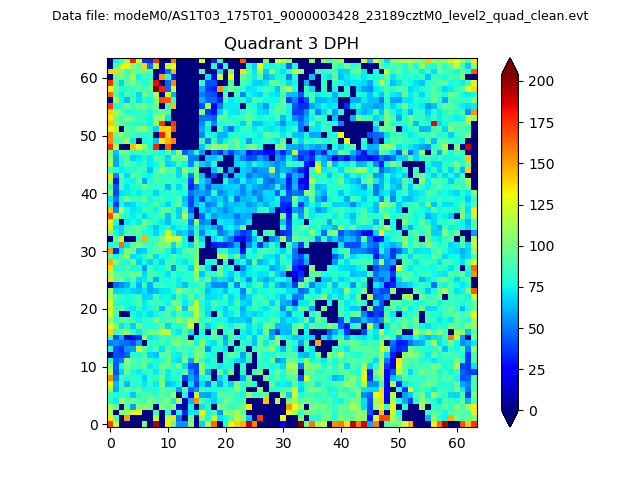 |
 |
Quadrant C |
| Plot type | Count rate plots | Images |
|---|---|---|
| Comparison with Poisson distribution Blue bars denote a histogram of data divided into 1 sec bins. Red curve is a Poisson curve with rate = median count rate of data. |
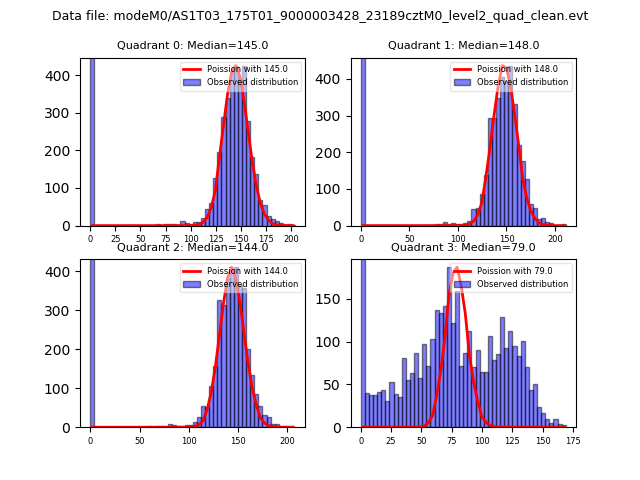 |
 |
| Quadrant-wise count rates Data is divided into 100 sec bins |
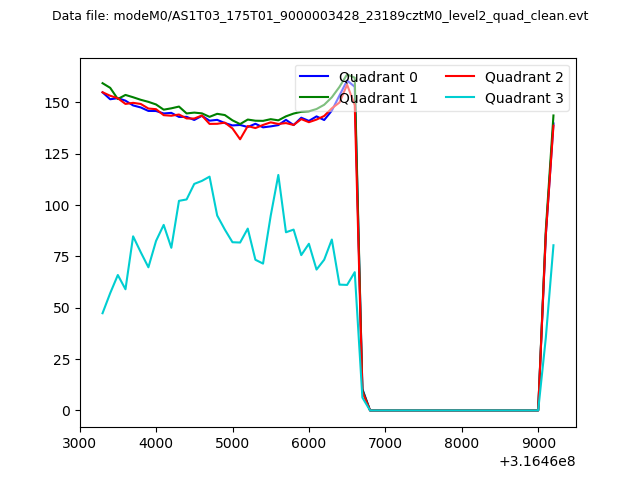 |
|
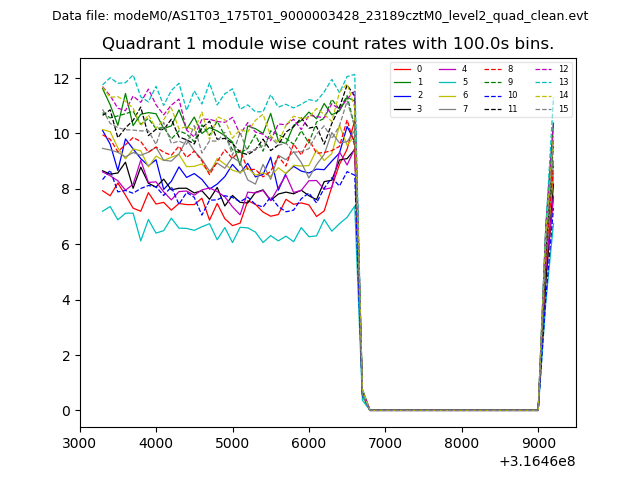
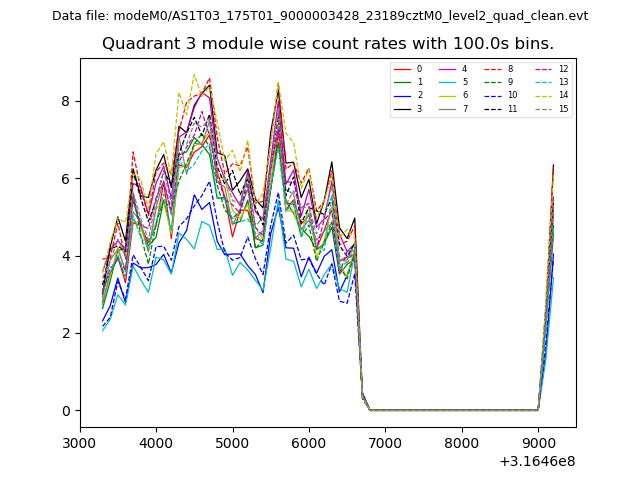
| Module-wise count rates for Quadrant A Data is divided into 100 sec bins |
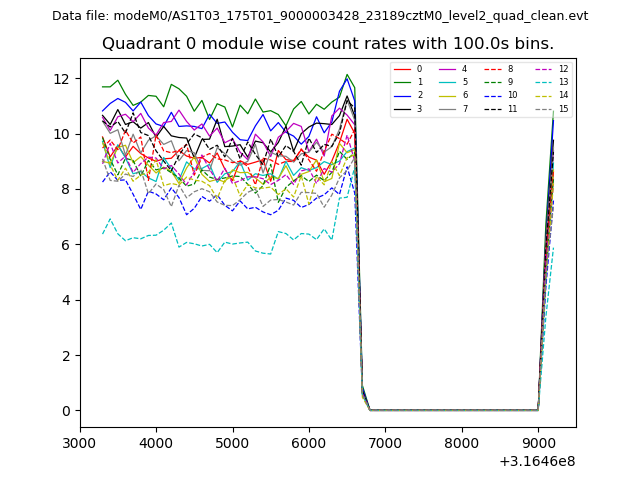 |
 |
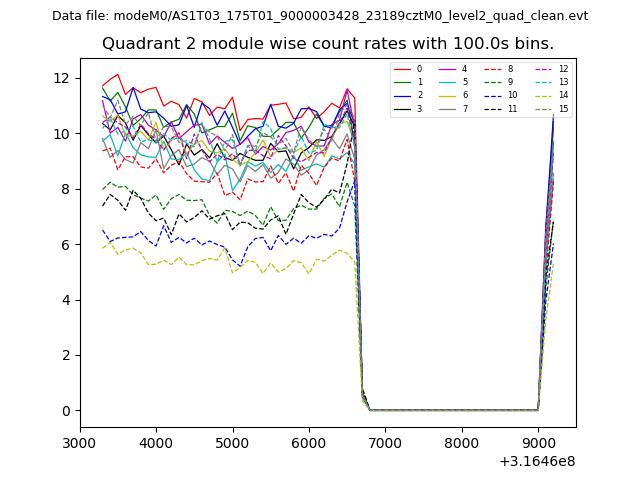
| Module-wise count rates for Quadrant B Data is divided into 100 sec bins |
 |
 |
| Module-wise count rates for Quadrant C Data is divided into 100 sec bins |
 |
 |
| Module-wise count rates for Quadrant D Data is divided into 100 sec bins |
 |
 |
| Parameter | Plot |
|---|---|
| CZT HV Monitor | 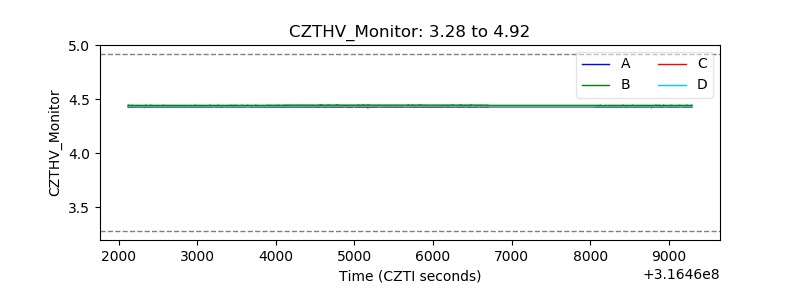 |
| D_VDD | 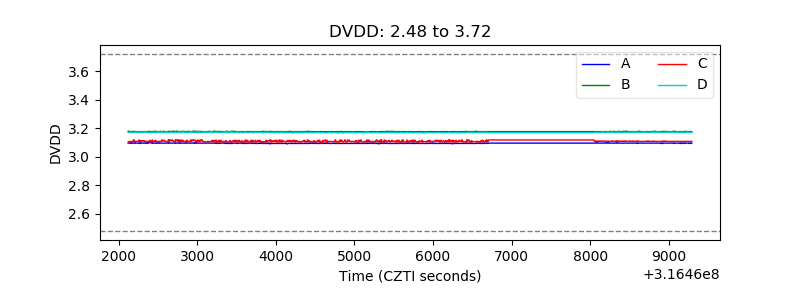 |
| Temperature 1 | 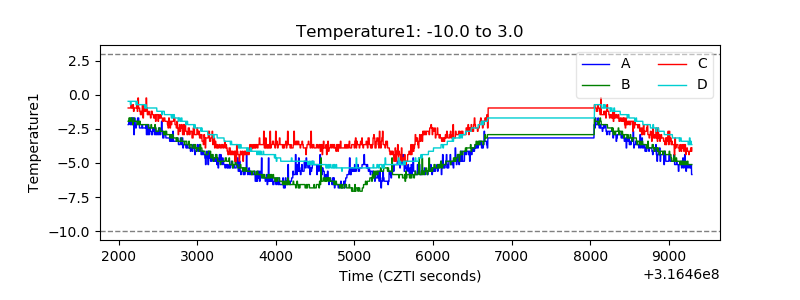 |
| Veto HV Monitor | 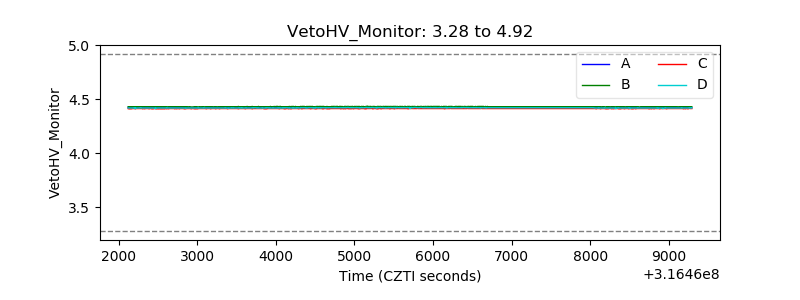 |
| Veto LLD | 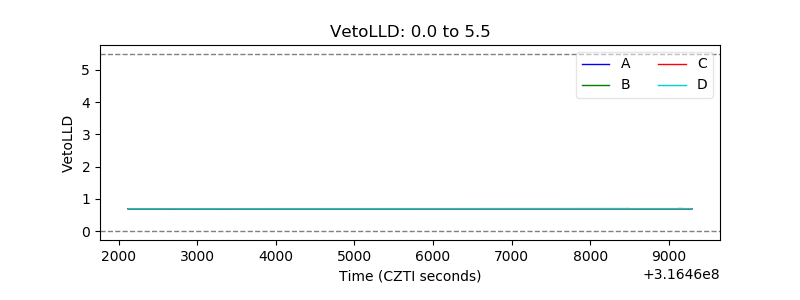 |
| Alpha Counter | 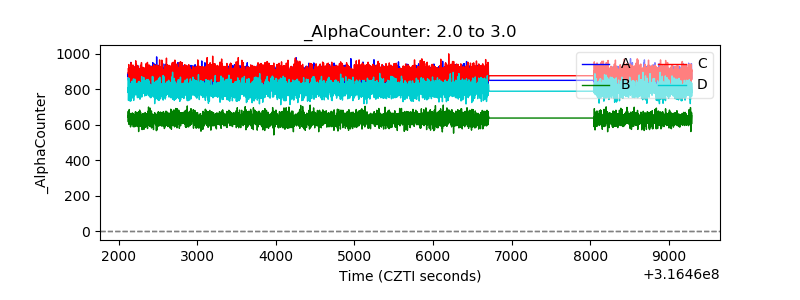 |
| _CPM_Rate | 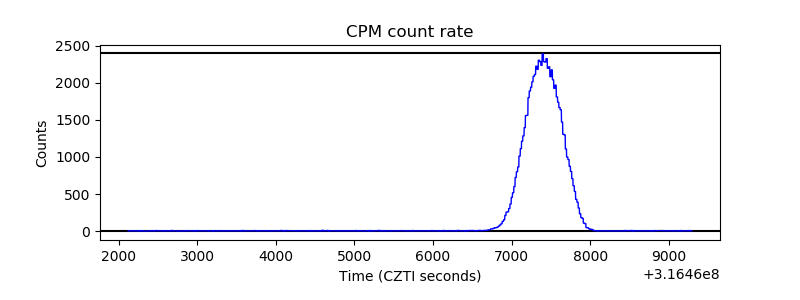 |
| CZT Counter |  |
| +2.5 Volts monitor |  |
| +5 Volts monitor |  |
| _ROLL_ROT | 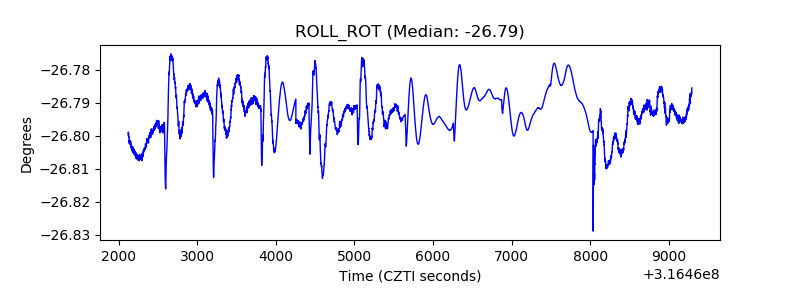 |
| _Roll_DEC | 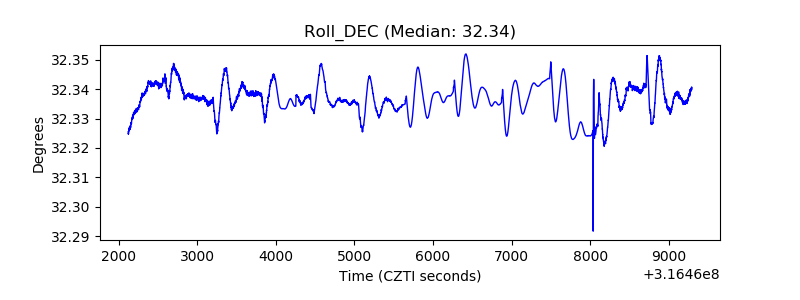 |
| _Roll_RA | 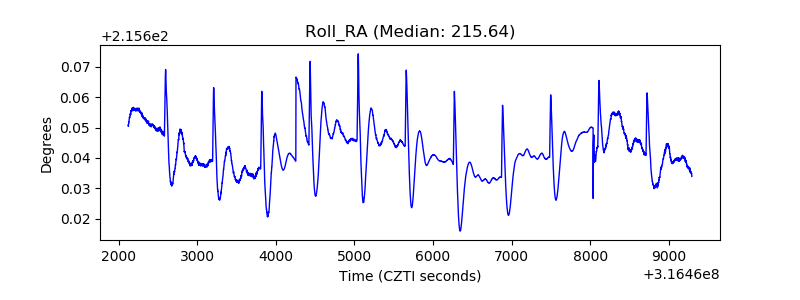 |
| Veto Counter | 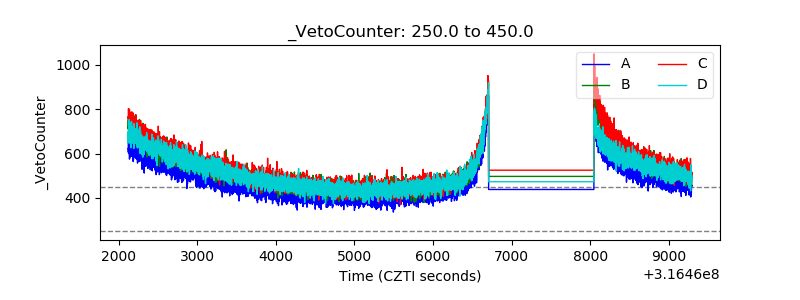 |