| Param | Original file | Final file |
|---|---|---|
| Filename | modeM0/AS1T03_175T01_9000003428_23191cztM0_level2.evt | modeM0/AS1T03_175T01_9000003428_23191cztM0_level2_quad_clean.evt |
| Size (bytes) | 515,056,320 | 94,118,400 |
| Size | 491.2 MB | 89.8 MB |
| Events in quadrant A | 3,048,776 | 608,913 |
| Events in quadrant B | 3,115,482 | 620,987 |
| Events in quadrant C | 3,422,282 | 605,609 |
| Events in quadrant D | 5,577,335 | 567,623 |
| Mode SS | |||
|---|---|---|---|
| Quadrant | BADHDUFLAG | Total packets | Discarded packets |
| A | 0 | 130 | 0 |
| B | 0 | 130 | 0 |
| C | 0 | 130 | 0 |
| D | 0 | 130 | 0 |
| Mode M9 | |||
|---|---|---|---|
| Quadrant | BADHDUFLAG | Total packets | Discarded packets |
| A | 0 | 9 | 0 |
| B | 0 | 9 | 0 |
| C | 0 | 9 | 0 |
| D | 0 | 9 | 0 |
| Mode M0 | |||
|---|---|---|---|
| Quadrant | BADHDUFLAG | Total packets | Discarded packets |
| A | 0 | 13222 | 1 |
| B | 0 | 13328 | 1 |
| C | 0 | 14278 | 1 |
| D | 0 | 21069 | 1 |
| Quadrant | Total seconds | Saturated seconds | Saturation percentage |
|---|---|---|---|
| A | 6405 | 46 | 0.718189% |
| B | 6406 | 69 | 1.077115% |
| C | 6406 | 155 | 2.419607% |
| D | 6406 | 646 | 10.084296% |
Noise dominated data is calculated using 1-second bins in cleaned event files. If a bin has >2000 counts, and if more than 50% of those come from <1% of pixels, then it is considered to be noise-dominated and hence unusable.
| Quadrant | # 1 sec bins | Bins with >0 counts | Bins with >2000 counts | High rate bins dominated by noise | Noise dominated (total time) | Noise dominated (detector-on time) | Marked lightcurve |
|---|---|---|---|---|---|---|---|
| A | 7290 | 6406 | 0 | 0 | 0.00% | 0.00% | 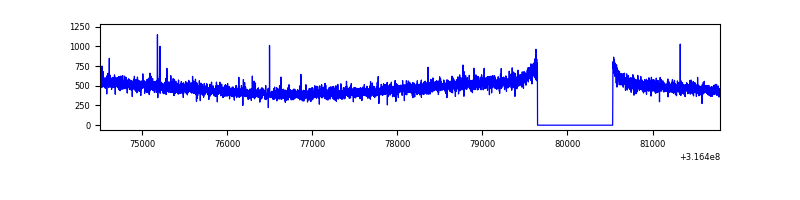 |
| B | 7291 | 6406 | 3 | 3 | 0.04% | 0.05% | 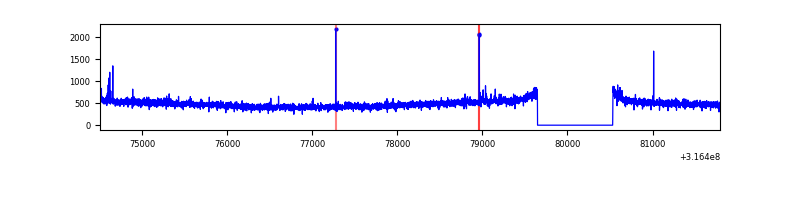 |
| C | 7291 | 6407 | 28 | 28 | 0.38% | 0.44% | 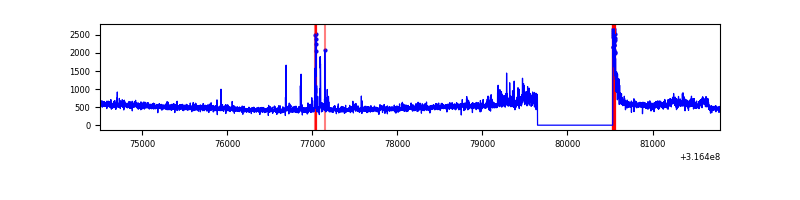 |
| D | 7291 | 6407 | 430 | 430 | 5.90% | 6.71% | 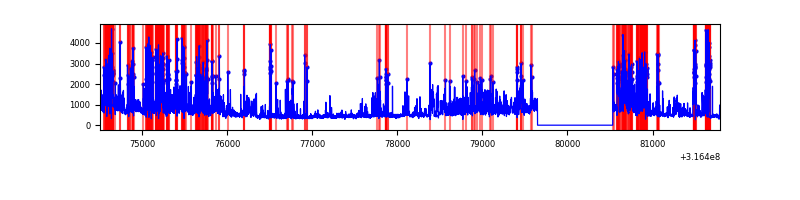 |
Top three noisy pixels from each quadrant. If the there are fewer than three noisy pixels in the level2.evt file, extra rows are filled as -1
| Pixel properties | Quadrant properties | ||||||
|---|---|---|---|---|---|---|---|
| Quadrant | DetID | PixID | Counts | Sigma | Mean | Median | Sigma |
| A | 13 | 254 | 10527 | 61.07 | 789 | 774 | 159.7 |
| A | 6 | 16 | 7607 | 42.79 | 789 | 774 | 159.7 |
| A | 3 | 137 | 6867 | 38.15 | 789 | 774 | 159.7 |
| B | 12 | 111 | 18268 | 117.34 | 790 | 772 | 149.1 |
| B | 11 | 111 | 16300 | 104.14 | 790 | 772 | 149.1 |
| B | 14 | 111 | 14108 | 89.44 | 790 | 772 | 149.1 |
| C | 0 | 10 | 193793 | 1085.04 | 765 | 773 | 177.9 |
| C | 14 | 238 | 121842 | 680.58 | 765 | 773 | 177.9 |
| C | 7 | 247 | 100580 | 561.05 | 765 | 773 | 177.9 |
| D | 1 | 52 | 2225482 | 12269.9 | 744 | 724 | 181.3 |
| D | 7 | 238 | 327453 | 1801.96 | 744 | 724 | 181.3 |
| D | 13 | 153 | 82756 | 452.42 | 744 | 724 | 181.3 |
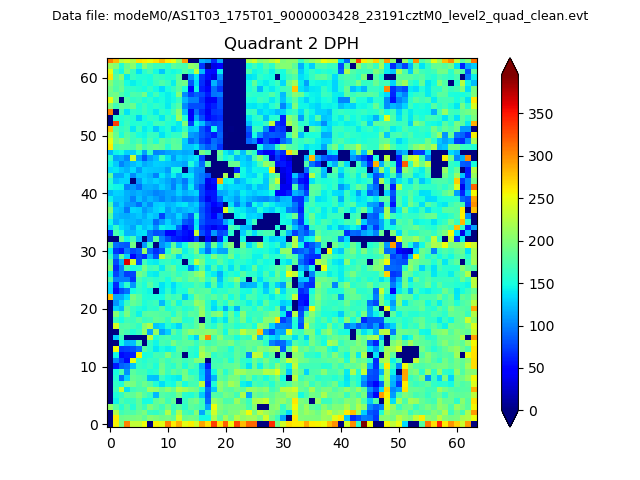
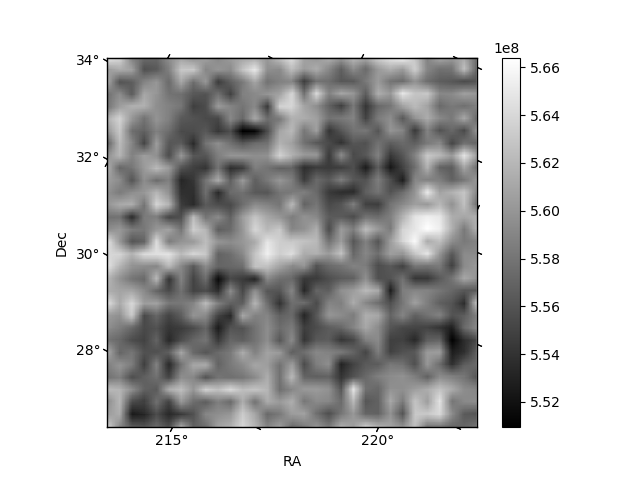
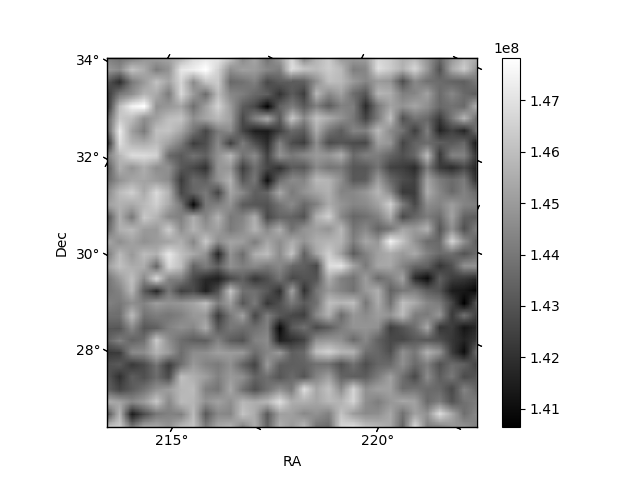
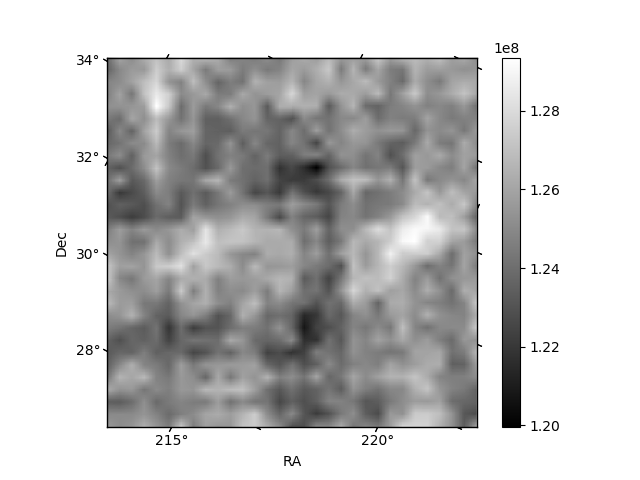
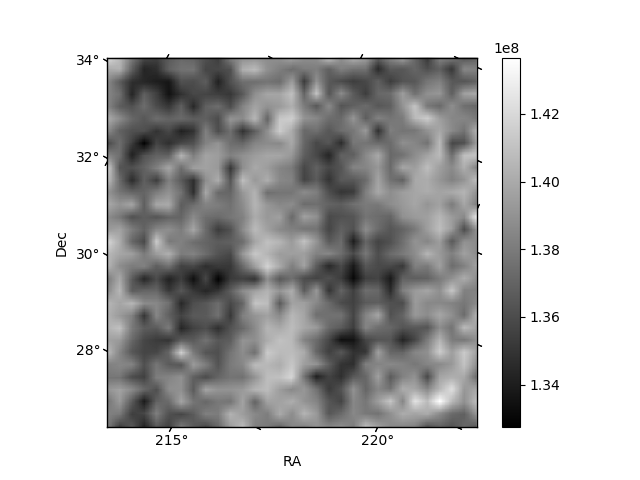
Histogram calculated using DETX and DETY for each event in the final _common_clean file
| Quadrant A | 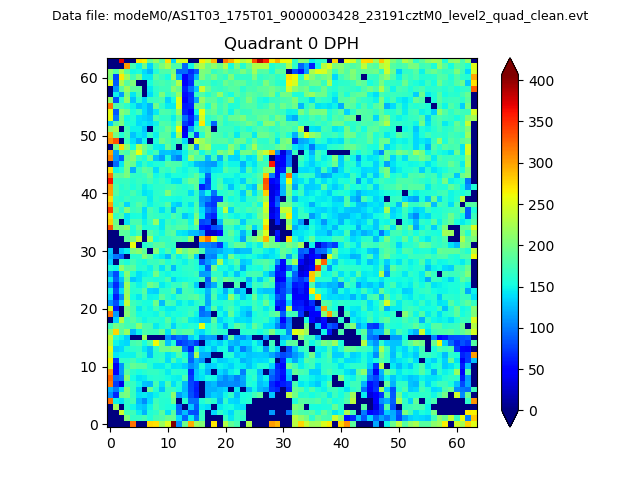 |
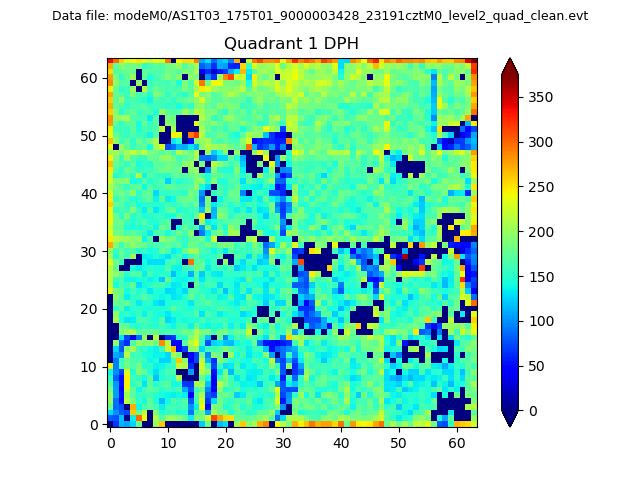 |
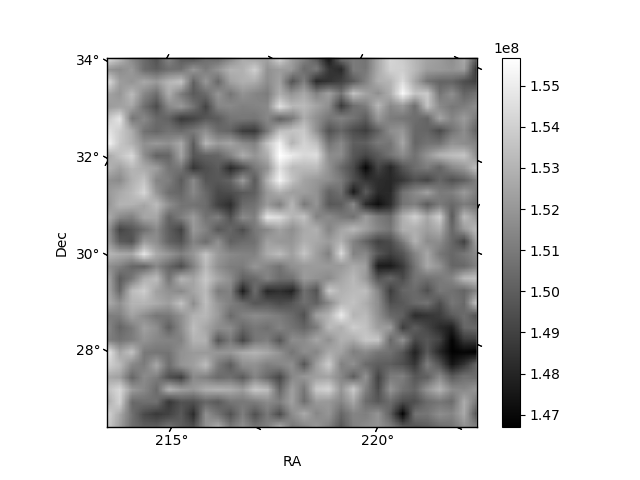
Quadrant B |
|---|---|---|---|
| Quadrant D | 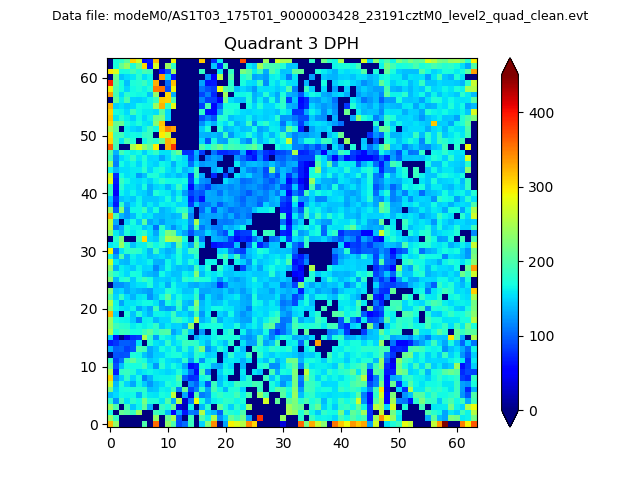 |
 |
Quadrant C |
| Plot type | Count rate plots | Images |
|---|---|---|
| Comparison with Poisson distribution Blue bars denote a histogram of data divided into 1 sec bins. Red curve is a Poisson curve with rate = median count rate of data. |
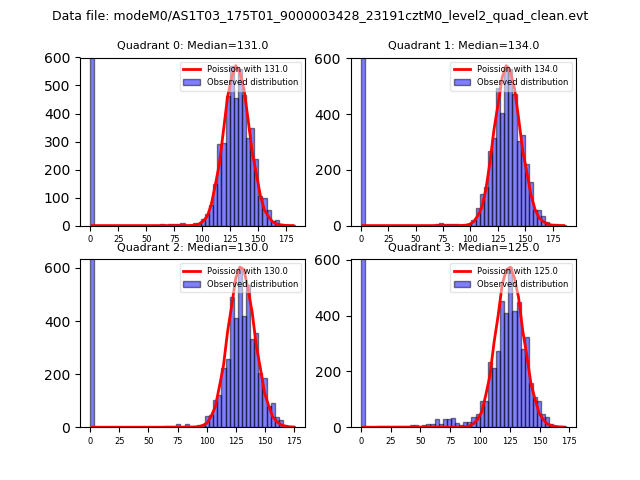 |
 |
| Quadrant-wise count rates Data is divided into 100 sec bins |
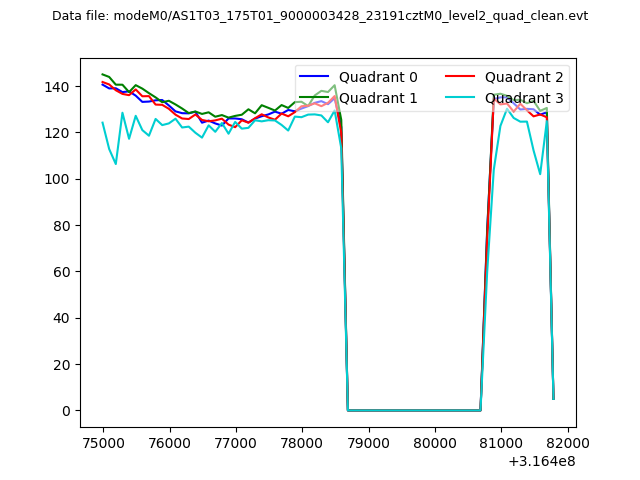 |
|
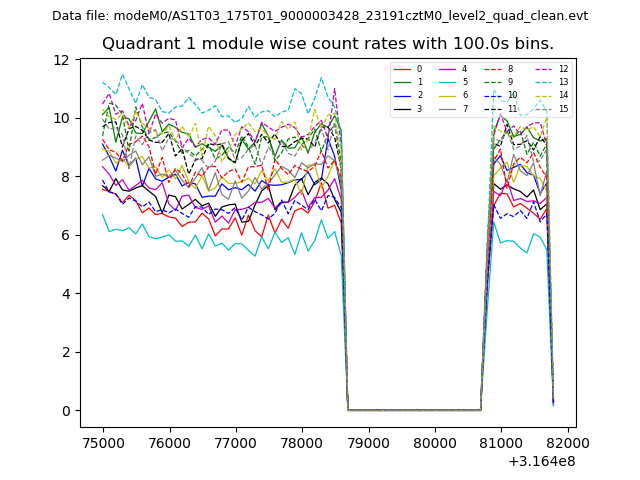
| Module-wise count rates for Quadrant A Data is divided into 100 sec bins |
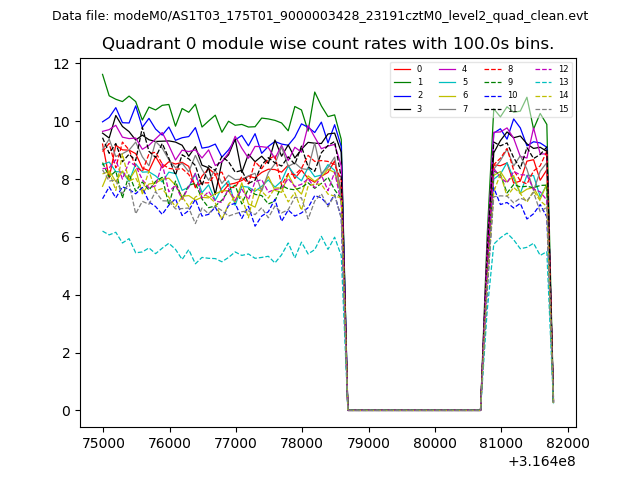 |
 |
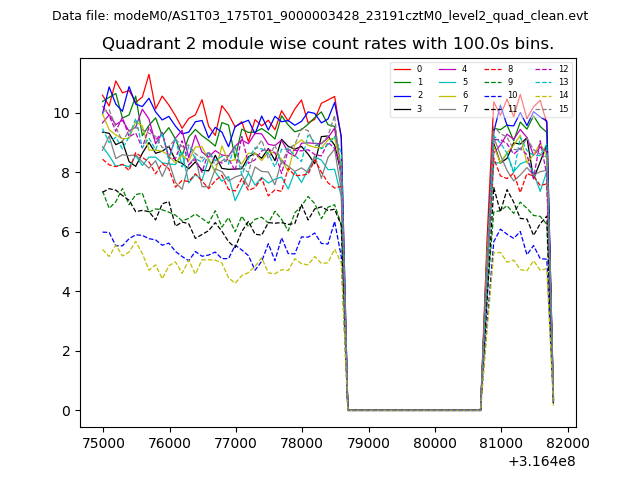
| Module-wise count rates for Quadrant B Data is divided into 100 sec bins |
 |
 |
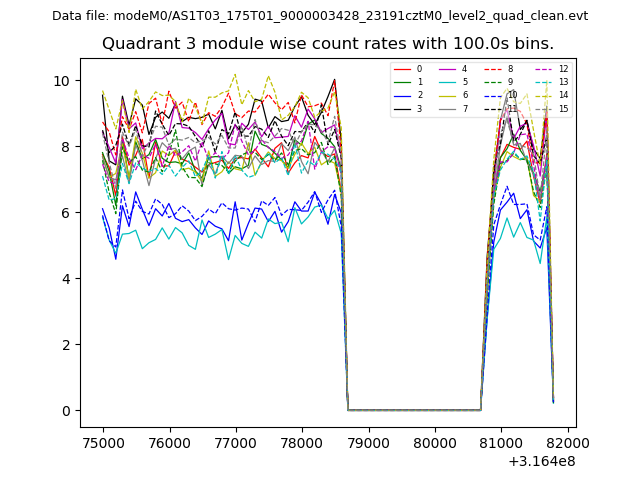
| Module-wise count rates for Quadrant C Data is divided into 100 sec bins |
 |
 |
| Module-wise count rates for Quadrant D Data is divided into 100 sec bins |
 |
 |
| Parameter | Plot |
|---|---|
| CZT HV Monitor | 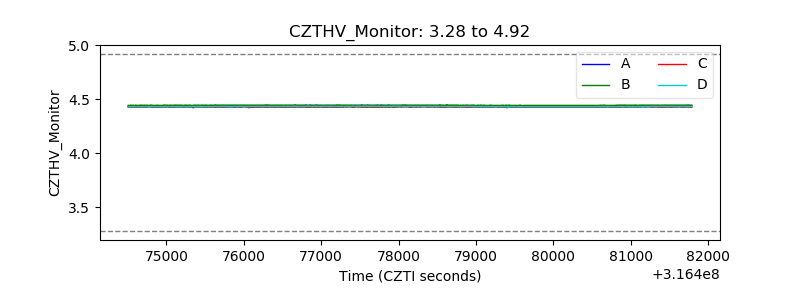 |
| D_VDD | 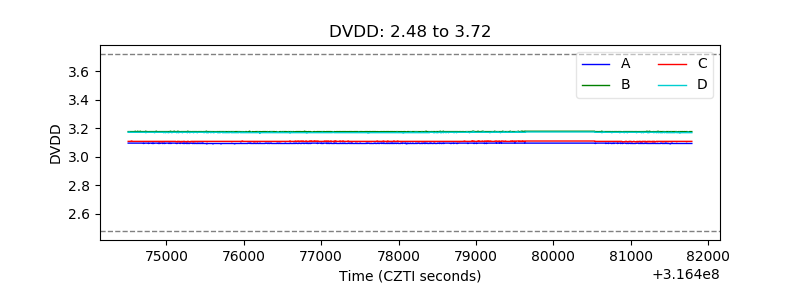 |
| Temperature 1 | 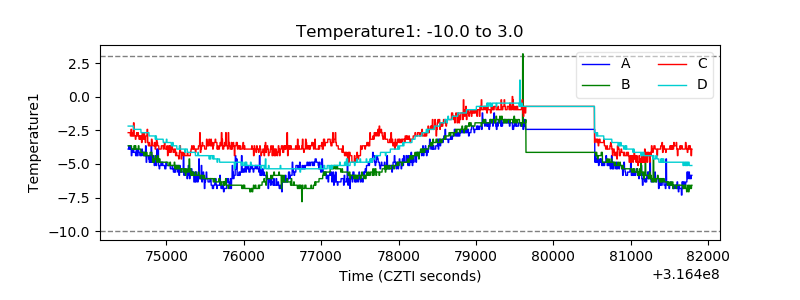 |
| Veto HV Monitor | 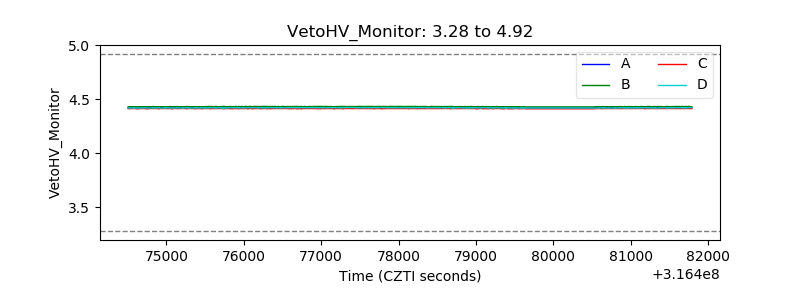 |
| Veto LLD |  |
| Alpha Counter | 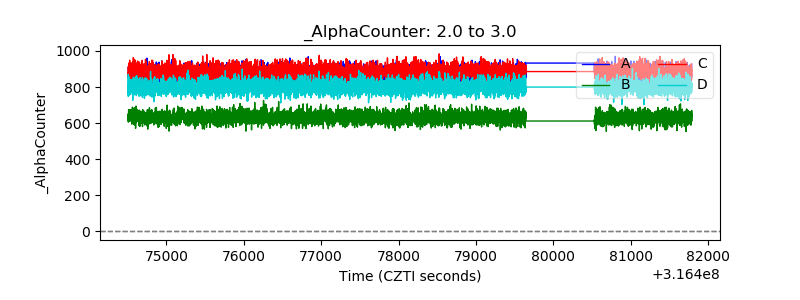 |
| _CPM_Rate | 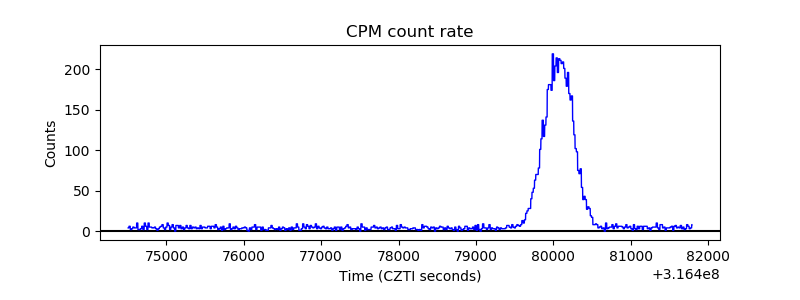 |
| CZT Counter | 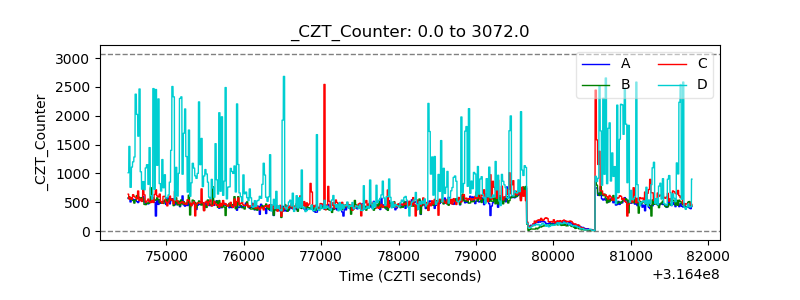 |
| +2.5 Volts monitor | 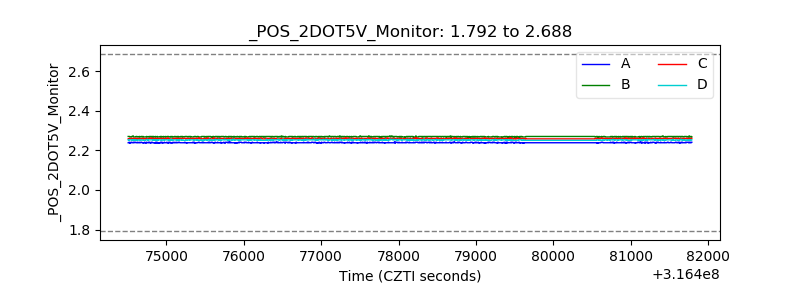 |
| +5 Volts monitor | 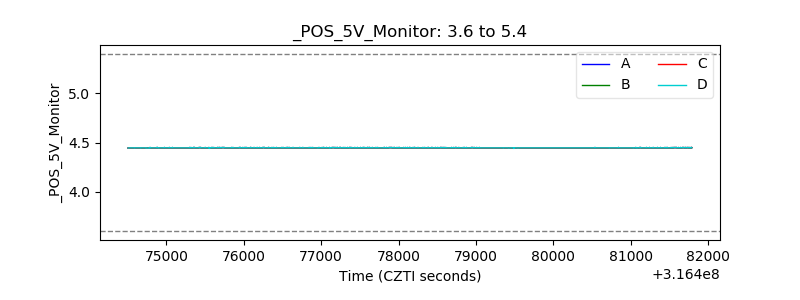 |
| _ROLL_ROT | 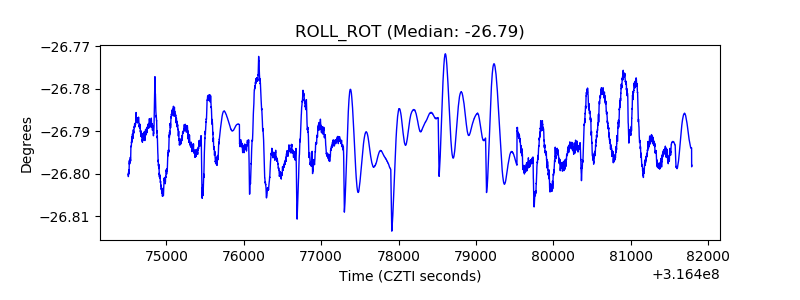 |
| _Roll_DEC | 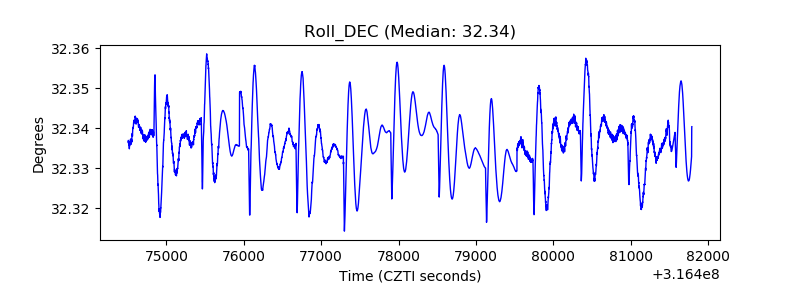 |
| _Roll_RA | 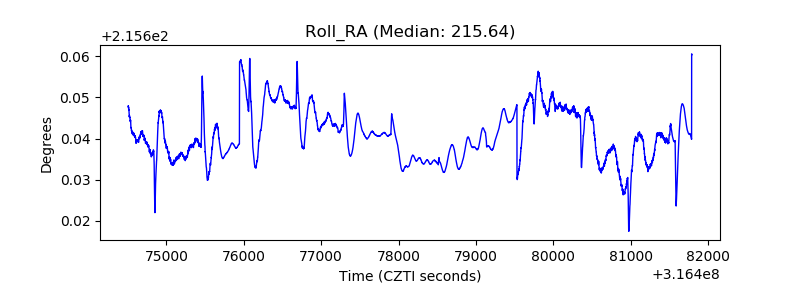 |
| Veto Counter | 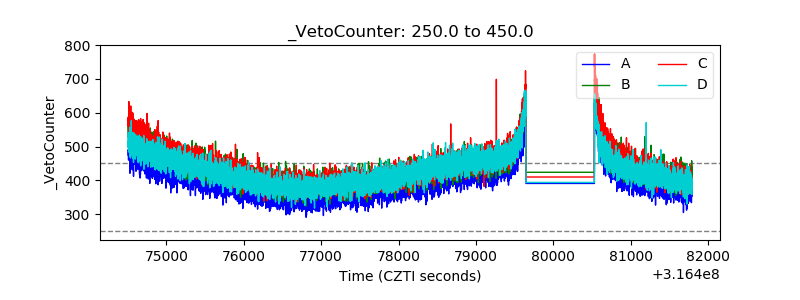 |