| Param | Original file | Final file |
|---|---|---|
| Filename | modeM0/AS1T03_175T01_9000003428_23192cztM0_level2.evt | modeM0/AS1T03_175T01_9000003428_23192cztM0_level2_quad_clean.evt |
| Size (bytes) | 557,472,960 | 102,582,720 |
| Size | 531.6 MB | 97.8 MB |
| Events in quadrant A | 3,412,600 | 662,975 |
| Events in quadrant B | 3,479,412 | 675,096 |
| Events in quadrant C | 3,872,474 | 654,823 |
| Events in quadrant D | 5,629,951 | 612,130 |
| Mode SS | |||
|---|---|---|---|
| Quadrant | BADHDUFLAG | Total packets | Discarded packets |
| A | 0 | 146 | 0 |
| B | 0 | 146 | 0 |
| C | 0 | 146 | 0 |
| D | 0 | 146 | 0 |
| Mode M9 | |||
|---|---|---|---|
| Quadrant | BADHDUFLAG | Total packets | Discarded packets |
| A | 0 | 5 | 0 |
| B | 0 | 5 | 0 |
| C | 0 | 5 | 0 |
| D | 0 | 5 | 0 |
| Mode M0 | |||
|---|---|---|---|
| Quadrant | BADHDUFLAG | Total packets | Discarded packets |
| A | 0 | 14946 | 2 |
| B | 0 | 15018 | 3 |
| C | 0 | 16093 | 2 |
| D | 0 | 21657 | 2 |
| Quadrant | Total seconds | Saturated seconds | Saturation percentage |
|---|---|---|---|
| A | 7203 | 39 | 0.541441% |
| B | 7203 | 83 | 1.152298% |
| C | 7203 | 166 | 2.304595% |
| D | 7203 | 635 | 8.815771% |
Noise dominated data is calculated using 1-second bins in cleaned event files. If a bin has >2000 counts, and if more than 50% of those come from <1% of pixels, then it is considered to be noise-dominated and hence unusable.
| Quadrant | # 1 sec bins | Bins with >0 counts | Bins with >2000 counts | High rate bins dominated by noise | Noise dominated (total time) | Noise dominated (detector-on time) | Marked lightcurve |
|---|---|---|---|---|---|---|---|
| A | 7683 | 7204 | 1 | 1 | 0.01% | 0.01% | 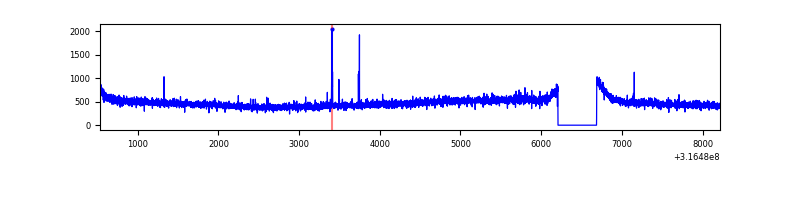 |
| B | 7683 | 7204 | 0 | 0 | 0.00% | 0.00% | 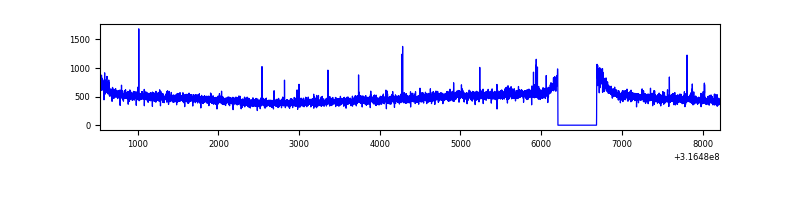 |
| C | 7683 | 7204 | 25 | 25 | 0.33% | 0.35% | 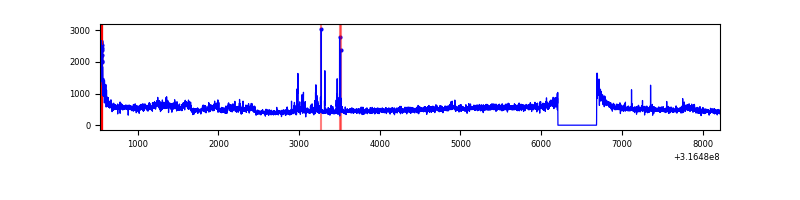 |
| D | 7683 | 7204 | 447 | 447 | 5.82% | 6.20% | 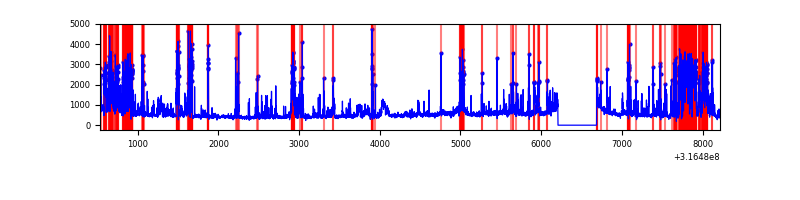 |
Top three noisy pixels from each quadrant. If the there are fewer than three noisy pixels in the level2.evt file, extra rows are filled as -1
| Pixel properties | Quadrant properties | ||||||
|---|---|---|---|---|---|---|---|
| Quadrant | DetID | PixID | Counts | Sigma | Mean | Median | Sigma |
| A | 6 | 16 | 18092 | 96.25 | 880 | 861 | 179.0 |
| A | 13 | 254 | 11793 | 61.06 | 880 | 861 | 179.0 |
| A | 3 | 137 | 8039 | 40.09 | 880 | 861 | 179.0 |
| B | 12 | 111 | 20848 | 117.45 | 882 | 858 | 170.2 |
| B | 11 | 111 | 18622 | 104.37 | 882 | 858 | 170.2 |
| B | 14 | 111 | 16425 | 91.46 | 882 | 858 | 170.2 |
| C | 0 | 10 | 344908 | 1715.72 | 850 | 856 | 200.5 |
| C | 14 | 238 | 132705 | 657.5 | 850 | 856 | 200.5 |
| C | 7 | 247 | 66337 | 326.54 | 850 | 856 | 200.5 |
| D | 1 | 52 | 1084198 | 5318.93 | 833 | 808 | 203.7 |
| D | 9 | 1 | 717412 | 3518.19 | 833 | 808 | 203.7 |
| D | 7 | 238 | 243508 | 1191.54 | 833 | 808 | 203.7 |
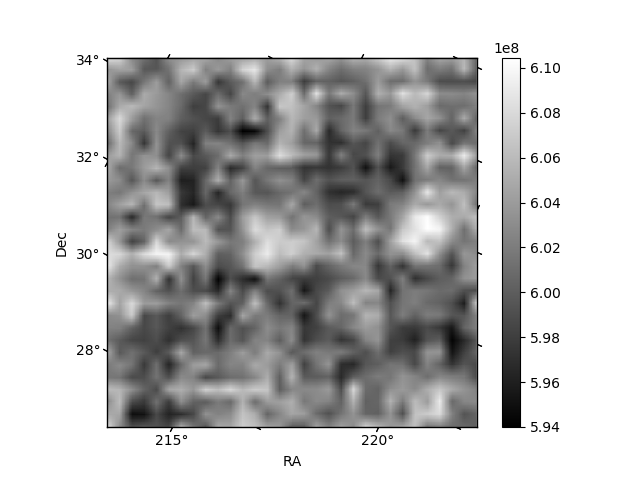
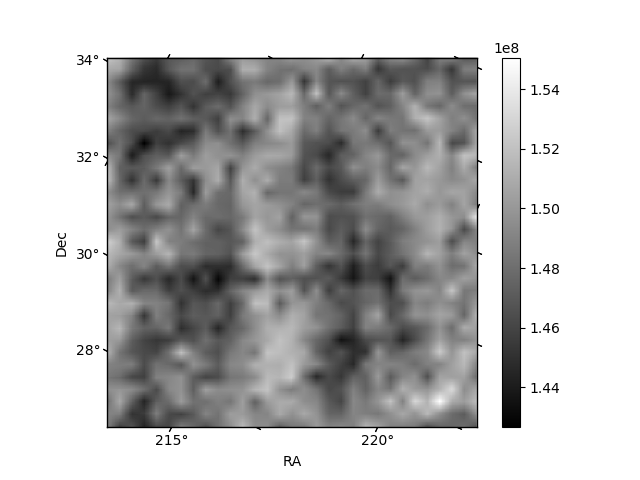
Histogram calculated using DETX and DETY for each event in the final _common_clean file
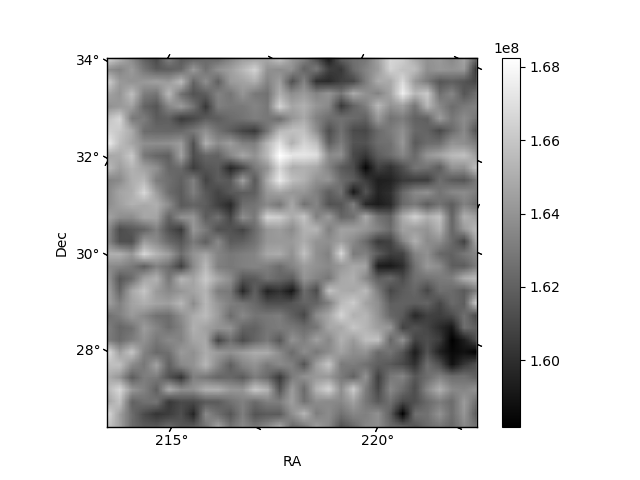
| Quadrant A | 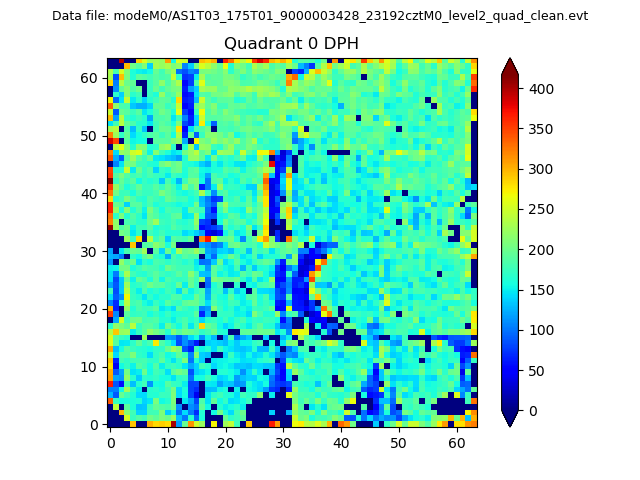 |
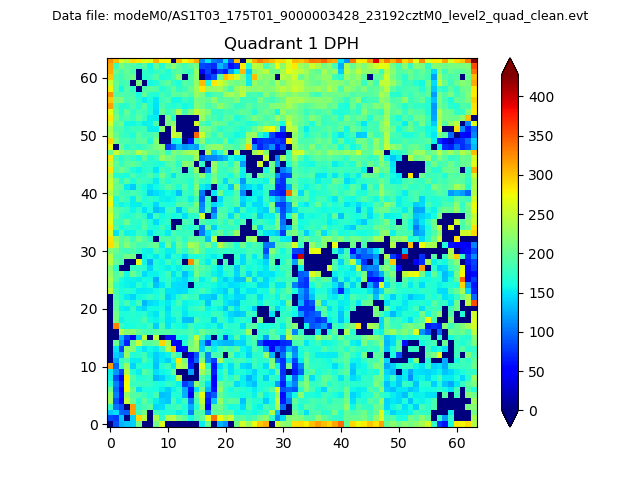 |
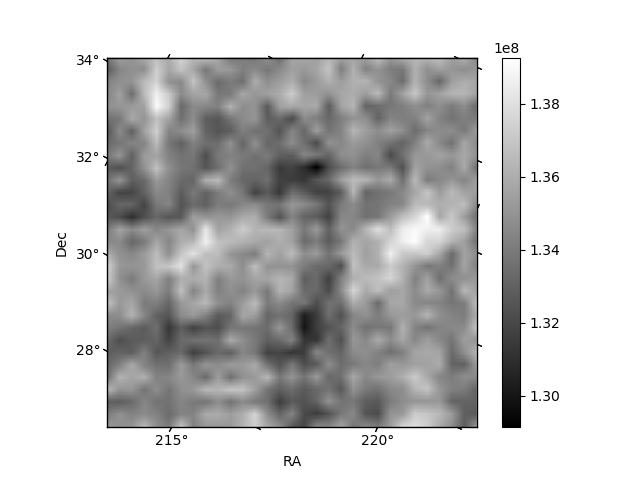
Quadrant B |
|---|---|---|---|
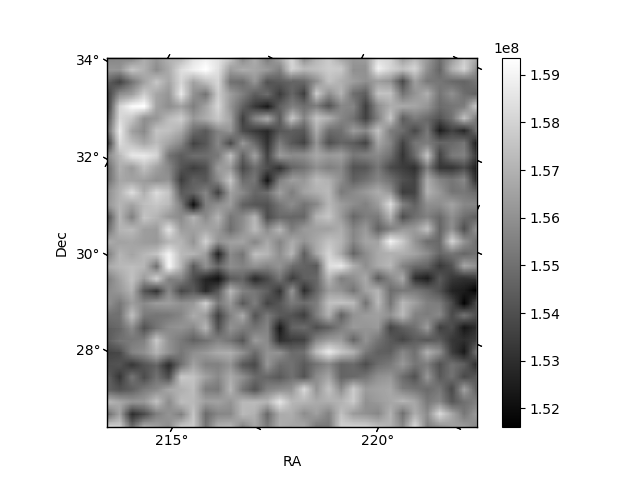
| Quadrant D |  |
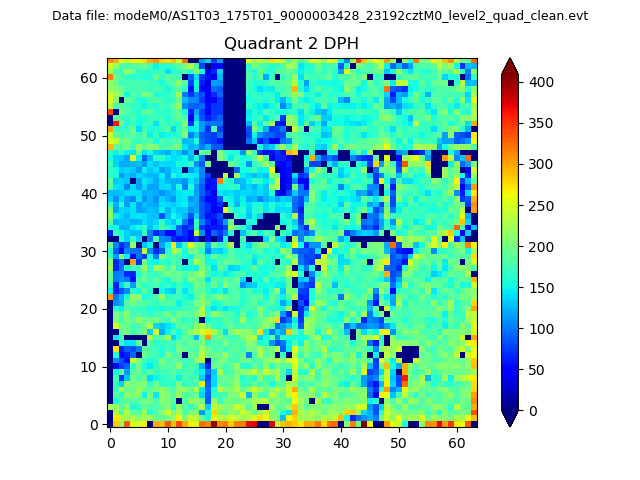 |
Quadrant C |
| Plot type | Count rate plots | Images |
|---|---|---|
| Comparison with Poisson distribution Blue bars denote a histogram of data divided into 1 sec bins. Red curve is a Poisson curve with rate = median count rate of data. |
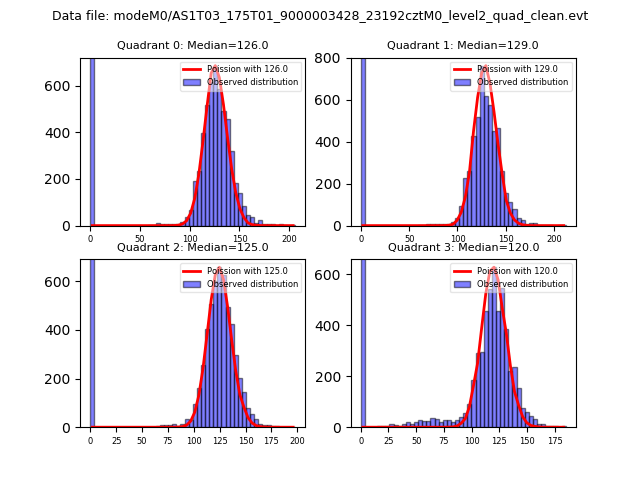 |
 |
| Quadrant-wise count rates Data is divided into 100 sec bins |
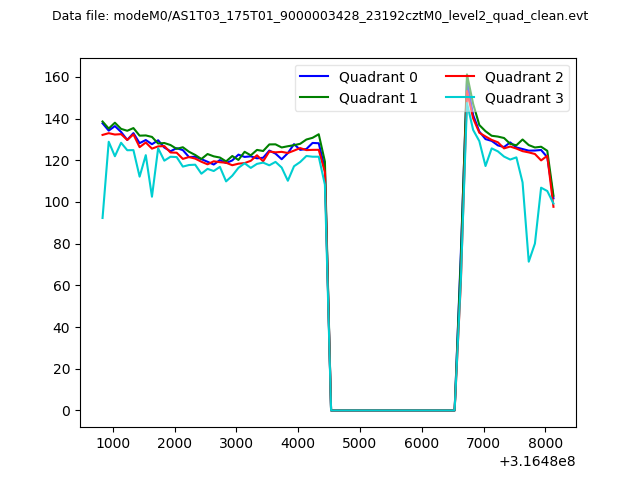 |
|
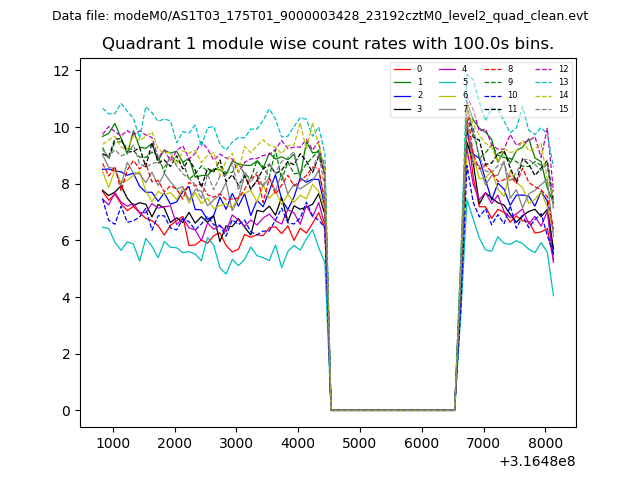
| Module-wise count rates for Quadrant A Data is divided into 100 sec bins |
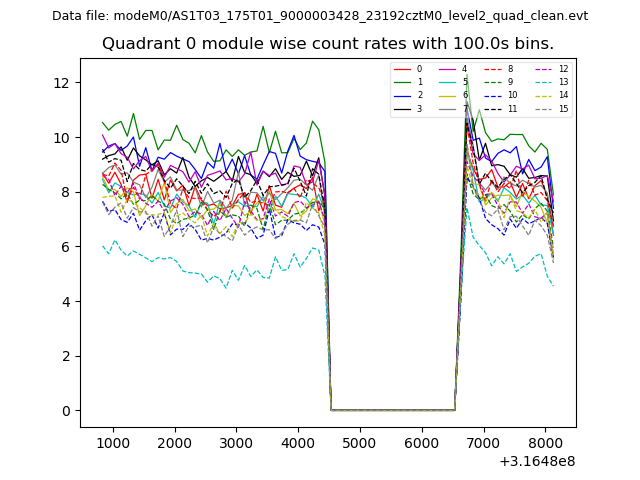 |
 |
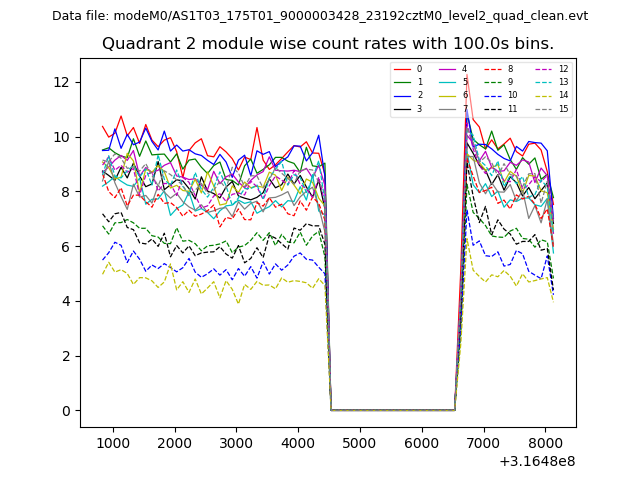
| Module-wise count rates for Quadrant B Data is divided into 100 sec bins |
 |
 |
| Module-wise count rates for Quadrant C Data is divided into 100 sec bins |
 |
 |
| Module-wise count rates for Quadrant D Data is divided into 100 sec bins |
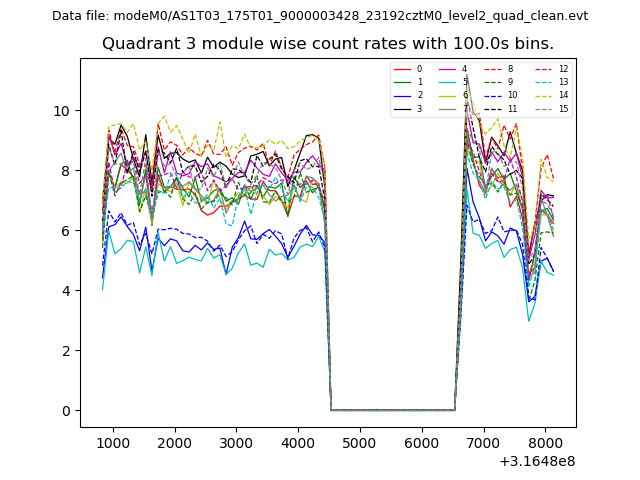 |
 |
| Parameter | Plot |
|---|---|
| CZT HV Monitor | 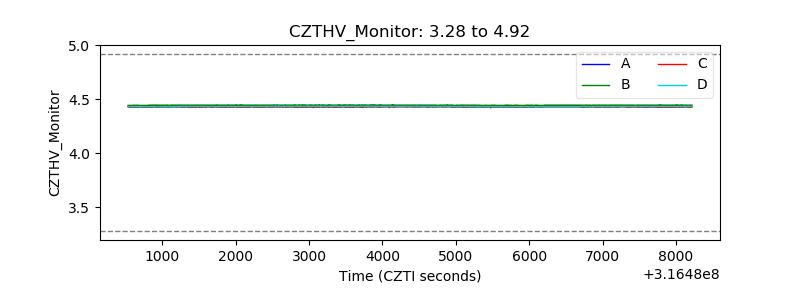 |
| D_VDD | 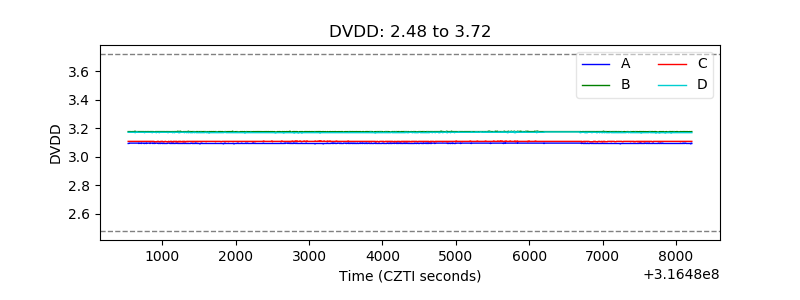 |
| Temperature 1 | 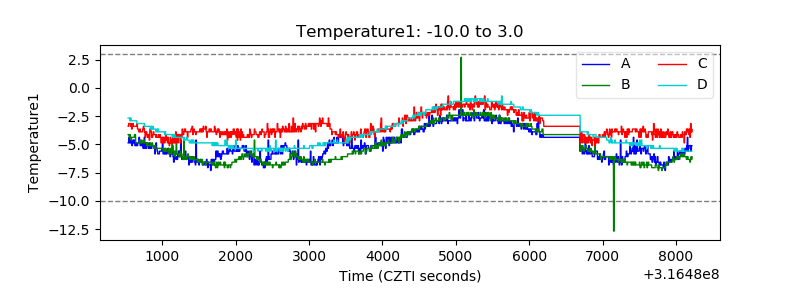 |
| Veto HV Monitor |  |
| Veto LLD | 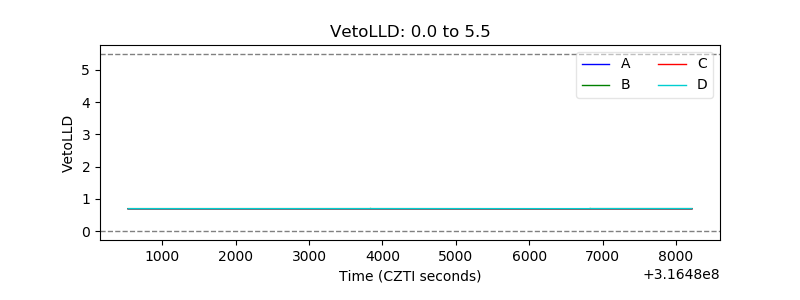 |
| Alpha Counter | 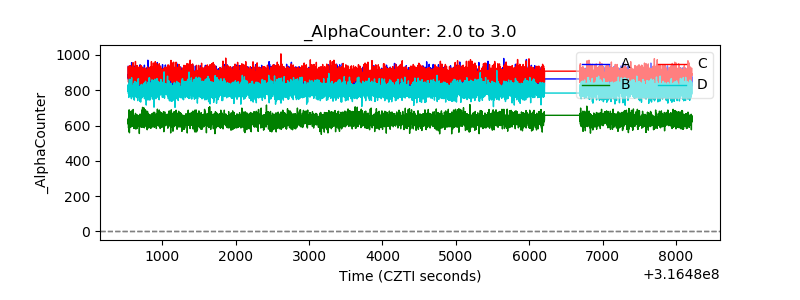 |
| _CPM_Rate |  |
| CZT Counter | 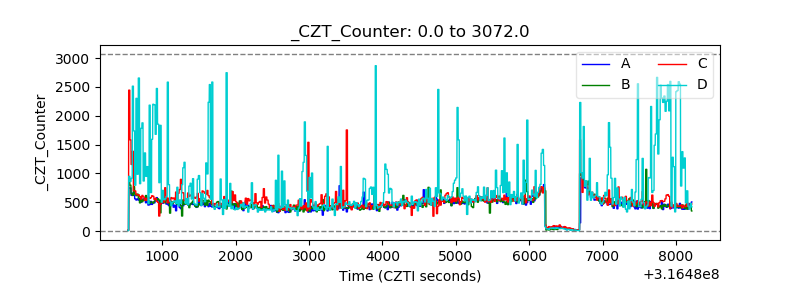 |
| +2.5 Volts monitor | 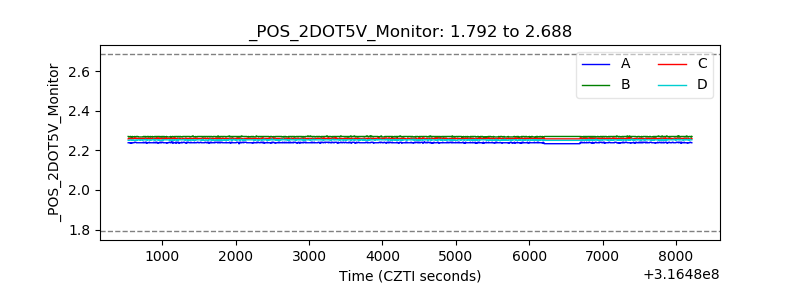 |
| +5 Volts monitor | 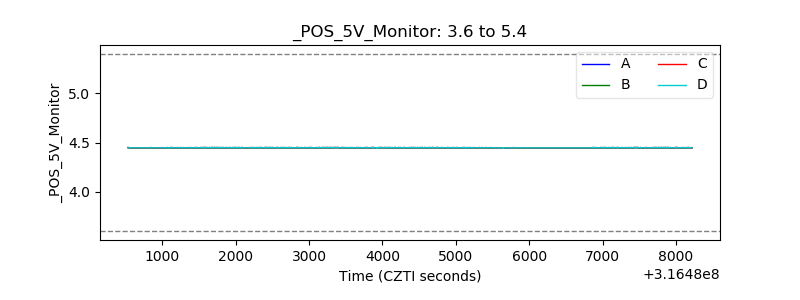 |
| _ROLL_ROT | 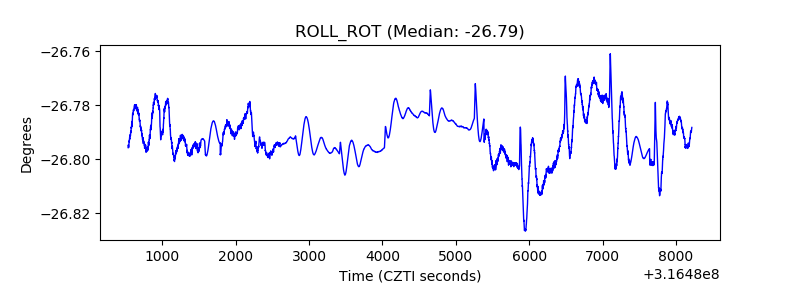 |
| _Roll_DEC | 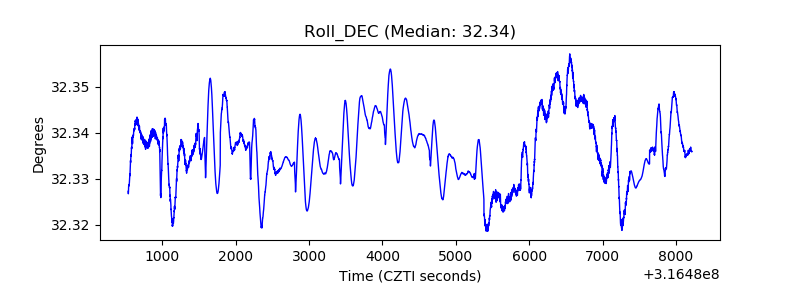 |
| _Roll_RA | 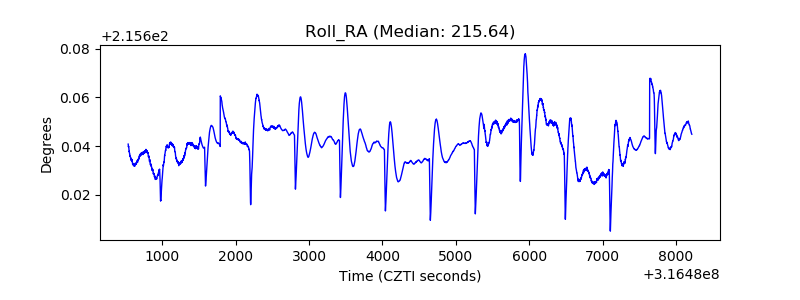 |
| Veto Counter | 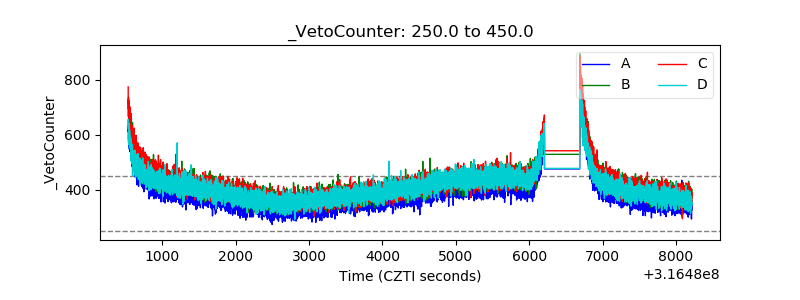 |