| Param | Original file | Final file |
|---|---|---|
| Filename | modeM0/AS1T03_175T01_9000003428_23194cztM0_level2.evt | modeM0/AS1T03_175T01_9000003428_23194cztM0_level2_quad_clean.evt |
| Size (bytes) | 517,893,120 | 109,546,560 |
| Size | 493.9 MB | 104.5 MB |
| Events in quadrant A | 3,682,036 | 699,659 |
| Events in quadrant B | 3,745,972 | 714,595 |
| Events in quadrant C | 3,877,267 | 690,648 |
| Events in quadrant D | 3,850,621 | 671,622 |
| Mode SS | |||
|---|---|---|---|
| Quadrant | BADHDUFLAG | Total packets | Discarded packets |
| A | 0 | 158 | 0 |
| B | 0 | 158 | 0 |
| C | 0 | 158 | 0 |
| D | 0 | 158 | 0 |
| Mode M9 | |||
|---|---|---|---|
| Quadrant | BADHDUFLAG | Total packets | Discarded packets |
| A | 0 | 6 | 0 |
| B | 0 | 6 | 0 |
| C | 0 | 6 | 0 |
| D | 0 | 6 | 0 |
| Mode M0 | |||
|---|---|---|---|
| Quadrant | BADHDUFLAG | Total packets | Discarded packets |
| A | 0 | 16282 | 2 |
| B | 0 | 16376 | 3 |
| C | 0 | 16692 | 2 |
| D | 0 | 17056 | 2 |
| Quadrant | Total seconds | Saturated seconds | Saturation percentage |
|---|---|---|---|
| A | 7784 | 142 | 1.824255% |
| B | 7783 | 217 | 2.788128% |
| C | 7783 | 252 | 3.237826% |
| D | 7783 | 203 | 2.608249% |
Noise dominated data is calculated using 1-second bins in cleaned event files. If a bin has >2000 counts, and if more than 50% of those come from <1% of pixels, then it is considered to be noise-dominated and hence unusable.
| Quadrant | # 1 sec bins | Bins with >0 counts | Bins with >2000 counts | High rate bins dominated by noise | Noise dominated (total time) | Noise dominated (detector-on time) | Marked lightcurve |
|---|---|---|---|---|---|---|---|
| A | 8279 | 7786 | 0 | 0 | 0.00% | 0.00% | 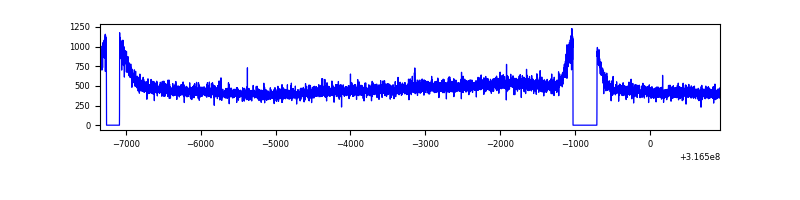 |
| B | 8278 | 7785 | 0 | 0 | 0.00% | 0.00% | 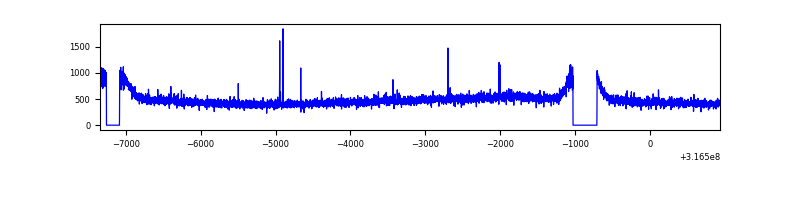 |
| C | 8278 | 7785 | 2 | 2 | 0.02% | 0.03% | 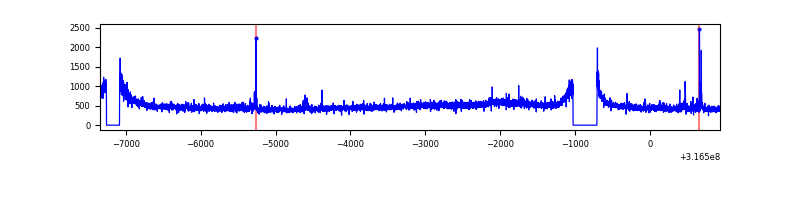 |
| D | 8278 | 7785 | 44 | 44 | 0.53% | 0.57% | 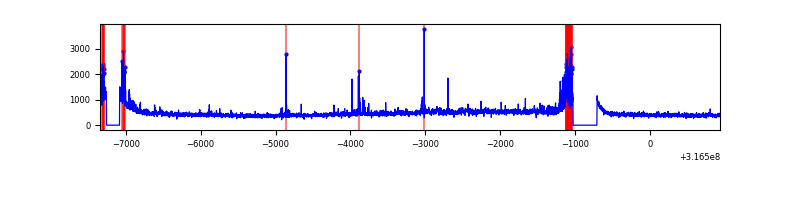 |
Top three noisy pixels from each quadrant. If the there are fewer than three noisy pixels in the level2.evt file, extra rows are filled as -1
| Pixel properties | Quadrant properties | ||||||
|---|---|---|---|---|---|---|---|
| Quadrant | DetID | PixID | Counts | Sigma | Mean | Median | Sigma |
| A | 13 | 254 | 11082 | 52.47 | 953 | 932 | 193.5 |
| A | 3 | 137 | 8881 | 41.09 | 953 | 932 | 193.5 |
| A | 0 | 226 | 8225 | 37.7 | 953 | 932 | 193.5 |
| B | 12 | 111 | 23625 | 121.61 | 951 | 924 | 186.7 |
| B | 11 | 111 | 20734 | 106.12 | 951 | 924 | 186.7 |
| B | 14 | 111 | 18721 | 95.34 | 951 | 924 | 186.7 |
| C | 14 | 238 | 142248 | 654.7 | 915 | 921 | 215.9 |
| C | 7 | 247 | 95198 | 436.74 | 915 | 921 | 215.9 |
| C | 0 | 10 | 56775 | 258.75 | 915 | 921 | 215.9 |
| D | 13 | 153 | 114282 | 502.5 | 914 | 887 | 225.7 |
| D | 12 | 2 | 95228 | 418.06 | 914 | 887 | 225.7 |
| D | 1 | 52 | 86423 | 379.04 | 914 | 887 | 225.7 |
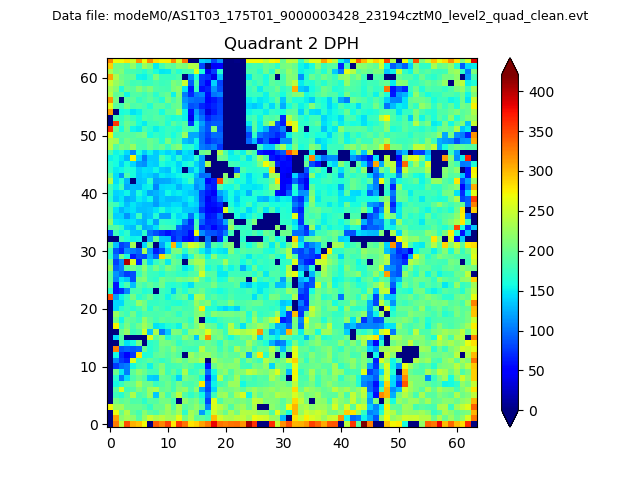
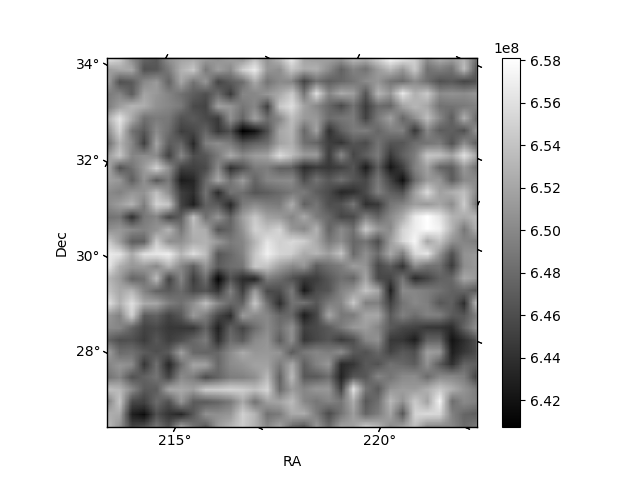
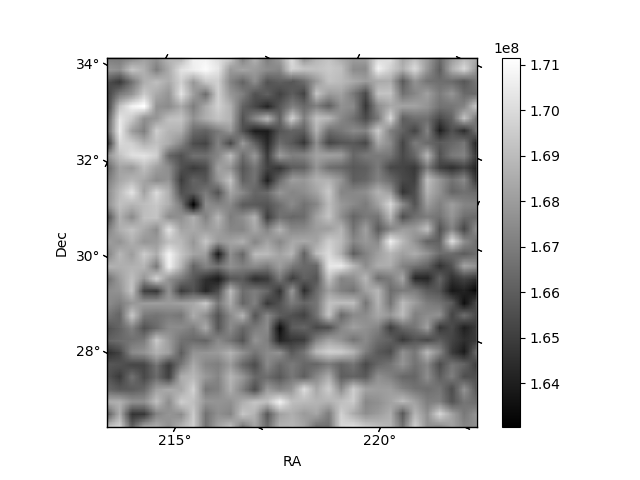
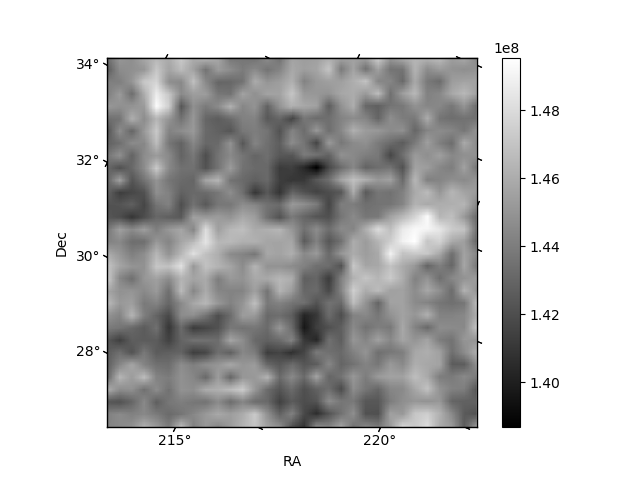
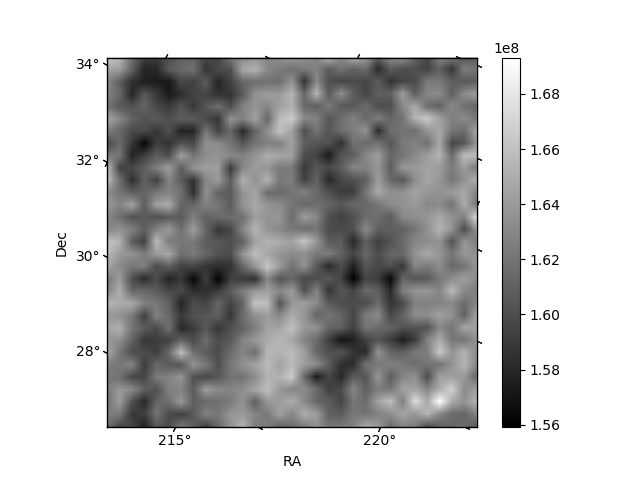
Histogram calculated using DETX and DETY for each event in the final _common_clean file
| Quadrant A | 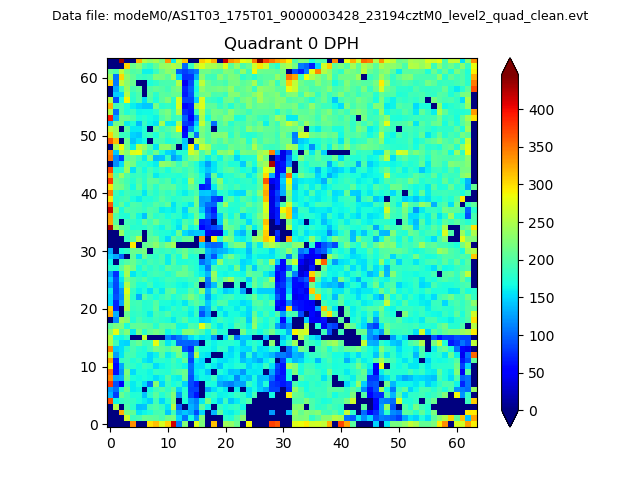 |
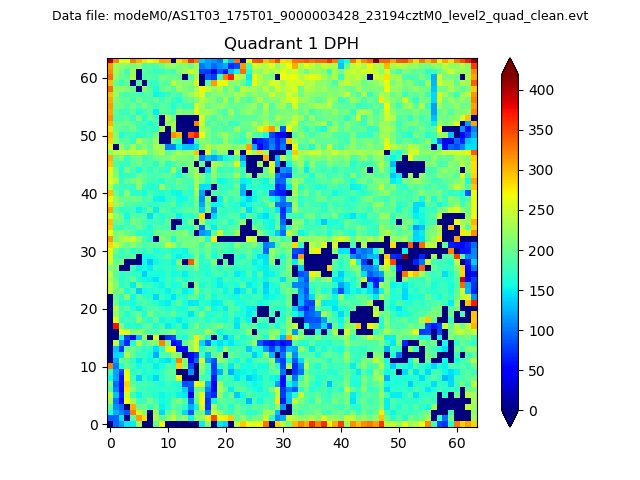 |
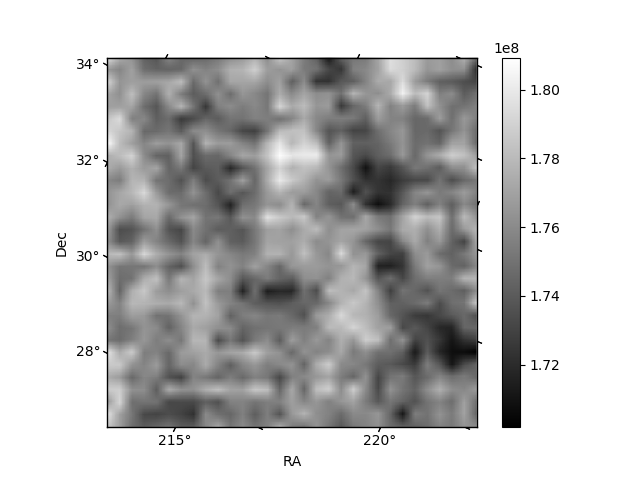
Quadrant B |
|---|---|---|---|
| Quadrant D | 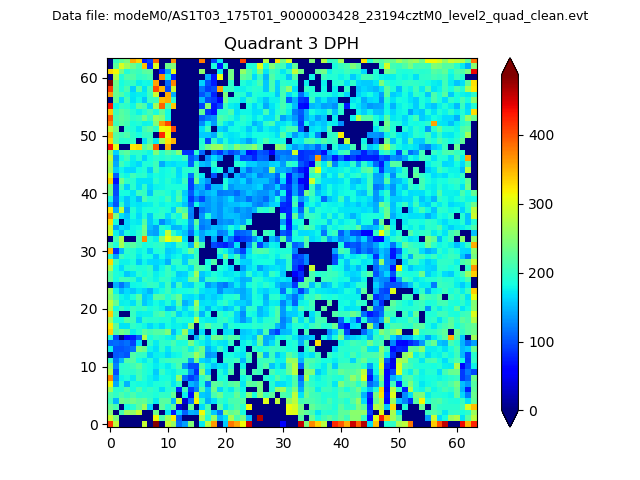 |
 |
Quadrant C |
| Plot type | Count rate plots | Images |
|---|---|---|
| Comparison with Poisson distribution Blue bars denote a histogram of data divided into 1 sec bins. Red curve is a Poisson curve with rate = median count rate of data. |
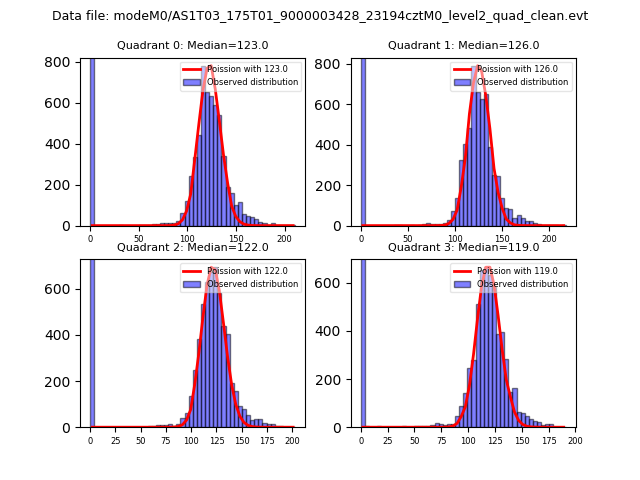 |
 |
| Quadrant-wise count rates Data is divided into 100 sec bins |
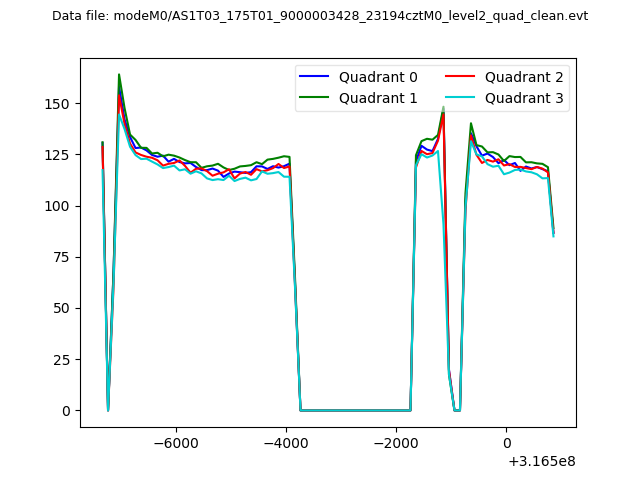 |
|
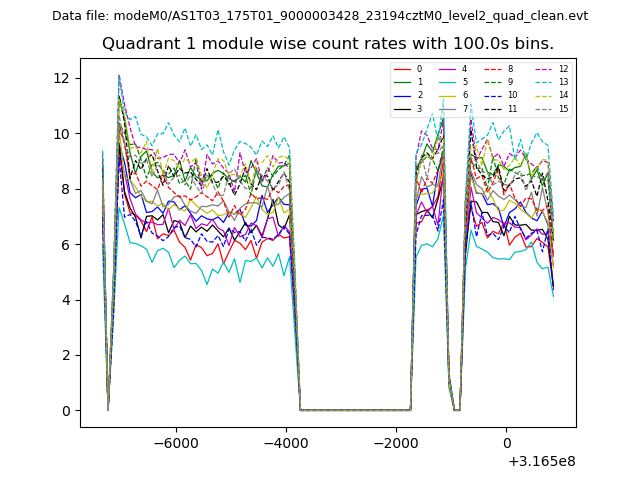
| Module-wise count rates for Quadrant A Data is divided into 100 sec bins |
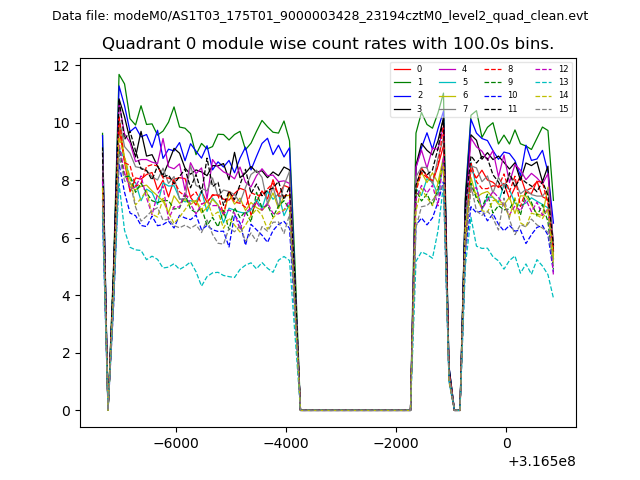 |
 |
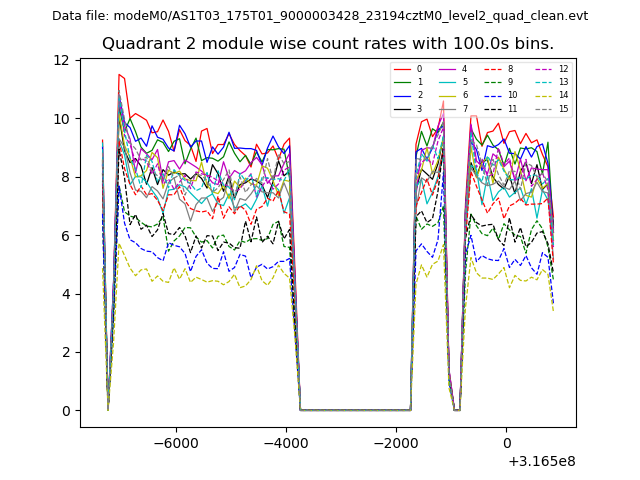
| Module-wise count rates for Quadrant B Data is divided into 100 sec bins |
 |
 |
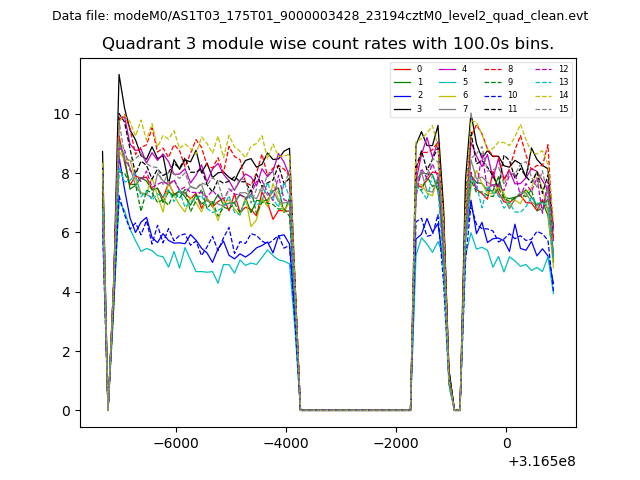
| Module-wise count rates for Quadrant C Data is divided into 100 sec bins |
 |
 |
| Module-wise count rates for Quadrant D Data is divided into 100 sec bins |
 |
 |
| Parameter | Plot |
|---|---|
| CZT HV Monitor | 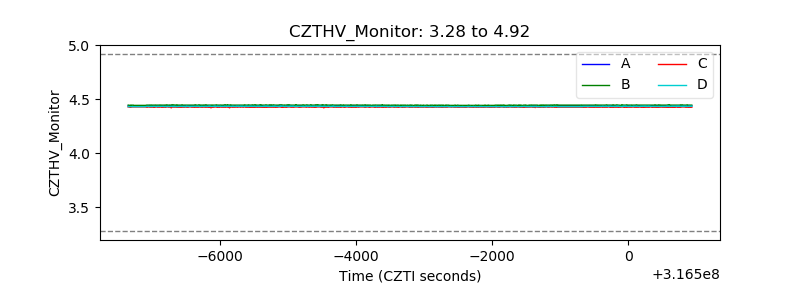 |
| D_VDD | 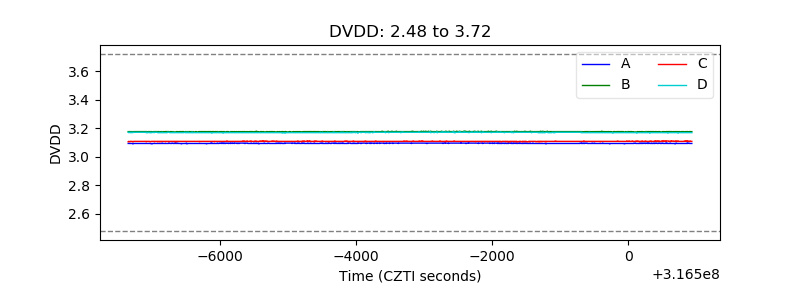 |
| Temperature 1 | 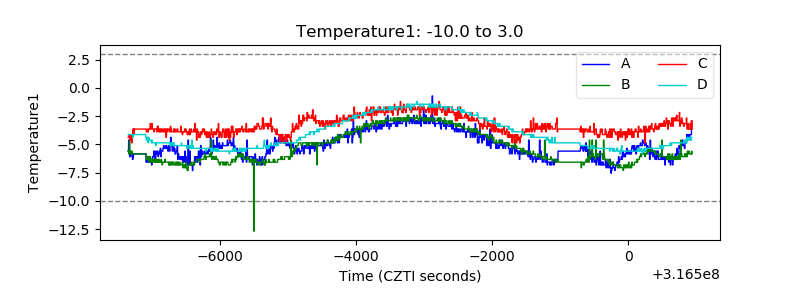 |
| Veto HV Monitor | 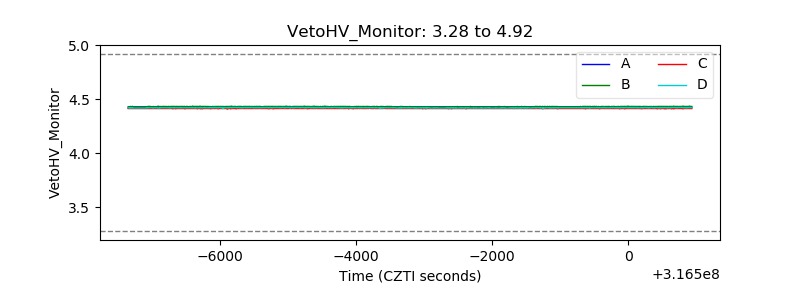 |
| Veto LLD | 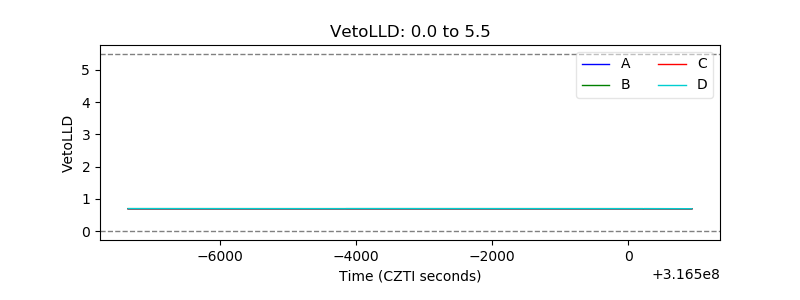 |
| Alpha Counter | 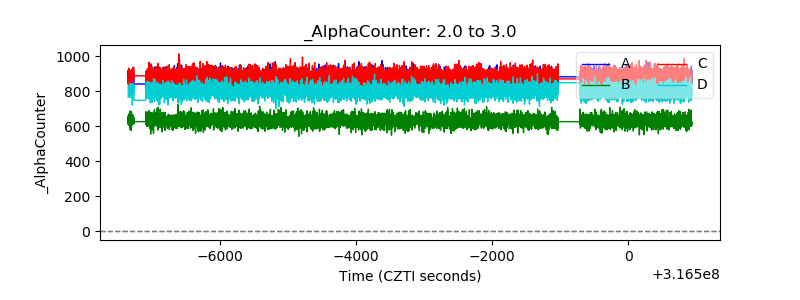 |
| _CPM_Rate | 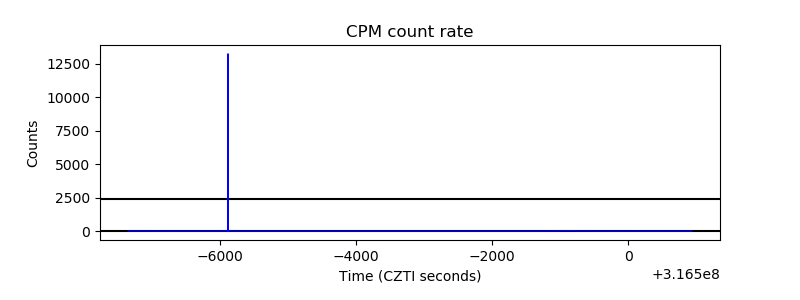 |
| CZT Counter | 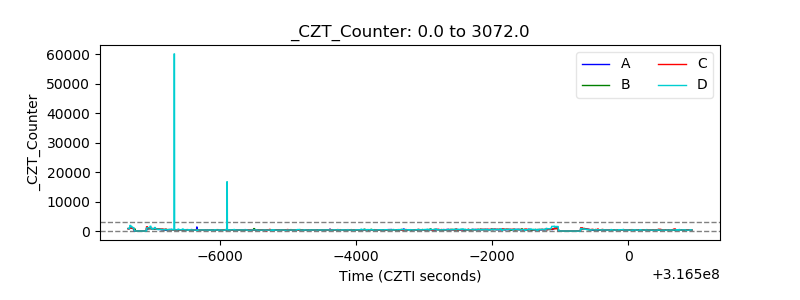 |
| +2.5 Volts monitor | 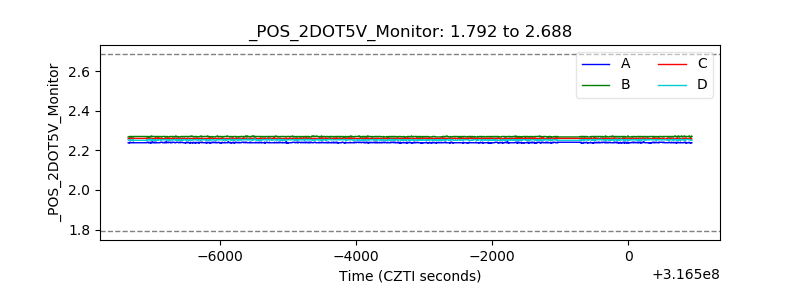 |
| +5 Volts monitor |  |
| _ROLL_ROT | 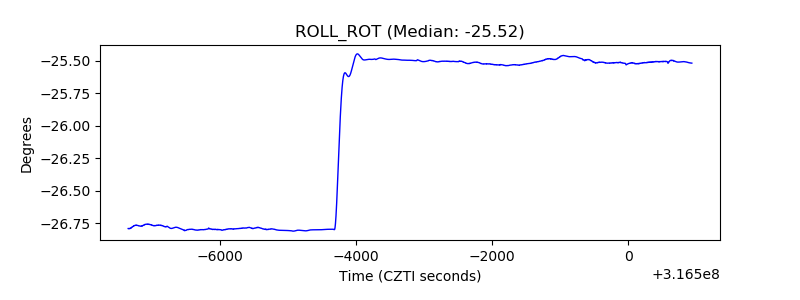 |
| _Roll_DEC | 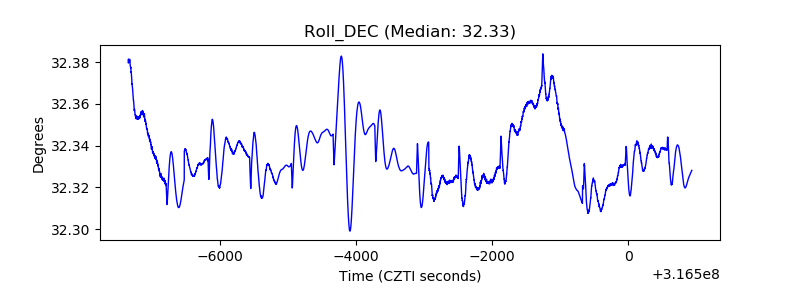 |
| _Roll_RA | 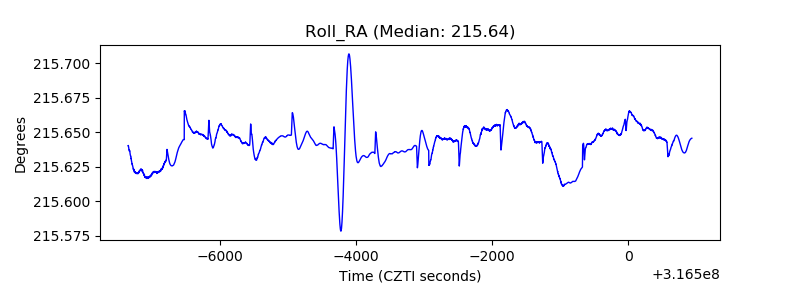 |
| Veto Counter | 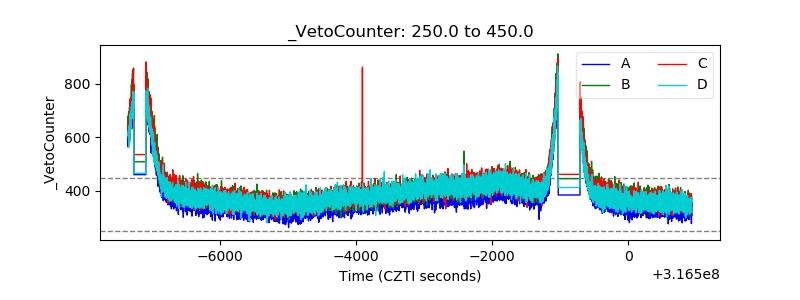 |