| Param | Original file | Final file |
|---|---|---|
| Filename | modeM0/AS1T03_175T01_9000003428_23196cztM0_level2.evt | modeM0/AS1T03_175T01_9000003428_23196cztM0_level2_quad_clean.evt |
| Size (bytes) | 879,258,240 | 168,906,240 |
| Size | 838.5 MB | 161.1 MB |
| Events in quadrant A | 5,914,476 | 1,061,991 |
| Events in quadrant B | 6,002,338 | 1,086,981 |
| Events in quadrant C | 6,517,250 | 1,047,540 |
| Events in quadrant D | 7,319,930 | 1,026,743 |
| Mode SS | |||
|---|---|---|---|
| Quadrant | BADHDUFLAG | Total packets | Discarded packets |
| A | 0 | 262 | 0 |
| B | 0 | 262 | 0 |
| C | 0 | 262 | 0 |
| D | 0 | 262 | 0 |
| Mode M9 | |||
|---|---|---|---|
| Quadrant | BADHDUFLAG | Total packets | Discarded packets |
| A | 0 | 12 | 0 |
| B | 0 | 12 | 0 |
| C | 0 | 12 | 0 |
| D | 0 | 12 | 0 |
| Mode M0 | |||
|---|---|---|---|
| Quadrant | BADHDUFLAG | Total packets | Discarded packets |
| A | 0 | 26222 | 2 |
| B | 0 | 26305 | 2 |
| C | 0 | 27473 | 3 |
| D | 0 | 30981 | 2 |
| Quadrant | Total seconds | Saturated seconds | Saturation percentage |
|---|---|---|---|
| A | 12913 | 86 | 0.665996% |
| B | 12913 | 118 | 0.913808% |
| C | 12913 | 195 | 1.510106% |
| D | 12913 | 328 | 2.540076% |
Noise dominated data is calculated using 1-second bins in cleaned event files. If a bin has >2000 counts, and if more than 50% of those come from <1% of pixels, then it is considered to be noise-dominated and hence unusable.
| Quadrant | # 1 sec bins | Bins with >0 counts | Bins with >2000 counts | High rate bins dominated by noise | Noise dominated (total time) | Noise dominated (detector-on time) | Marked lightcurve |
|---|---|---|---|---|---|---|---|
| A | 14063 | 12914 | 0 | 0 | 0.00% | 0.00% | 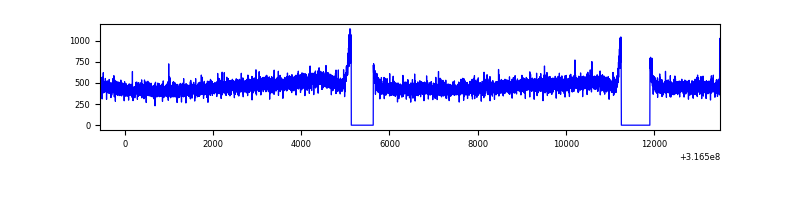 |
| B | 14063 | 12915 | 2 | 2 | 0.01% | 0.02% | 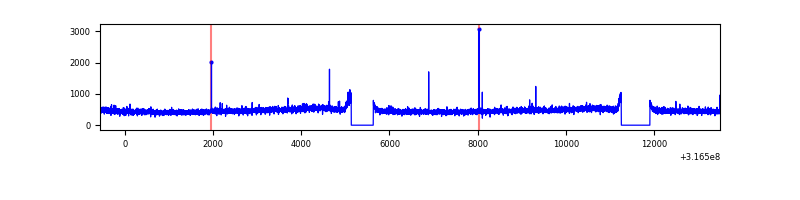 |
| C | 14063 | 12915 | 14 | 14 | 0.10% | 0.11% | 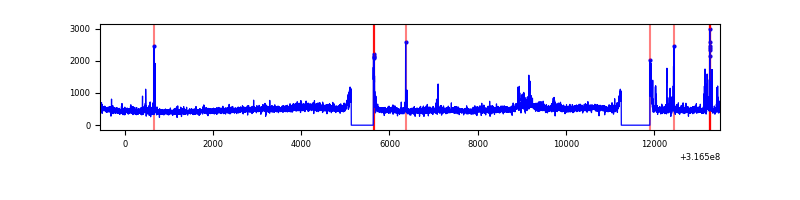 |
| D | 14063 | 12915 | 202 | 202 | 1.44% | 1.56% | 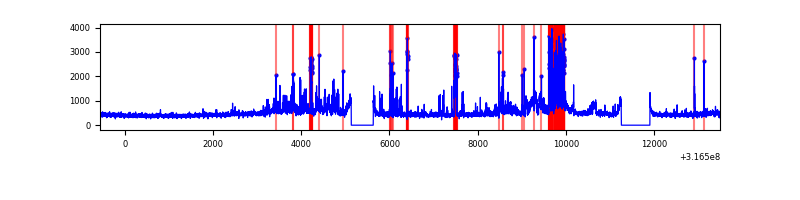 |
Top three noisy pixels from each quadrant. If the there are fewer than three noisy pixels in the level2.evt file, extra rows are filled as -1
| Pixel properties | Quadrant properties | ||||||
|---|---|---|---|---|---|---|---|
| Quadrant | DetID | PixID | Counts | Sigma | Mean | Median | Sigma |
| A | 13 | 254 | 18361 | 54.4 | 1533 | 1496 | 310.0 |
| A | 3 | 137 | 13992 | 40.31 | 1533 | 1496 | 310.0 |
| A | 0 | 226 | 13116 | 37.48 | 1533 | 1496 | 310.0 |
| B | 12 | 111 | 37121 | 122.07 | 1526 | 1484 | 291.9 |
| B | 11 | 111 | 33025 | 108.04 | 1526 | 1484 | 291.9 |
| B | 14 | 111 | 29546 | 96.12 | 1526 | 1484 | 291.9 |
| C | 0 | 10 | 267745 | 773.82 | 1468 | 1477 | 344.1 |
| C | 7 | 247 | 264560 | 764.56 | 1468 | 1477 | 344.1 |
| C | 14 | 238 | 230472 | 665.5 | 1468 | 1477 | 344.1 |
| D | 1 | 52 | 1277568 | 3494.39 | 1483 | 1441 | 365.2 |
| D | 13 | 153 | 284704 | 775.65 | 1483 | 1441 | 365.2 |
| D | 7 | 238 | 111487 | 301.34 | 1483 | 1441 | 365.2 |
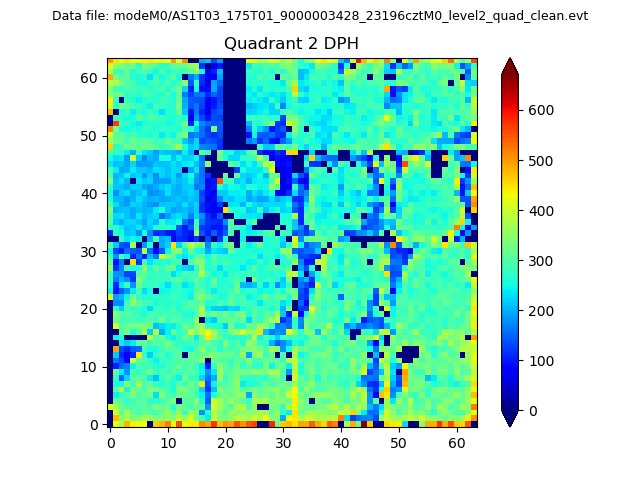
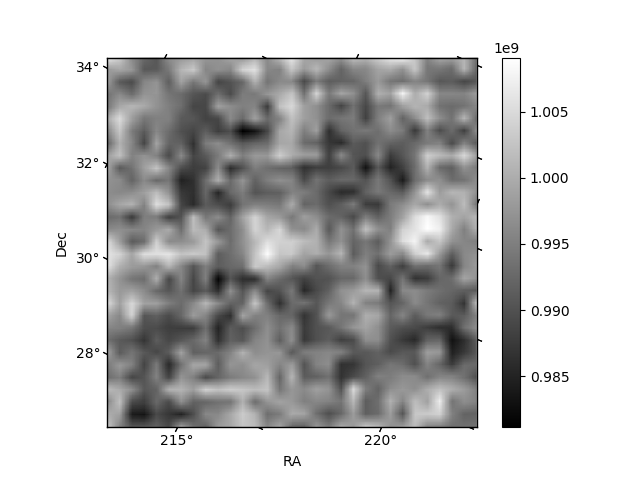
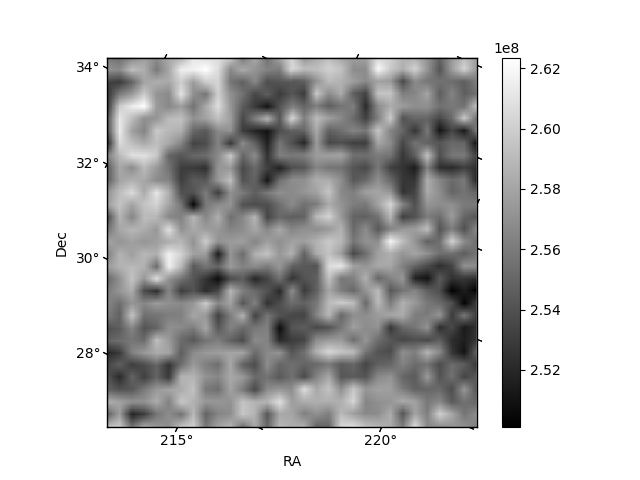
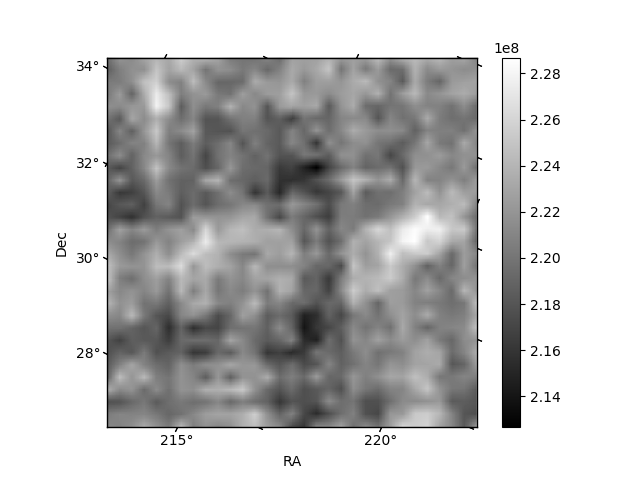
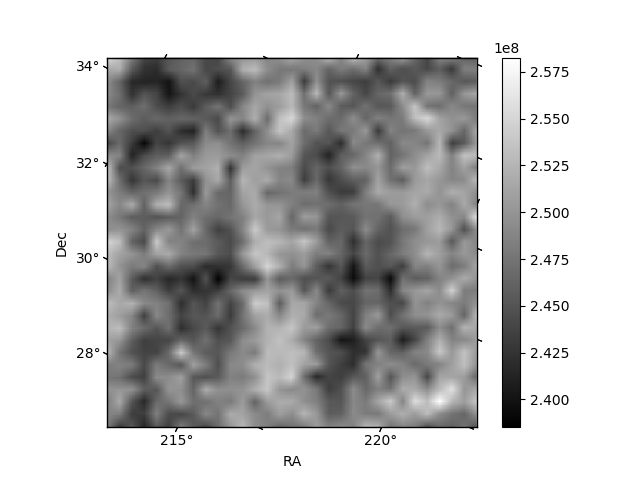
Histogram calculated using DETX and DETY for each event in the final _common_clean file
| Quadrant A | 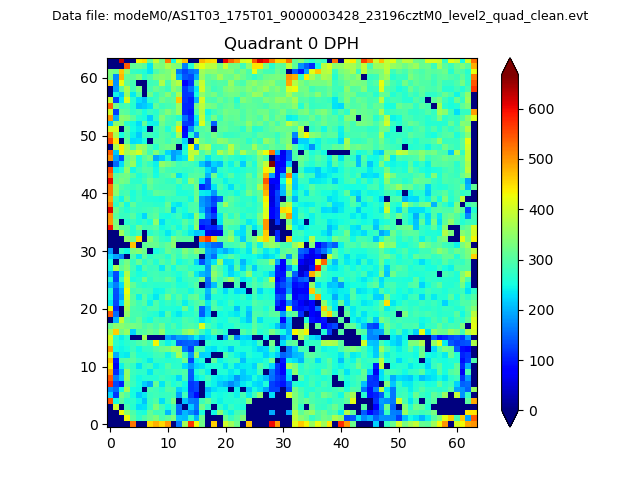 |
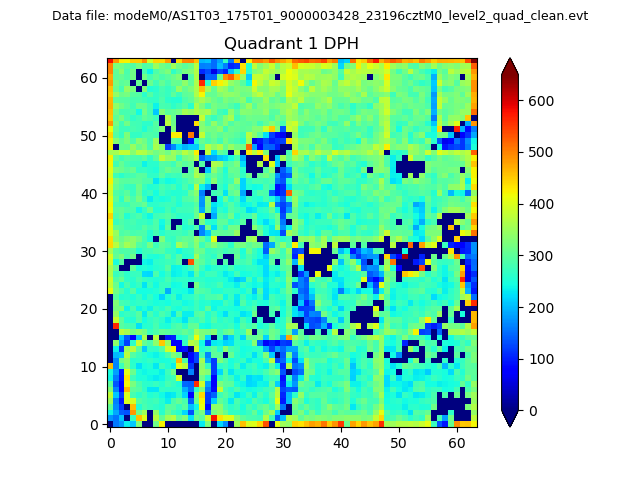 |
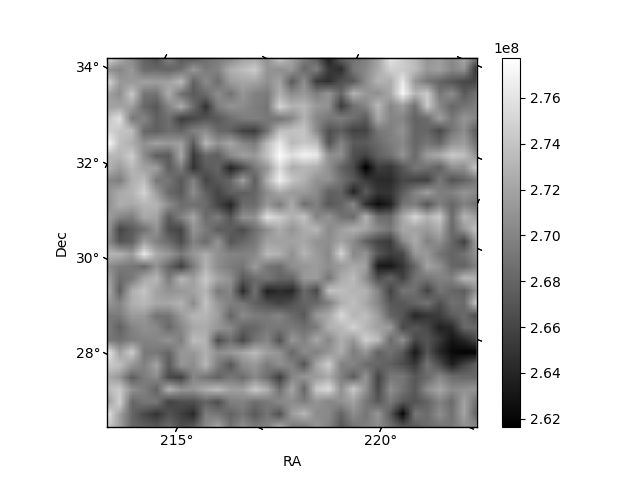
Quadrant B |
|---|---|---|---|
| Quadrant D | 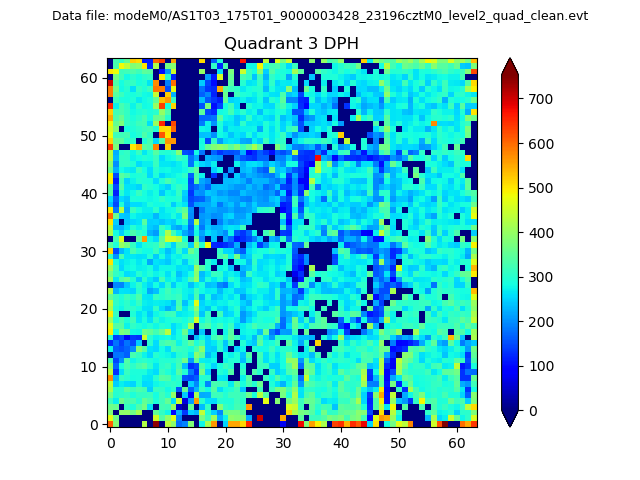 |
 |
Quadrant C |
| Plot type | Count rate plots | Images |
|---|---|---|
| Comparison with Poisson distribution Blue bars denote a histogram of data divided into 1 sec bins. Red curve is a Poisson curve with rate = median count rate of data. |
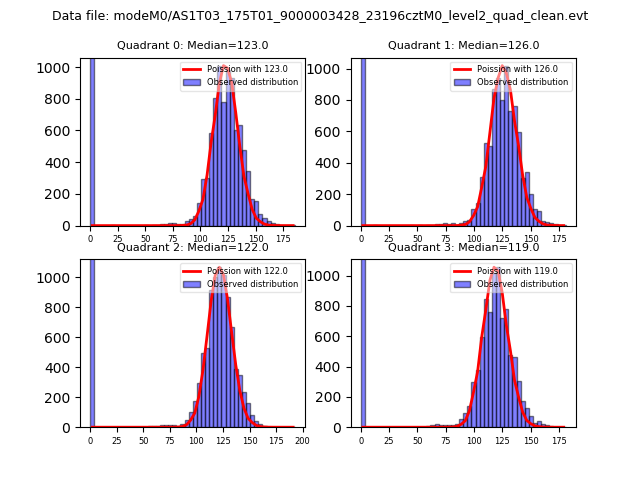 |
 |
| Quadrant-wise count rates Data is divided into 100 sec bins |
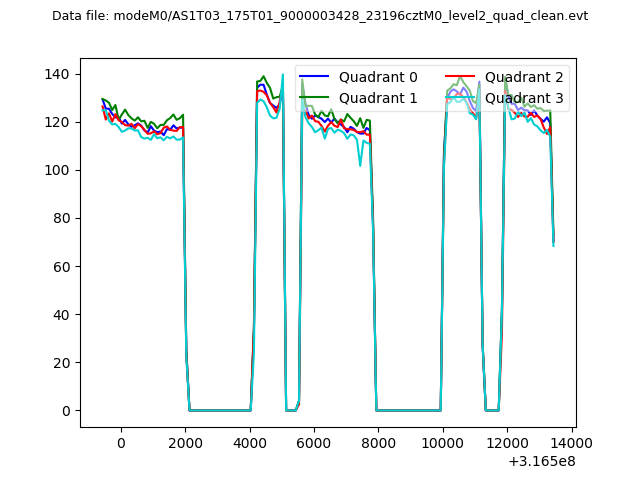 |
|
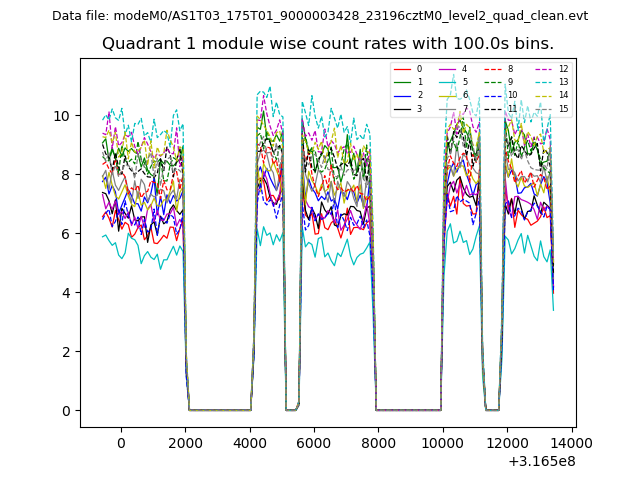
| Module-wise count rates for Quadrant A Data is divided into 100 sec bins |
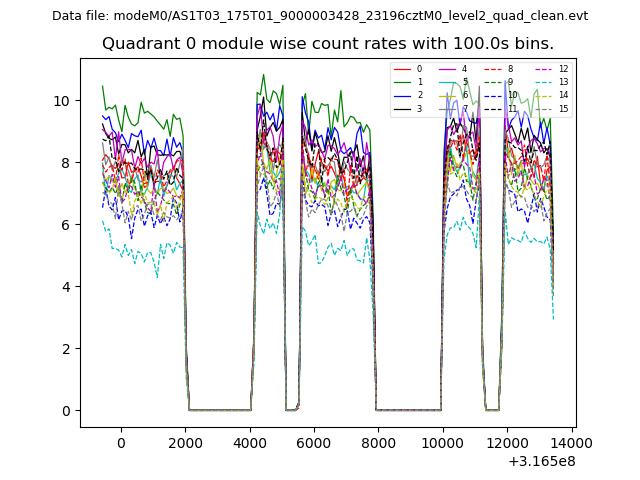 |
 |
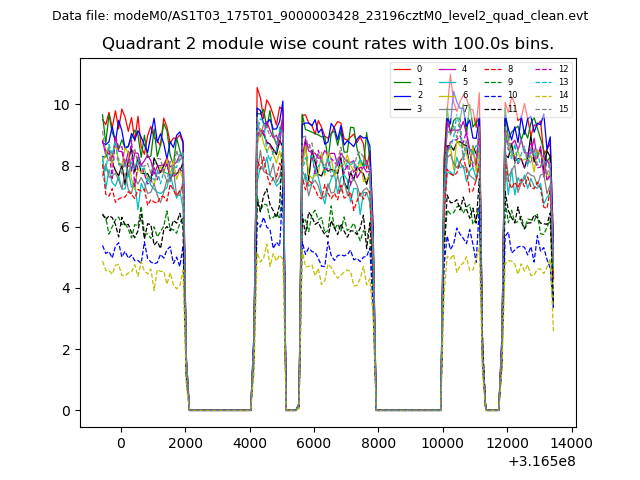
| Module-wise count rates for Quadrant B Data is divided into 100 sec bins |
 |
 |
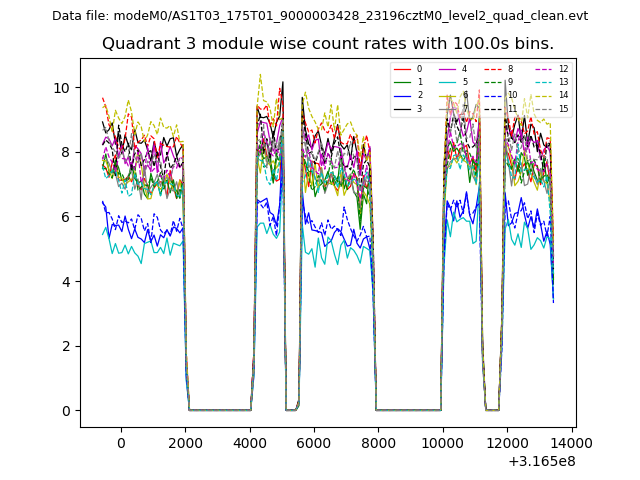
| Module-wise count rates for Quadrant C Data is divided into 100 sec bins |
 |
 |
| Module-wise count rates for Quadrant D Data is divided into 100 sec bins |
 |
 |
| Parameter | Plot |
|---|---|
| CZT HV Monitor | 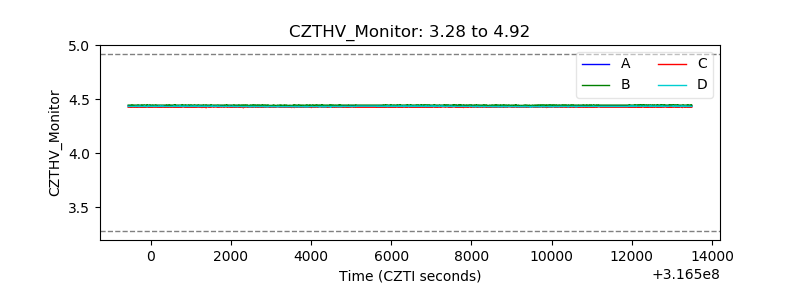 |
| D_VDD | 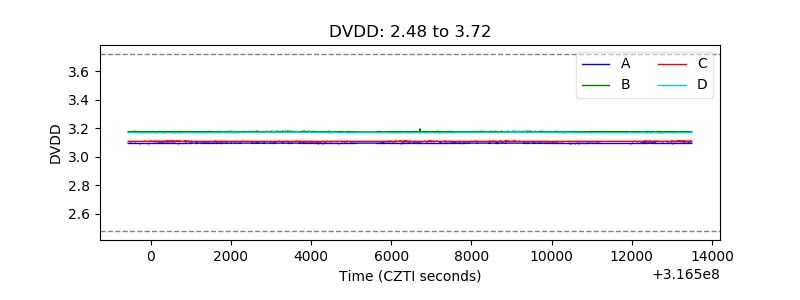 |
| Temperature 1 | 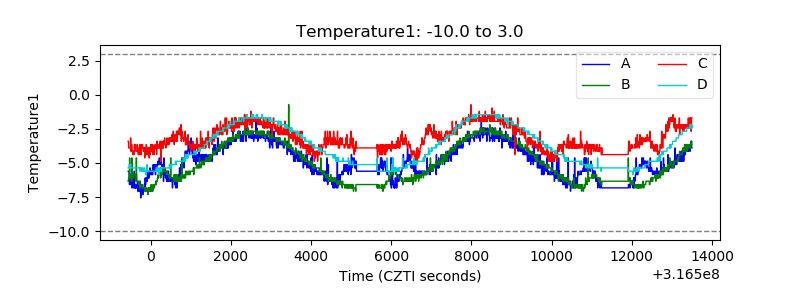 |
| Veto HV Monitor |  |
| Veto LLD |  |
| Alpha Counter | 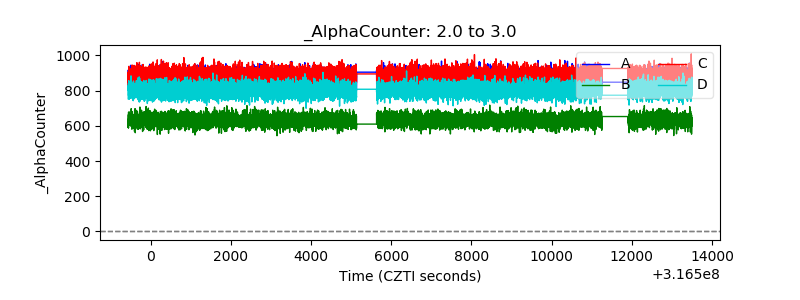 |
| _CPM_Rate | 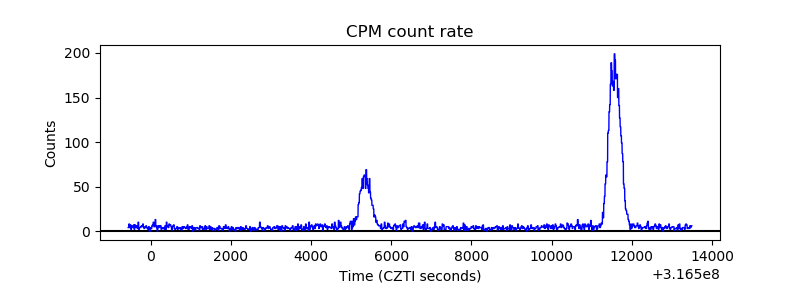 |
| CZT Counter | 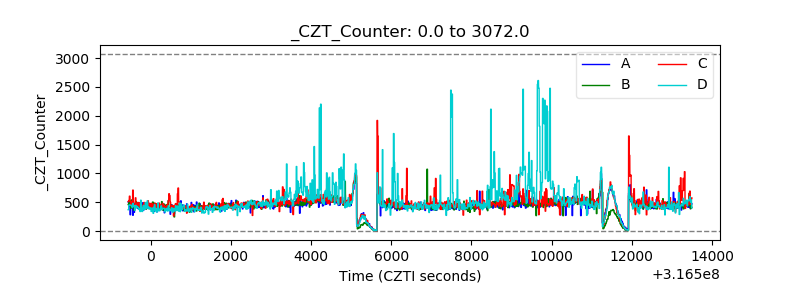 |
| +2.5 Volts monitor |  |
| +5 Volts monitor |  |
| _ROLL_ROT | 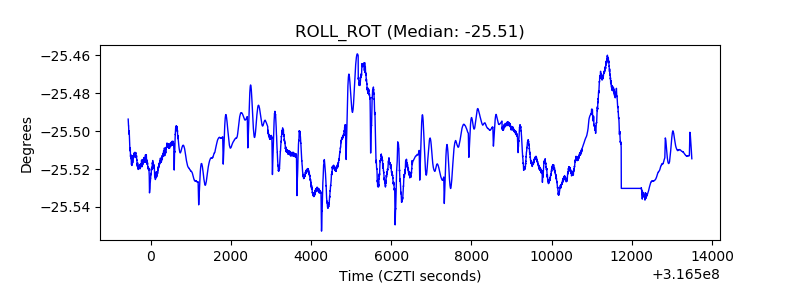 |
| _Roll_DEC | 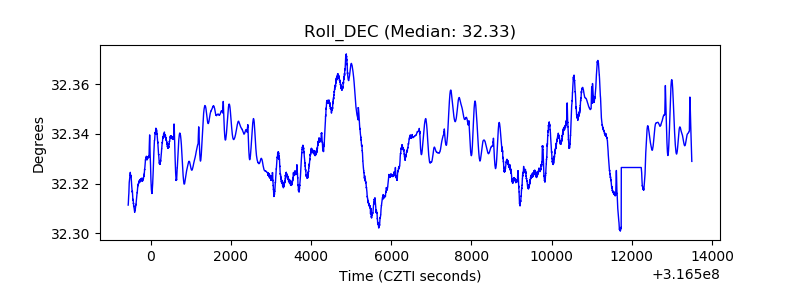 |
| _Roll_RA | 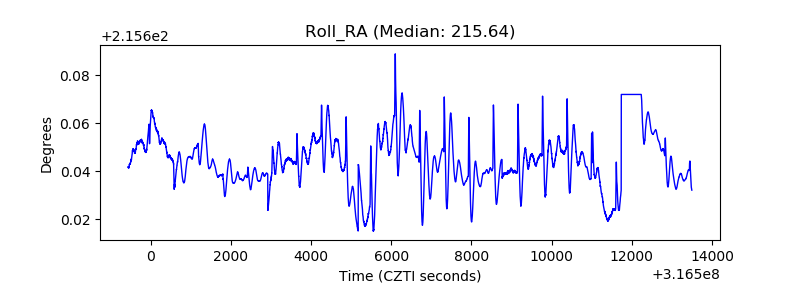 |
| Veto Counter | 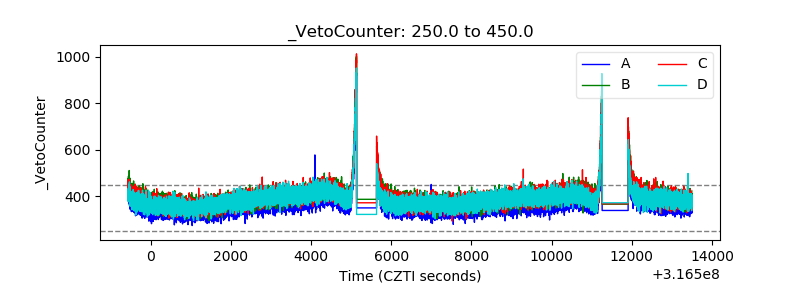 |