| Param | Original file | Final file |
|---|---|---|
| Filename | modeM0/AS1T03_175T01_9000003428_23197cztM0_level2.evt | modeM0/AS1T03_175T01_9000003428_23197cztM0_level2_quad_clean.evt |
| Size (bytes) | 2,032,755,840 | 364,878,720 |
| Size | 1.9 GB | 348.0 MB |
| Events in quadrant A | 13,664,992 | 2,276,983 |
| Events in quadrant B | 13,864,510 | 2,328,984 |
| Events in quadrant C | 14,852,980 | 2,243,585 |
| Events in quadrant D | 17,204,104 | 2,191,347 |
| Mode SS | |||
|---|---|---|---|
| Quadrant | BADHDUFLAG | Total packets | Discarded packets |
| A | 0 | 592 | 0 |
| B | 0 | 592 | 0 |
| C | 0 | 592 | 0 |
| D | 0 | 592 | 0 |
| Mode M9 | |||
|---|---|---|---|
| Quadrant | BADHDUFLAG | Total packets | Discarded packets |
| A | 0 | 26 | 0 |
| B | 0 | 26 | 0 |
| C | 0 | 26 | 0 |
| D | 0 | 26 | 0 |
| Mode M0 | |||
|---|---|---|---|
| Quadrant | BADHDUFLAG | Total packets | Discarded packets |
| A | 0 | 59962 | 5 |
| B | 0 | 60260 | 5 |
| C | 0 | 62631 | 5 |
| D | 0 | 71458 | 6 |
| Quadrant | Total seconds | Saturated seconds | Saturation percentage |
|---|---|---|---|
| A | 29255 | 288 | 0.984447% |
| B | 29256 | 418 | 1.428767% |
| C | 29256 | 599 | 2.047443% |
| D | 29255 | 1079 | 3.688258% |
Noise dominated data is calculated using 1-second bins in cleaned event files. If a bin has >2000 counts, and if more than 50% of those come from <1% of pixels, then it is considered to be noise-dominated and hence unusable.
| Quadrant | # 1 sec bins | Bins with >0 counts | Bins with >2000 counts | High rate bins dominated by noise | Noise dominated (total time) | Noise dominated (detector-on time) | Marked lightcurve |
|---|---|---|---|---|---|---|---|
| A | 31710 | 29259 | 0 | 0 | 0.00% | 0.00% | 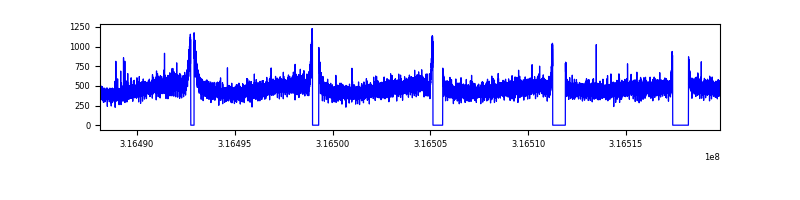 |
| B | 31711 | 29261 | 3 | 3 | 0.01% | 0.01% | 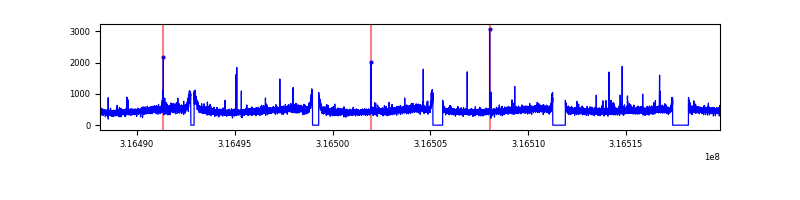 |
| C | 31711 | 29260 | 24 | 24 | 0.08% | 0.08% | 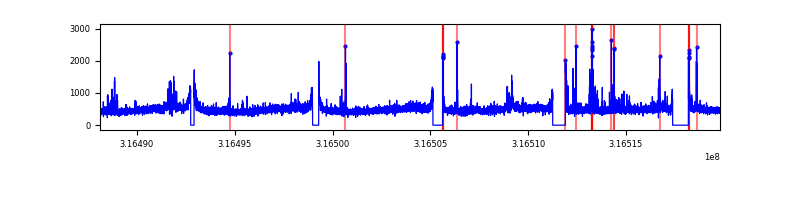 |
| D | 31710 | 29260 | 649 | 649 | 2.05% | 2.22% | 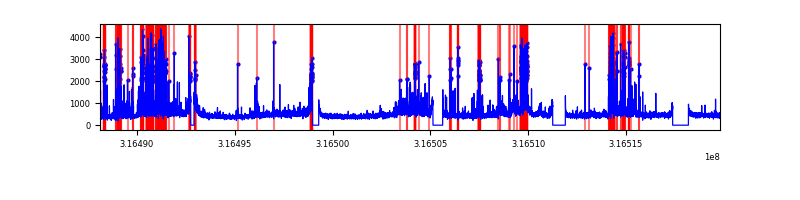 |
Top three noisy pixels from each quadrant. If the there are fewer than three noisy pixels in the level2.evt file, extra rows are filled as -1
| Pixel properties | Quadrant properties | ||||||
|---|---|---|---|---|---|---|---|
| Quadrant | DetID | PixID | Counts | Sigma | Mean | Median | Sigma |
| A | 13 | 254 | 42916 | 55.54 | 3538 | 3455 | 710.5 |
| A | 3 | 137 | 32280 | 40.57 | 3538 | 3455 | 710.5 |
| A | 0 | 226 | 30180 | 37.61 | 3538 | 3455 | 710.5 |
| B | 12 | 111 | 84895 | 120.68 | 3517 | 3423 | 675.1 |
| B | 11 | 111 | 76182 | 107.77 | 3517 | 3423 | 675.1 |
| B | 14 | 111 | 67984 | 95.63 | 3517 | 3423 | 675.1 |
| C | 7 | 247 | 557976 | 701.55 | 3391 | 3415 | 790.5 |
| C | 14 | 238 | 532952 | 669.89 | 3391 | 3415 | 790.5 |
| C | 0 | 10 | 459337 | 576.77 | 3391 | 3415 | 790.5 |
| D | 1 | 52 | 2683289 | 3220.6 | 3406 | 3309 | 832.1 |
| D | 13 | 153 | 825777 | 988.38 | 3406 | 3309 | 832.1 |
| D | 7 | 238 | 275287 | 326.84 | 3406 | 3309 | 832.1 |
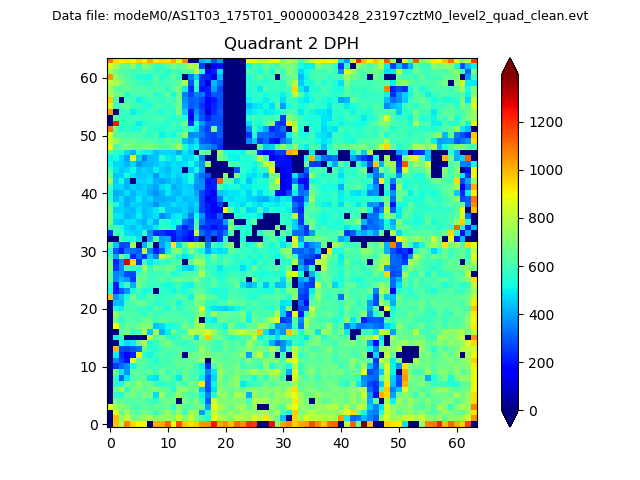
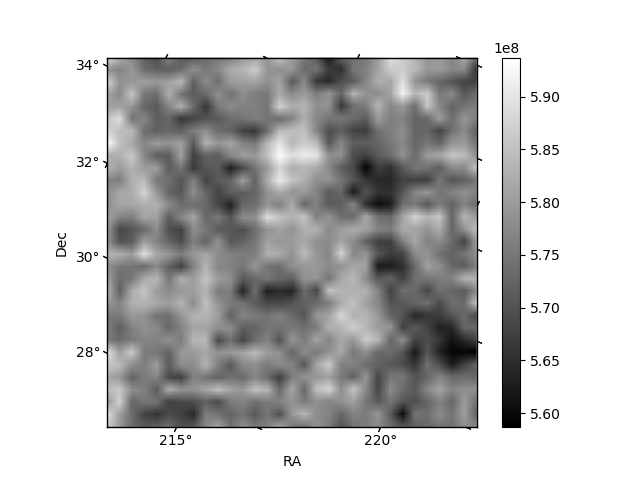
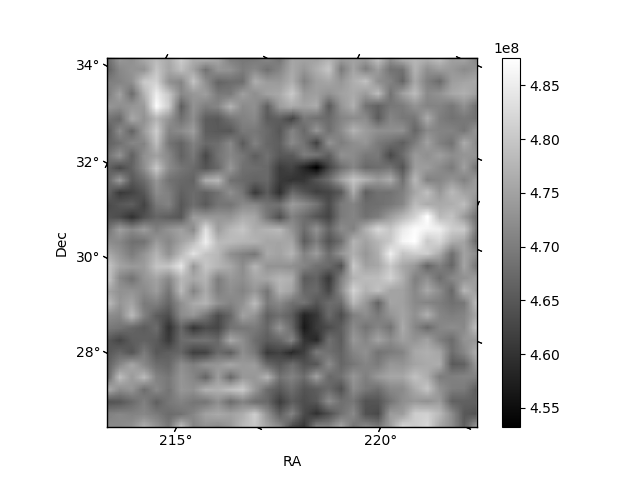
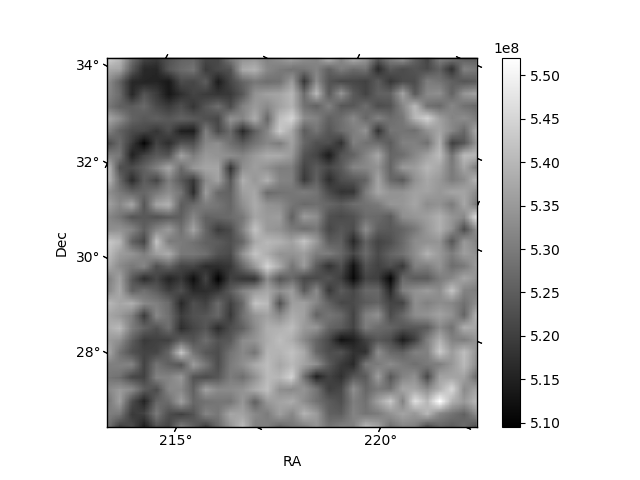
Histogram calculated using DETX and DETY for each event in the final _common_clean file
| Quadrant A | 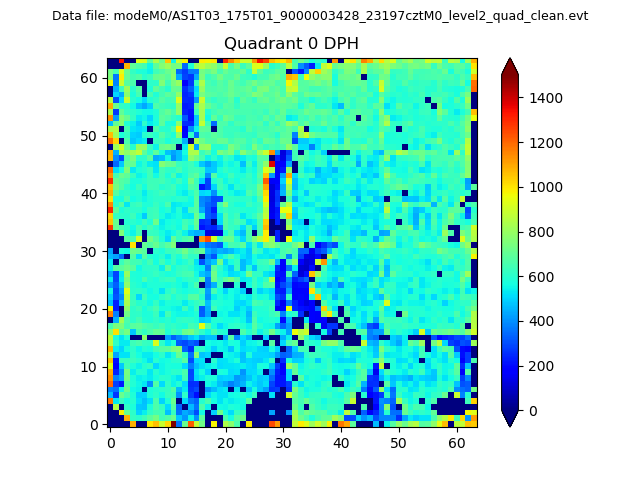 |
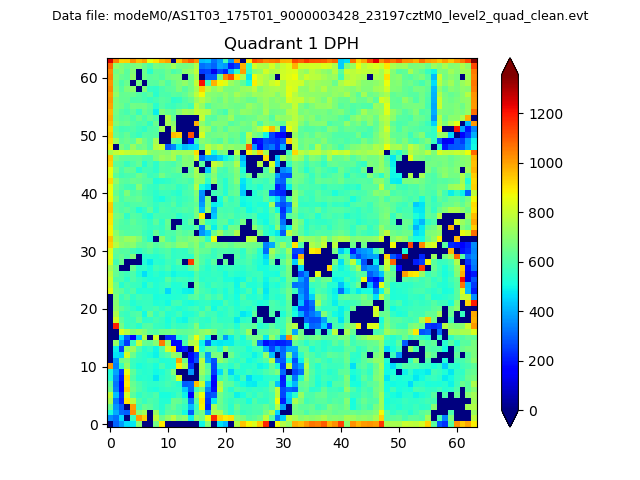 |
Quadrant B |
|---|---|---|---|
| Quadrant D | 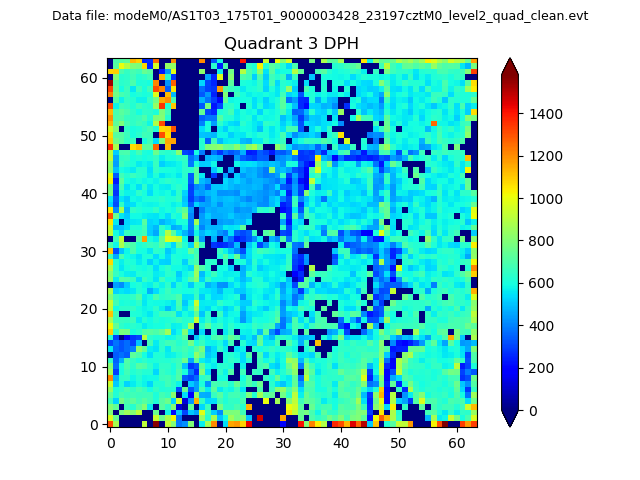 |
 |
Quadrant C |
| Plot type | Count rate plots | Images |
|---|---|---|
| Comparison with Poisson distribution Blue bars denote a histogram of data divided into 1 sec bins. Red curve is a Poisson curve with rate = median count rate of data. |
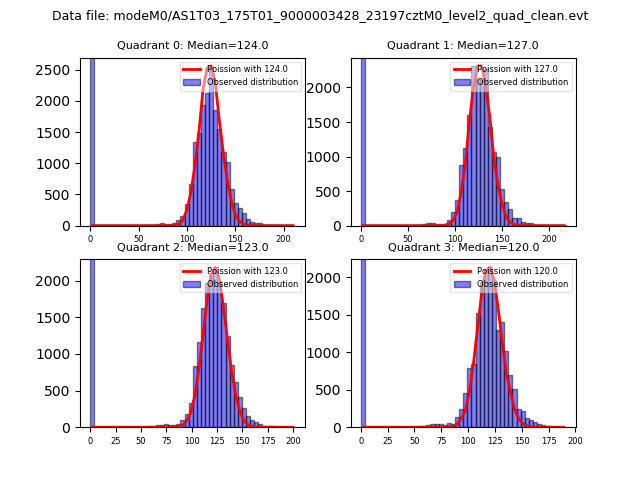 |
 |
| Quadrant-wise count rates Data is divided into 100 sec bins |
 |
|
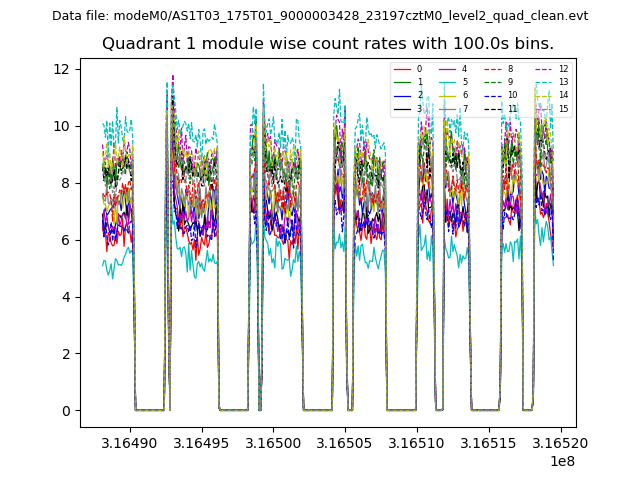
| Module-wise count rates for Quadrant A Data is divided into 100 sec bins |
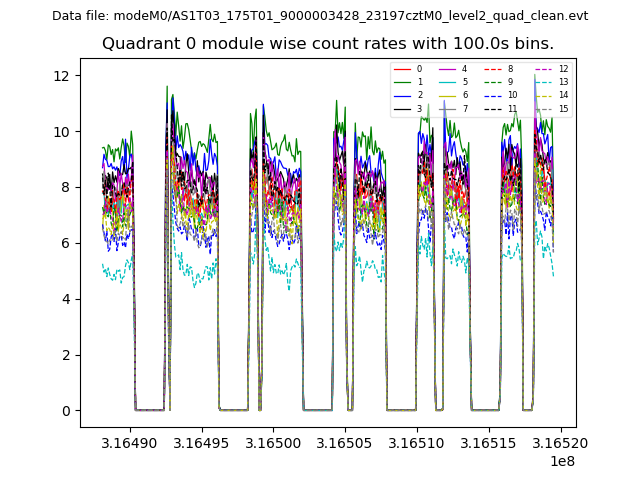 |
 |
| Module-wise count rates for Quadrant B Data is divided into 100 sec bins |
 |
 |
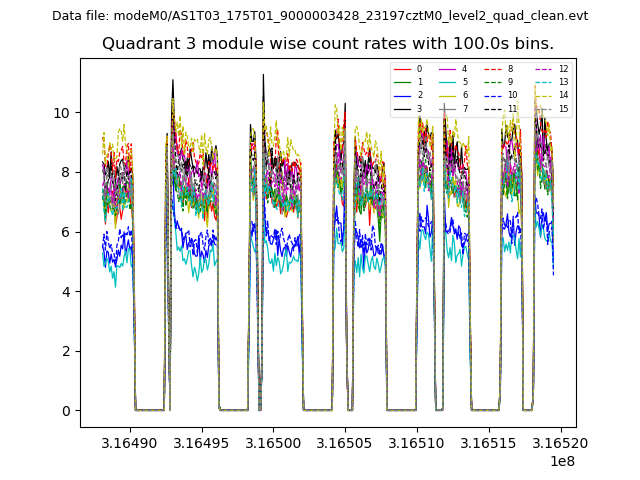
| Module-wise count rates for Quadrant C Data is divided into 100 sec bins |
 |
 |
| Module-wise count rates for Quadrant D Data is divided into 100 sec bins |
 |
 |
| Parameter | Plot |
|---|---|
| CZT HV Monitor |  |
| D_VDD | 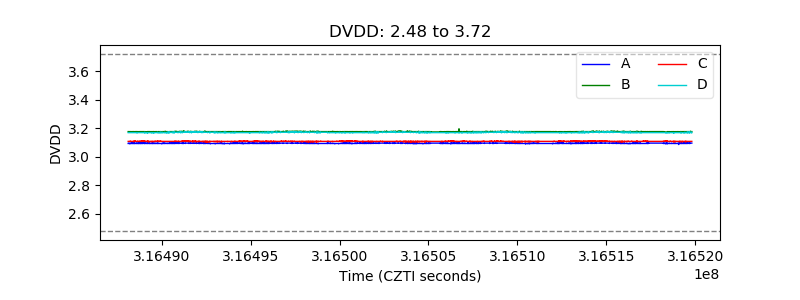 |
| Temperature 1 | 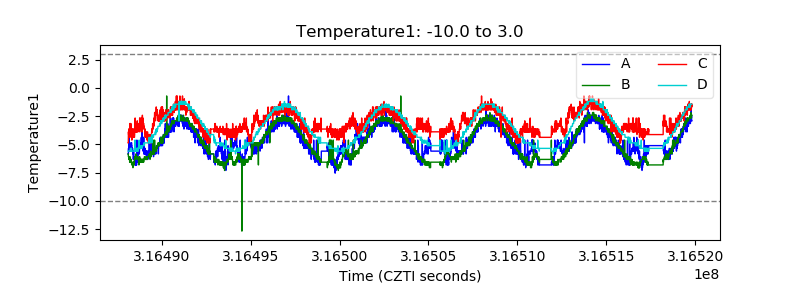 |
| Veto HV Monitor | 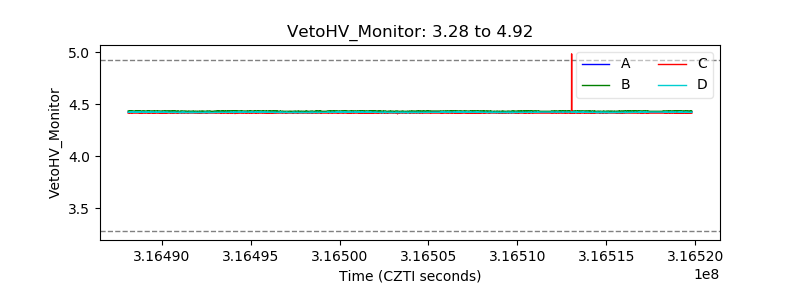 |
| Veto LLD | 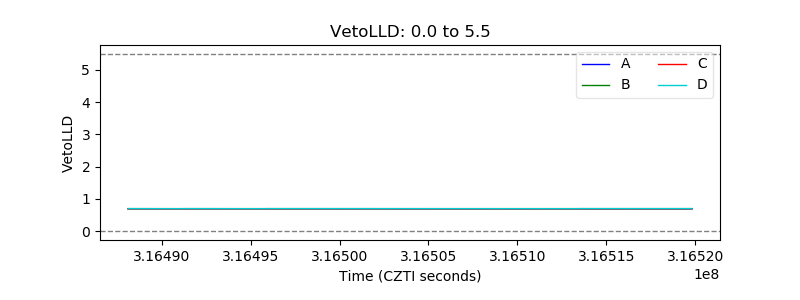 |
| Alpha Counter | 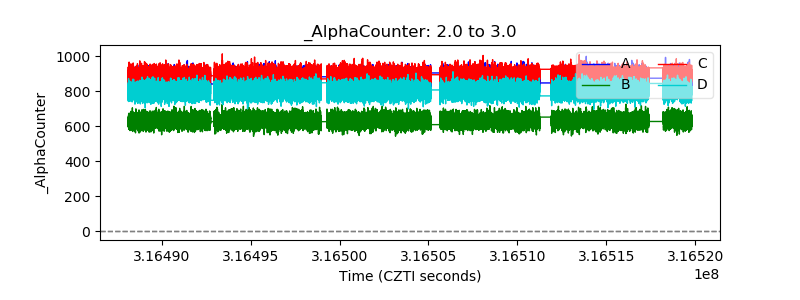 |
| _CPM_Rate | 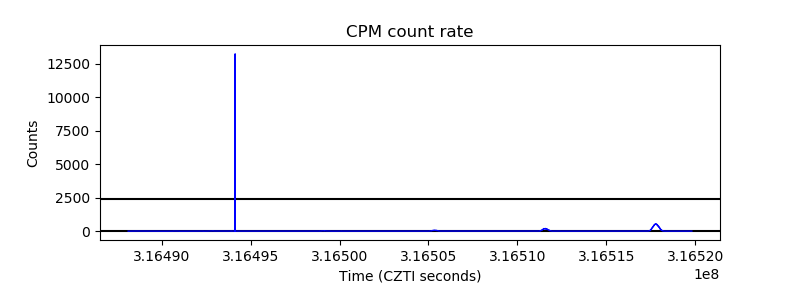 |
| CZT Counter | 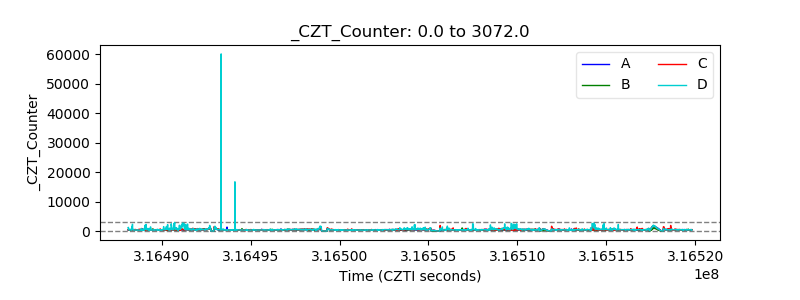 |
| +2.5 Volts monitor |  |
| +5 Volts monitor |  |
| _ROLL_ROT | 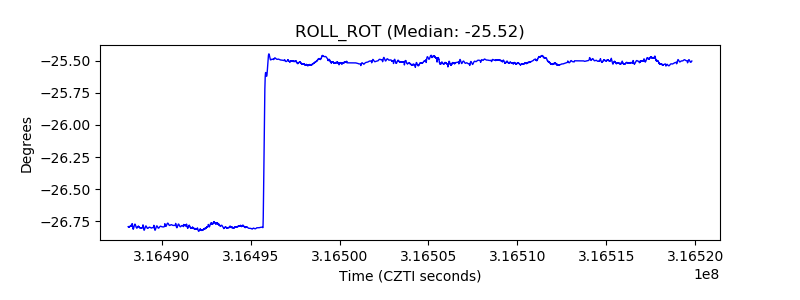 |
| _Roll_DEC | 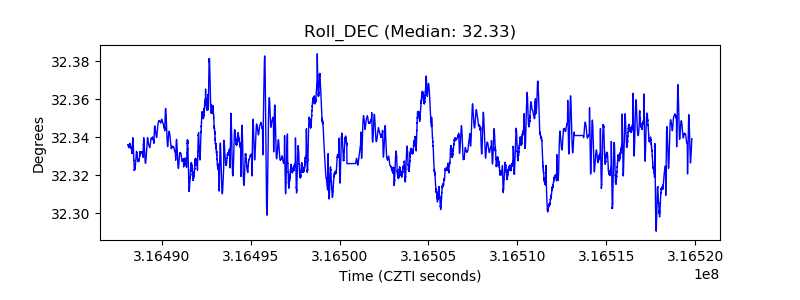 |
| _Roll_RA | 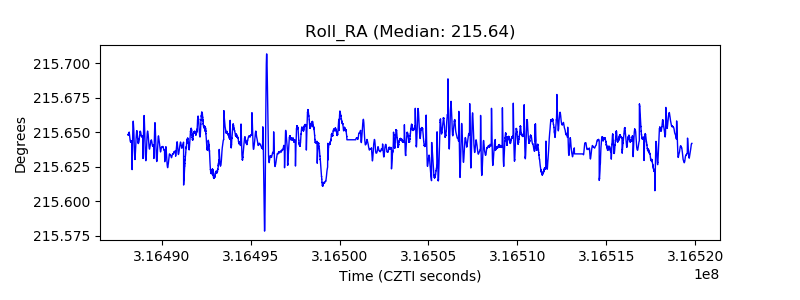 |
| Veto Counter | 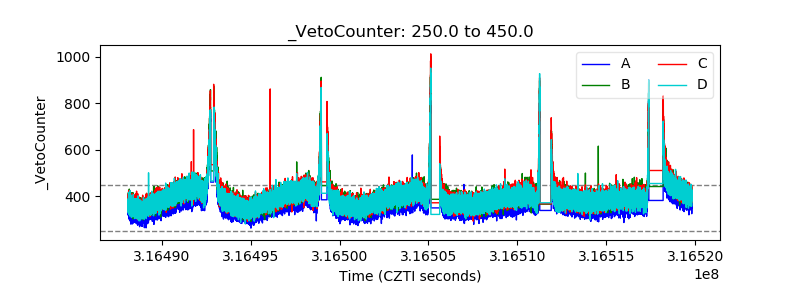 |