| Param | Original file | Final file |
|---|---|---|
| Filename | modeM0/AS1T03_175T01_9000003428_23200cztM0_level2.evt | modeM0/AS1T03_175T01_9000003428_23200cztM0_level2_quad_clean.evt |
| Size (bytes) | 448,064,640 | 74,373,120 |
| Size | 427.3 MB | 70.9 MB |
| Events in quadrant A | 3,071,043 | 461,210 |
| Events in quadrant B | 3,146,249 | 468,922 |
| Events in quadrant C | 3,387,781 | 448,801 |
| Events in quadrant D | 3,548,171 | 445,096 |
| Mode SS | |||
|---|---|---|---|
| Quadrant | BADHDUFLAG | Total packets | Discarded packets |
| A | 0 | 124 | 0 |
| B | 0 | 124 | 0 |
| C | 0 | 124 | 0 |
| D | 0 | 124 | 0 |
| Mode M9 | |||
|---|---|---|---|
| Quadrant | BADHDUFLAG | Total packets | Discarded packets |
| A | 0 | 12 | 0 |
| B | 0 | 12 | 0 |
| C | 0 | 12 | 0 |
| D | 0 | 12 | 0 |
| Mode M0 | |||
|---|---|---|---|
| Quadrant | BADHDUFLAG | Total packets | Discarded packets |
| A | 0 | 12994 | 1 |
| B | 0 | 13152 | 2 |
| C | 0 | 13855 | 1 |
| D | 0 | 14577 | 1 |
| Quadrant | Total seconds | Saturated seconds | Saturation percentage |
|---|---|---|---|
| A | 6132 | 48 | 0.782779% |
| B | 6131 | 57 | 0.929702% |
| C | 6131 | 130 | 2.120372% |
| D | 6132 | 108 | 1.761252% |
Noise dominated data is calculated using 1-second bins in cleaned event files. If a bin has >2000 counts, and if more than 50% of those come from <1% of pixels, then it is considered to be noise-dominated and hence unusable.
| Quadrant | # 1 sec bins | Bins with >0 counts | Bins with >2000 counts | High rate bins dominated by noise | Noise dominated (total time) | Noise dominated (detector-on time) | Marked lightcurve |
|---|---|---|---|---|---|---|---|
| A | 7267 | 6132 | 0 | 0 | 0.00% | 0.00% | 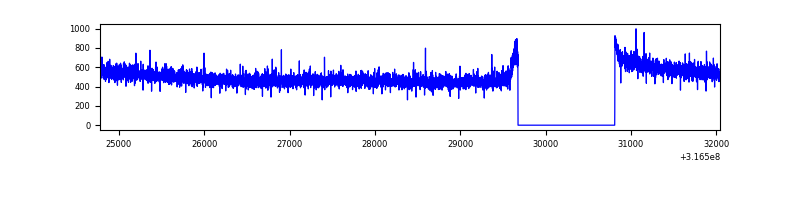 |
| B | 7266 | 6131 | 5 | 5 | 0.07% | 0.08% | 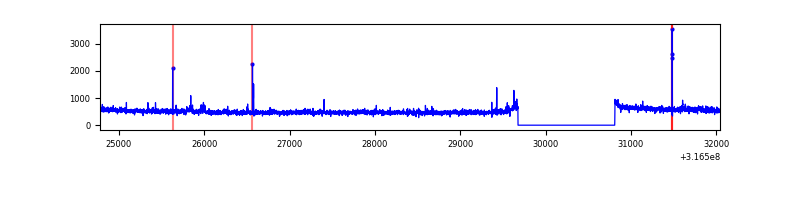 |
| C | 7266 | 6131 | 26 | 26 | 0.36% | 0.42% | 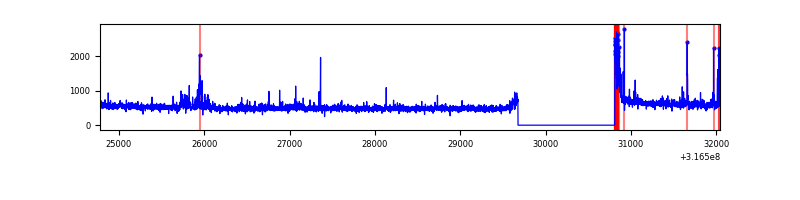 |
| D | 7267 | 6132 | 45 | 45 | 0.62% | 0.73% | 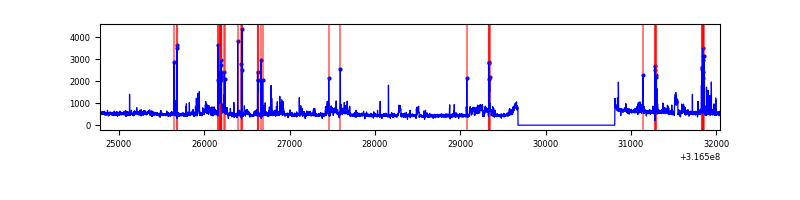 |
Top three noisy pixels from each quadrant. If the there are fewer than three noisy pixels in the level2.evt file, extra rows are filled as -1
| Pixel properties | Quadrant properties | ||||||
|---|---|---|---|---|---|---|---|
| Quadrant | DetID | PixID | Counts | Sigma | Mean | Median | Sigma |
| A | 13 | 254 | 8760 | 50.38 | 796 | 779 | 158.4 |
| A | 0 | 226 | 6994 | 39.23 | 796 | 779 | 158.4 |
| A | 3 | 137 | 6593 | 36.7 | 796 | 779 | 158.4 |
| B | 0 | 190 | 28041 | 182.63 | 788 | 770 | 149.3 |
| B | 12 | 111 | 17870 | 114.52 | 788 | 770 | 149.3 |
| B | 11 | 111 | 16103 | 102.68 | 788 | 770 | 149.3 |
| C | 0 | 10 | 207711 | 1161.49 | 764 | 772 | 178.2 |
| C | 14 | 238 | 120780 | 673.57 | 764 | 772 | 178.2 |
| C | 7 | 247 | 63481 | 351.97 | 764 | 772 | 178.2 |
| D | 1 | 52 | 236756 | 1244.89 | 777 | 756 | 189.6 |
| D | 13 | 153 | 231615 | 1217.77 | 777 | 756 | 189.6 |
| D | 12 | 233 | 96547 | 505.29 | 777 | 756 | 189.6 |
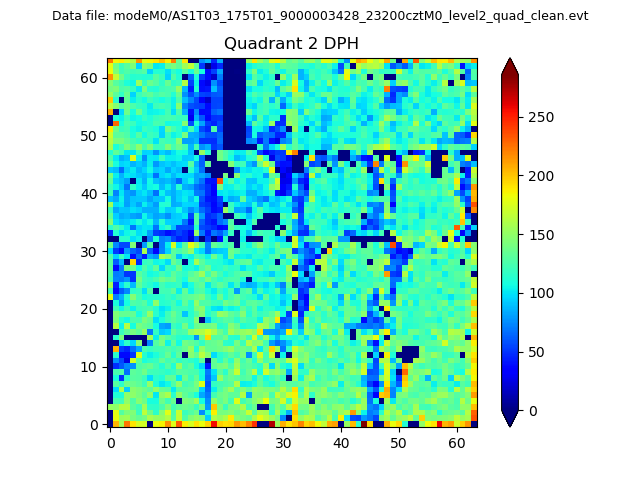
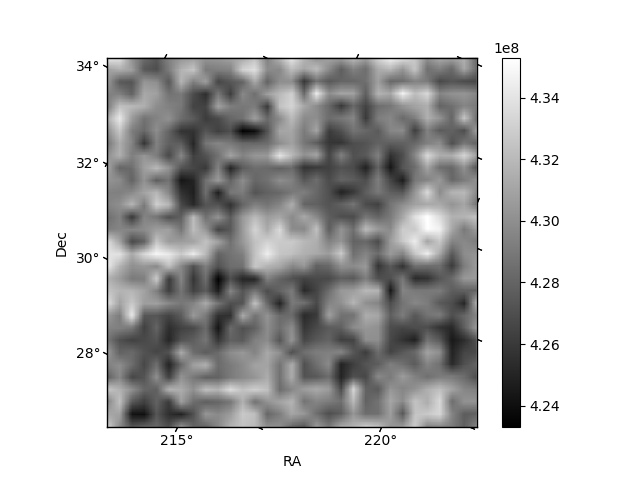
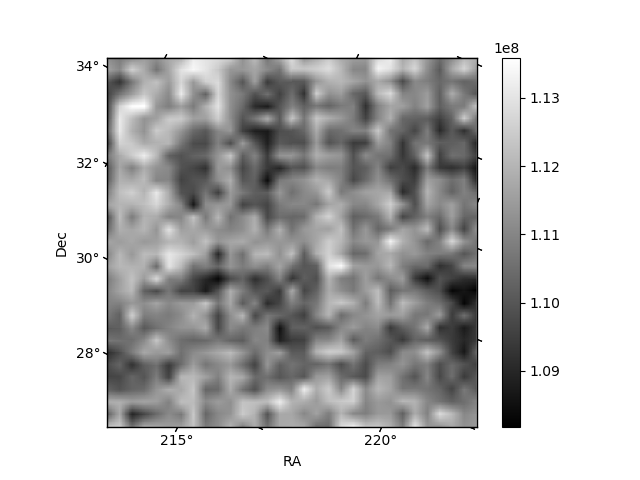
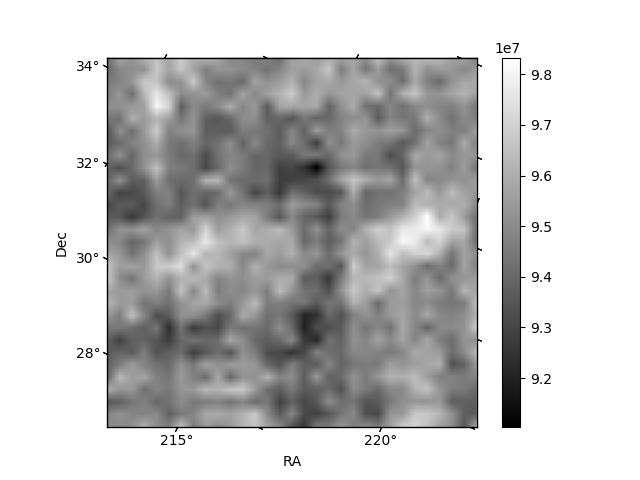
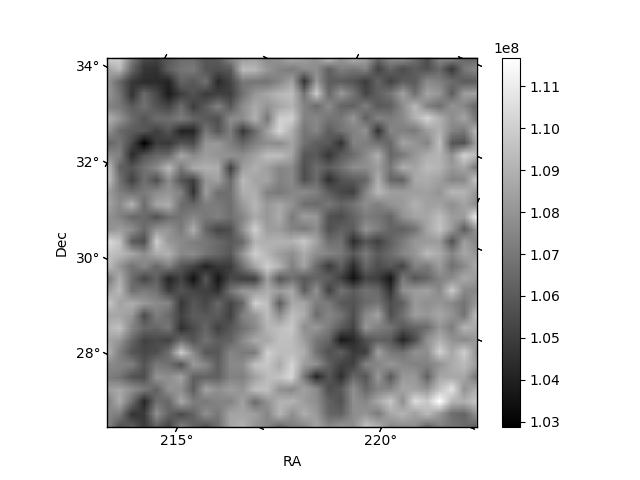
Histogram calculated using DETX and DETY for each event in the final _common_clean file
| Quadrant A | 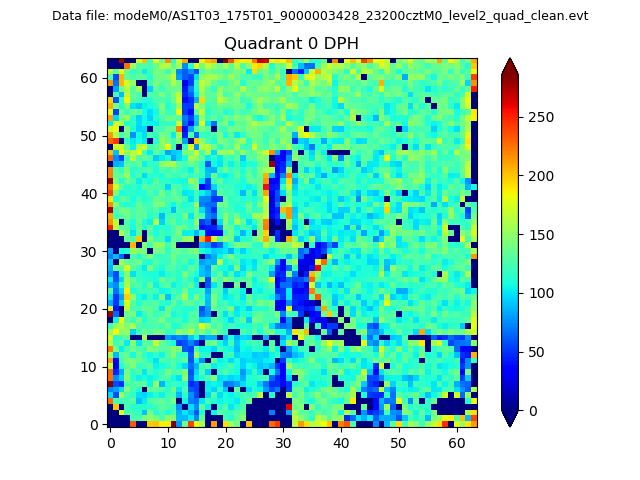 |
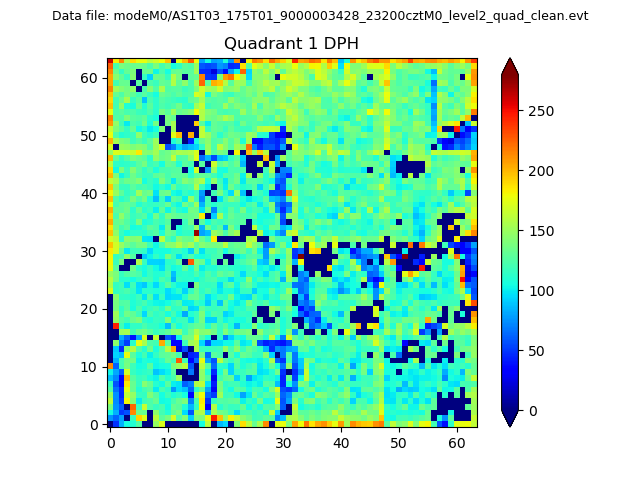 |
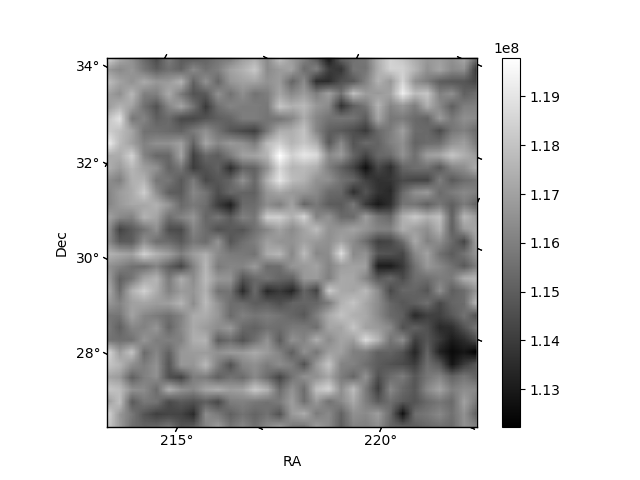
Quadrant B |
|---|---|---|---|
| Quadrant D | 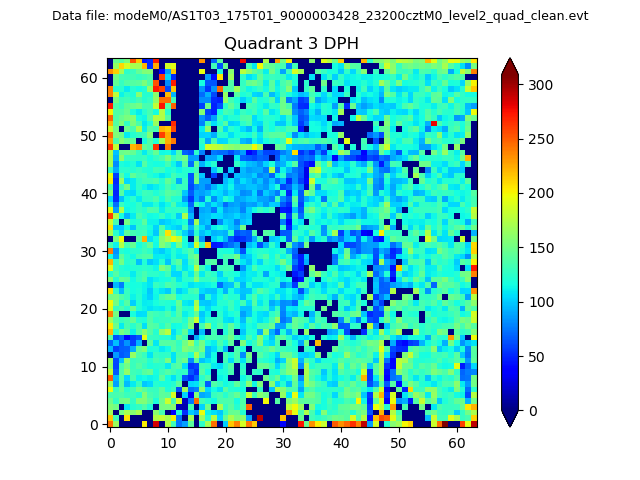 |
 |
Quadrant C |
| Plot type | Count rate plots | Images |
|---|---|---|
| Comparison with Poisson distribution Blue bars denote a histogram of data divided into 1 sec bins. Red curve is a Poisson curve with rate = median count rate of data. |
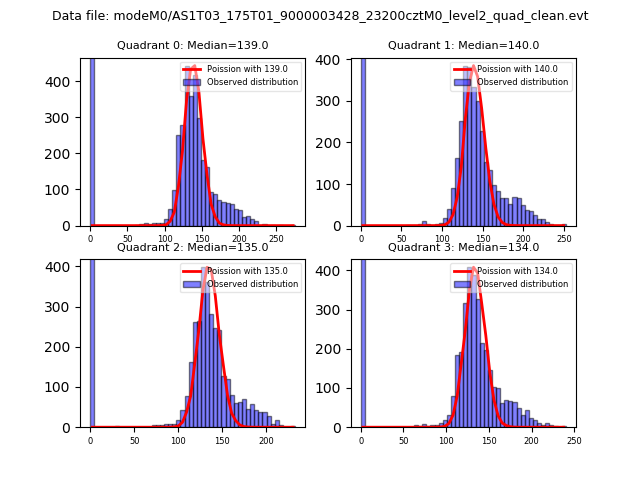 |
 |
| Quadrant-wise count rates Data is divided into 100 sec bins |
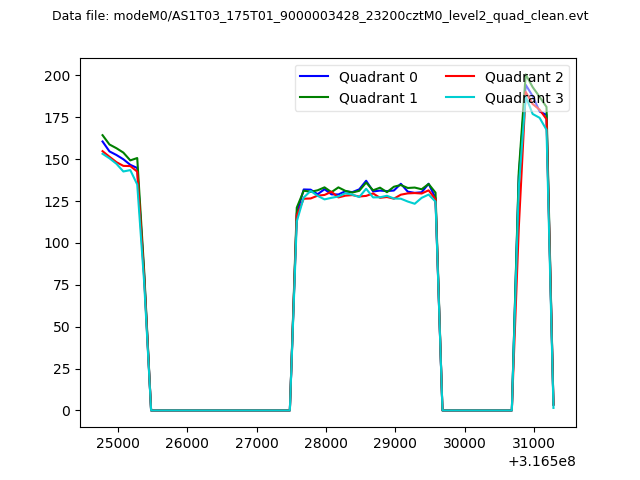 |
|
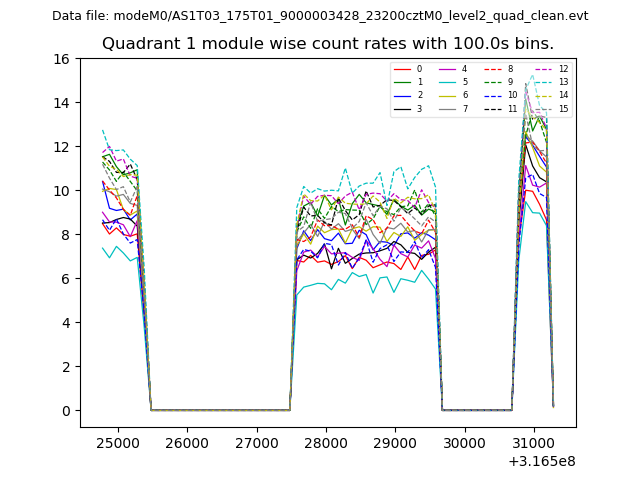
| Module-wise count rates for Quadrant A Data is divided into 100 sec bins |
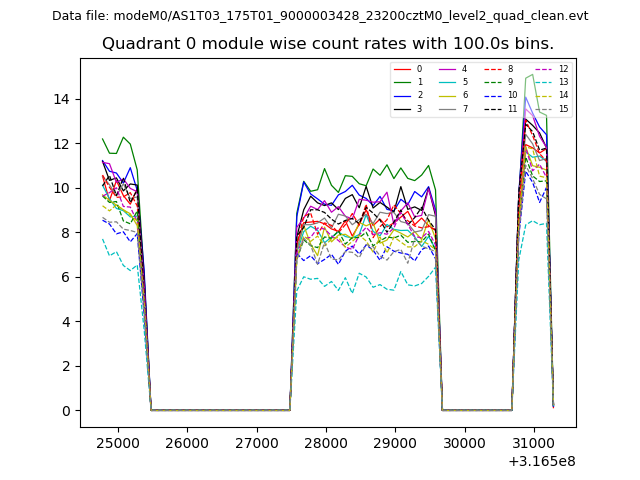 |
 |
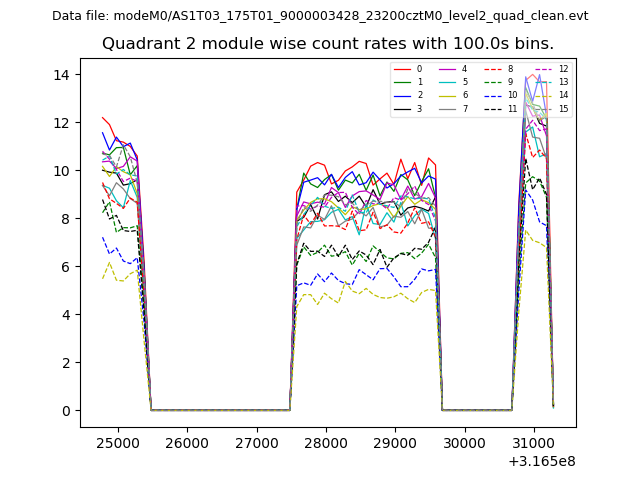
| Module-wise count rates for Quadrant B Data is divided into 100 sec bins |
 |
 |
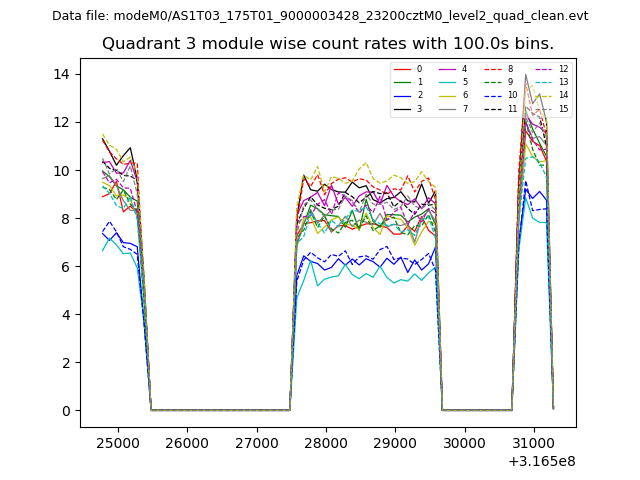
| Module-wise count rates for Quadrant C Data is divided into 100 sec bins |
 |
 |
| Module-wise count rates for Quadrant D Data is divided into 100 sec bins |
 |
 |
| Parameter | Plot |
|---|---|
| CZT HV Monitor | 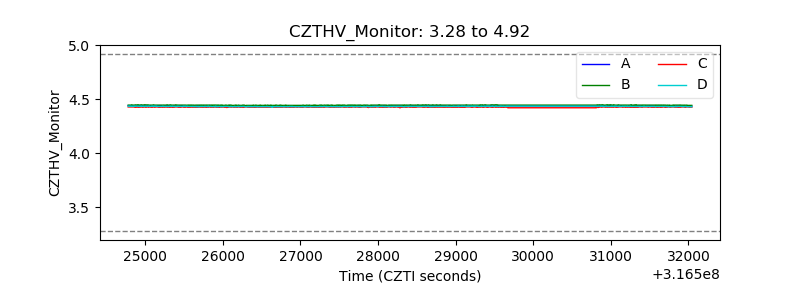 |
| D_VDD | 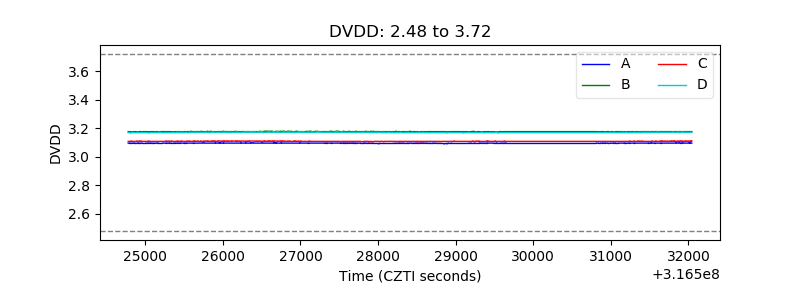 |
| Temperature 1 | 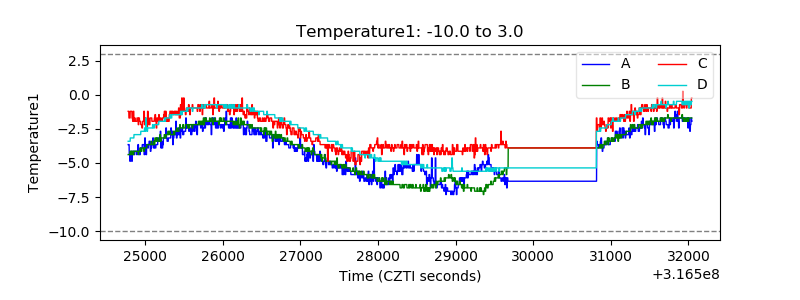 |
| Veto HV Monitor | 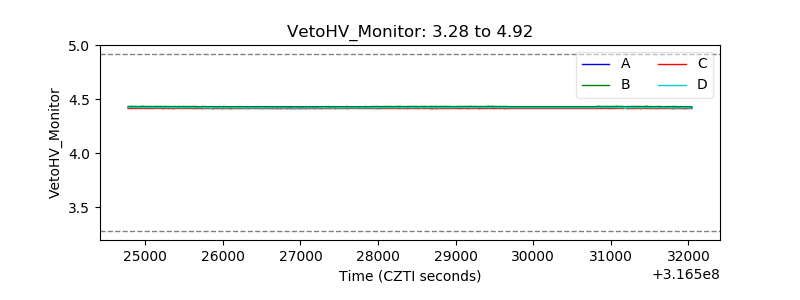 |
| Veto LLD | 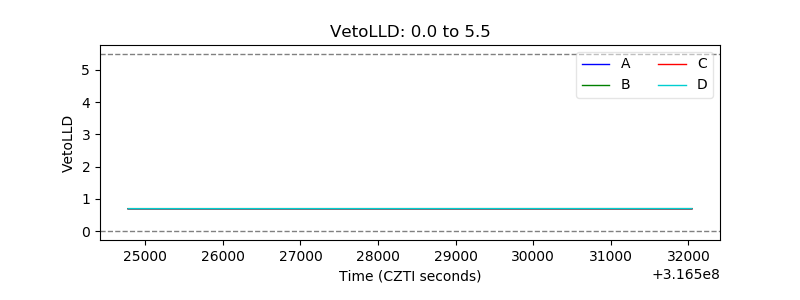 |
| Alpha Counter | 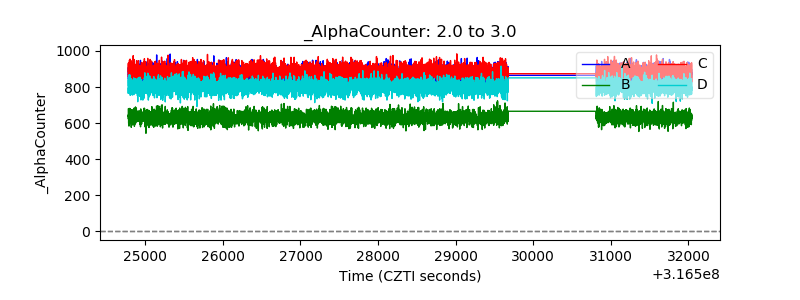 |
| _CPM_Rate | 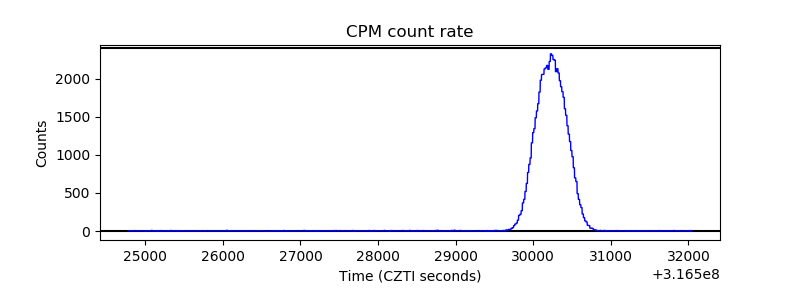 |
| CZT Counter | 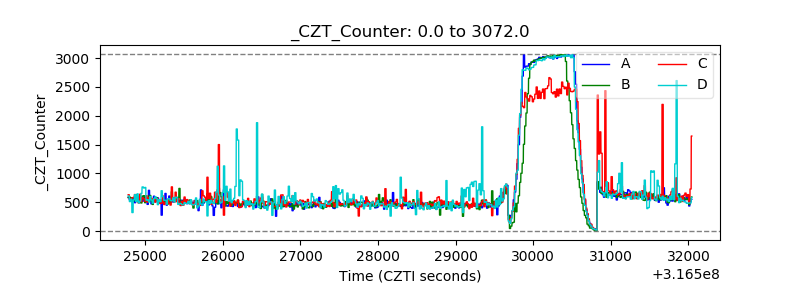 |
| +2.5 Volts monitor |  |
| +5 Volts monitor | 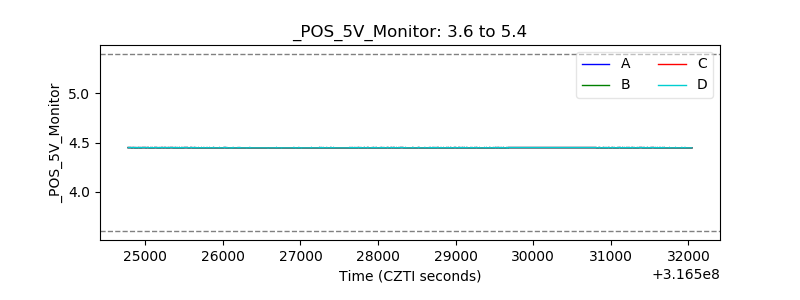 |
| _ROLL_ROT | 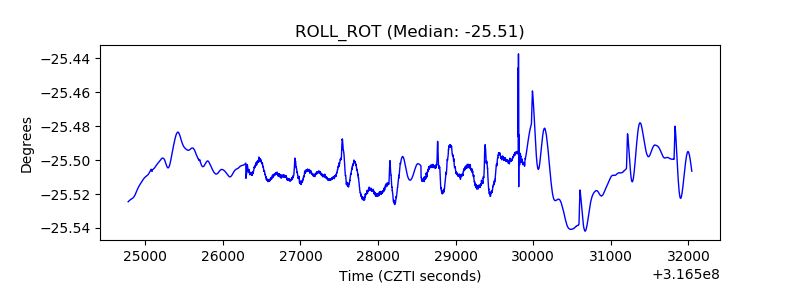 |
| _Roll_DEC | 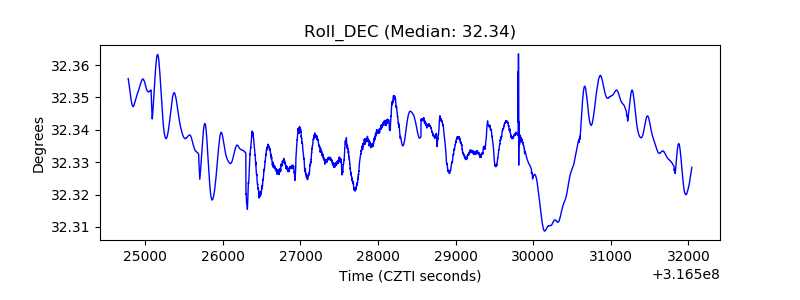 |
| _Roll_RA | 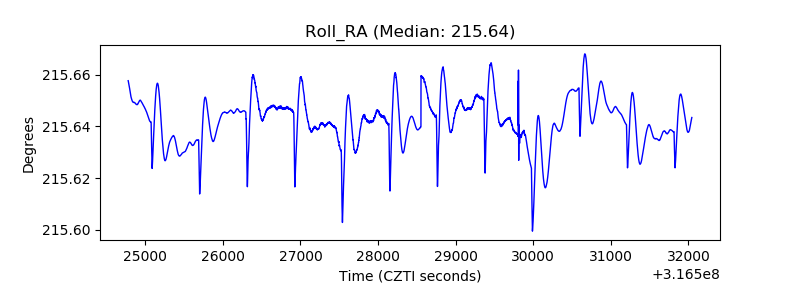 |
| Veto Counter | 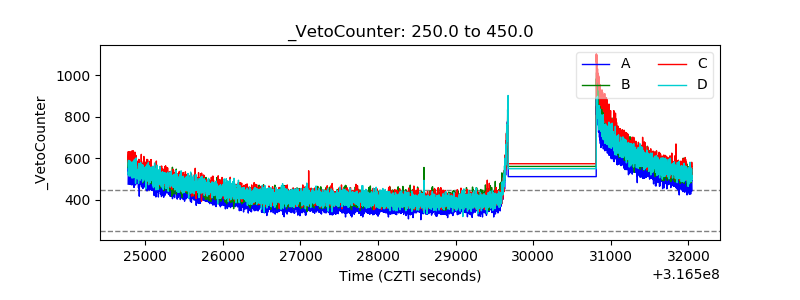 |