| Param | Original file | Final file |
|---|---|---|
| Filename | modeM0/AS1T03_175T01_9000003428_23201cztM0_level2.evt | modeM0/AS1T03_175T01_9000003428_23201cztM0_level2_quad_clean.evt |
| Size (bytes) | 527,590,080 | 71,046,720 |
| Size | 503.1 MB | 67.8 MB |
| Events in quadrant A | 3,493,696 | 429,548 |
| Events in quadrant B | 3,548,411 | 436,164 |
| Events in quadrant C | 3,977,261 | 415,321 |
| Events in quadrant D | 4,516,861 | 415,561 |
| Mode SS | |||
|---|---|---|---|
| Quadrant | BADHDUFLAG | Total packets | Discarded packets |
| A | 0 | 132 | 0 |
| B | 0 | 132 | 0 |
| C | 0 | 132 | 0 |
| D | 0 | 132 | 0 |
| Mode M9 | |||
|---|---|---|---|
| Quadrant | BADHDUFLAG | Total packets | Discarded packets |
| A | 0 | 16 | 0 |
| B | 0 | 17 | 0 |
| C | 0 | 17 | 0 |
| D | 0 | 17 | 0 |
| Mode M0 | |||
|---|---|---|---|
| Quadrant | BADHDUFLAG | Total packets | Discarded packets |
| A | 0 | 14623 | 2 |
| B | 0 | 14755 | 2 |
| C | 0 | 16102 | 2 |
| D | 0 | 17866 | 2 |
| Quadrant | Total seconds | Saturated seconds | Saturation percentage |
|---|---|---|---|
| A | 6519 | 72 | 1.104464% |
| B | 6519 | 84 | 1.288541% |
| C | 6519 | 216 | 3.313392% |
| D | 6519 | 321 | 4.924068% |
Noise dominated data is calculated using 1-second bins in cleaned event files. If a bin has >2000 counts, and if more than 50% of those come from <1% of pixels, then it is considered to be noise-dominated and hence unusable.
| Quadrant | # 1 sec bins | Bins with >0 counts | Bins with >2000 counts | High rate bins dominated by noise | Noise dominated (total time) | Noise dominated (detector-on time) | Marked lightcurve |
|---|---|---|---|---|---|---|---|
| A | 7749 | 6519 | 0 | 0 | 0.00% | 0.00% | 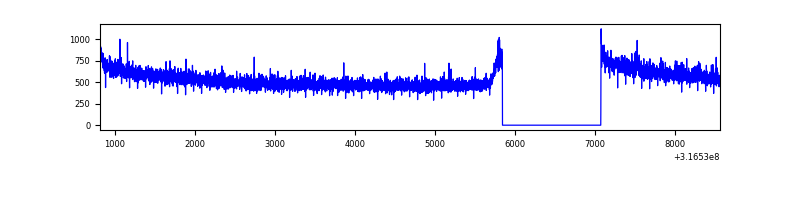 |
| B | 7749 | 6519 | 5 | 5 | 0.06% | 0.08% | 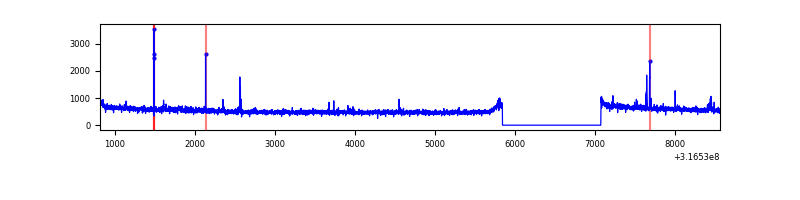 |
| C | 7749 | 6519 | 56 | 56 | 0.72% | 0.86% | 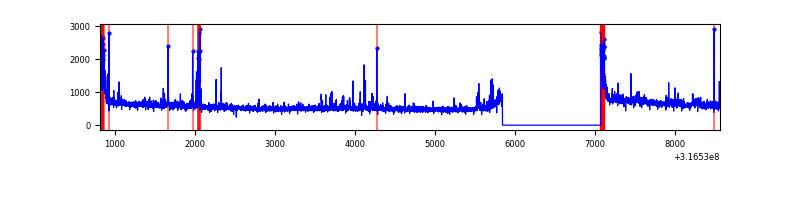 |
| D | 7749 | 6519 | 177 | 177 | 2.28% | 2.72% | 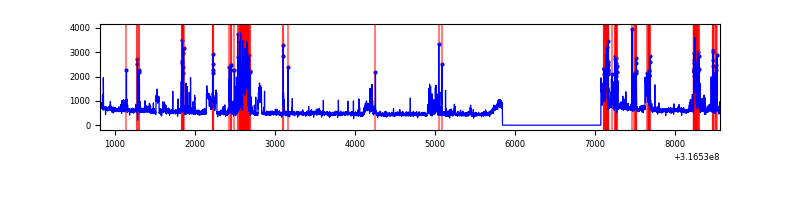 |
Top three noisy pixels from each quadrant. If the there are fewer than three noisy pixels in the level2.evt file, extra rows are filled as -1
| Pixel properties | Quadrant properties | ||||||
|---|---|---|---|---|---|---|---|
| Quadrant | DetID | PixID | Counts | Sigma | Mean | Median | Sigma |
| A | 13 | 254 | 9574 | 48.42 | 904 | 889 | 179.4 |
| A | 0 | 226 | 7985 | 39.56 | 904 | 889 | 179.4 |
| A | 3 | 137 | 7136 | 34.83 | 904 | 889 | 179.4 |
| B | 0 | 190 | 44150 | 262.88 | 892 | 873 | 164.6 |
| B | 12 | 111 | 19306 | 111.97 | 892 | 873 | 164.6 |
| B | 11 | 111 | 17249 | 99.47 | 892 | 873 | 164.6 |
| C | 0 | 10 | 379366 | 1909.9 | 868 | 877 | 198.2 |
| C | 14 | 238 | 138922 | 696.59 | 868 | 877 | 198.2 |
| C | 7 | 247 | 47760 | 236.58 | 868 | 877 | 198.2 |
| D | 1 | 52 | 486882 | 2264.92 | 878 | 854 | 214.6 |
| D | 12 | 233 | 448793 | 2087.42 | 878 | 854 | 214.6 |
| D | 13 | 153 | 127001 | 587.85 | 878 | 854 | 214.6 |
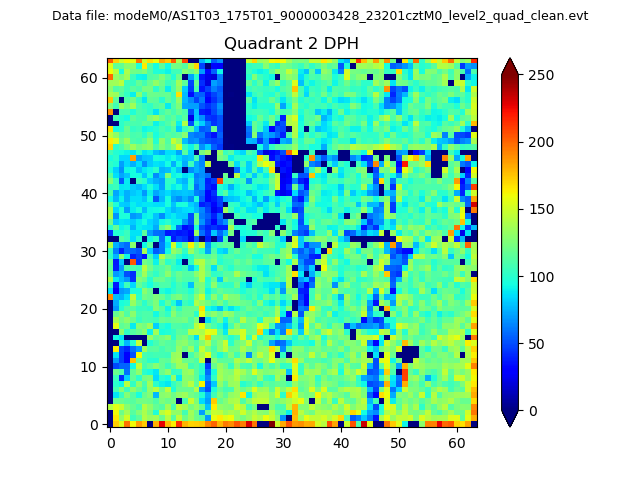
Histogram calculated using DETX and DETY for each event in the final _common_clean file
| Quadrant A | 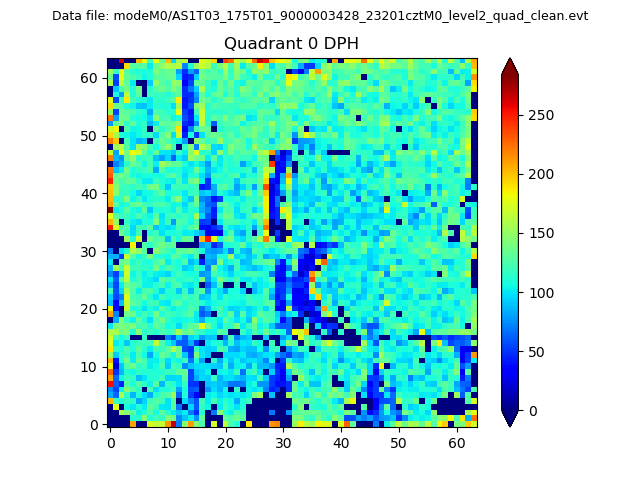 |
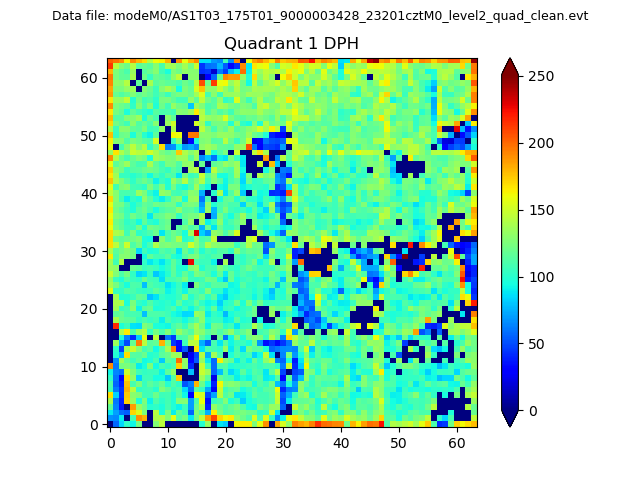 |
Quadrant B |
|---|---|---|---|
| Quadrant D | 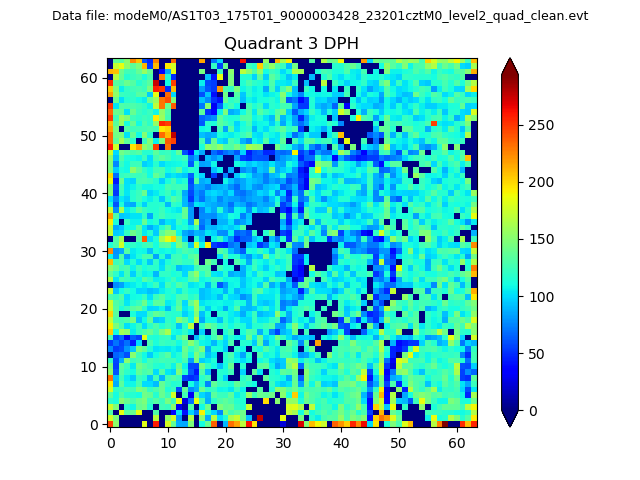 |
 |
Quadrant C |
| Plot type | Count rate plots | Images |
|---|---|---|
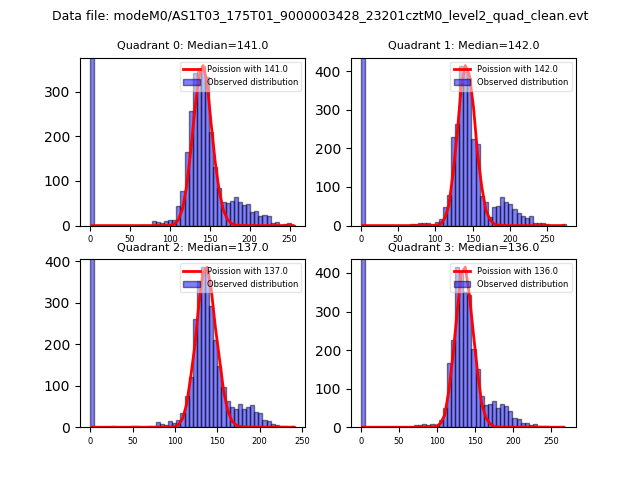
| Comparison with Poisson distribution Blue bars denote a histogram of data divided into 1 sec bins. Red curve is a Poisson curve with rate = median count rate of data. |
 |
 |
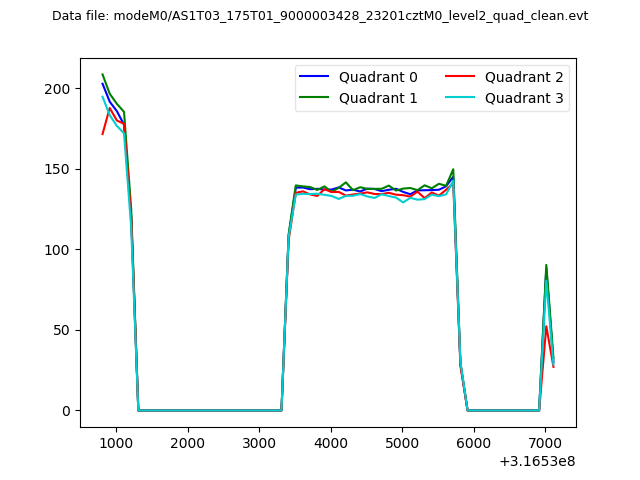
| Quadrant-wise count rates Data is divided into 100 sec bins |
 |
|
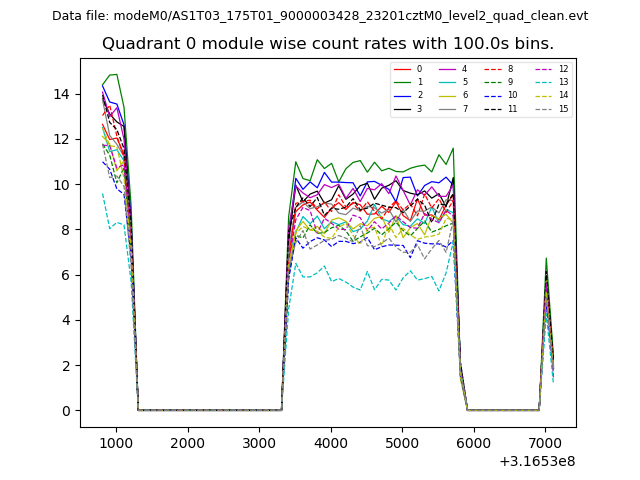
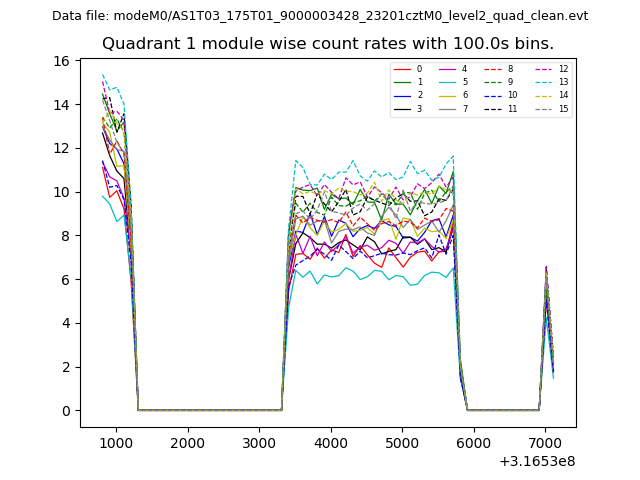
| Module-wise count rates for Quadrant A Data is divided into 100 sec bins |
 |
 |
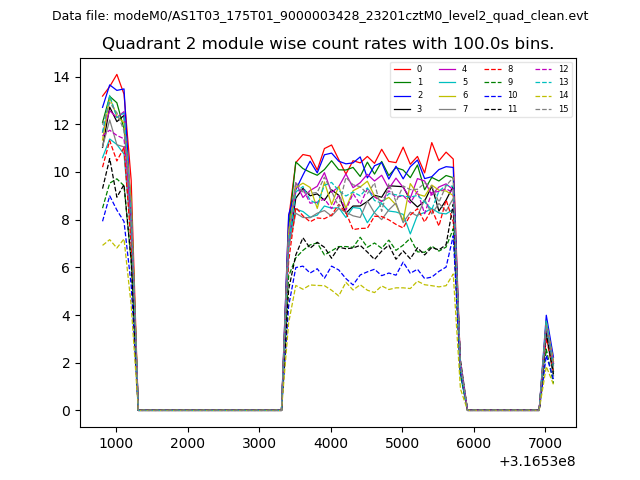
| Module-wise count rates for Quadrant B Data is divided into 100 sec bins |
 |
 |
| Module-wise count rates for Quadrant C Data is divided into 100 sec bins |
 |
 |
| Module-wise count rates for Quadrant D Data is divided into 100 sec bins |
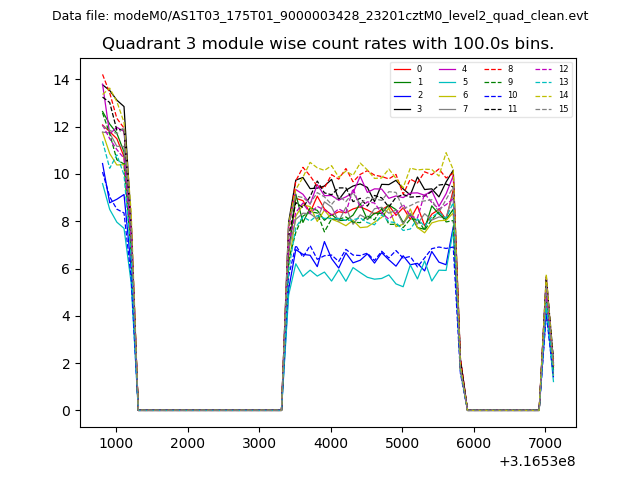 |
 |
| Parameter | Plot |
|---|---|
| CZT HV Monitor | 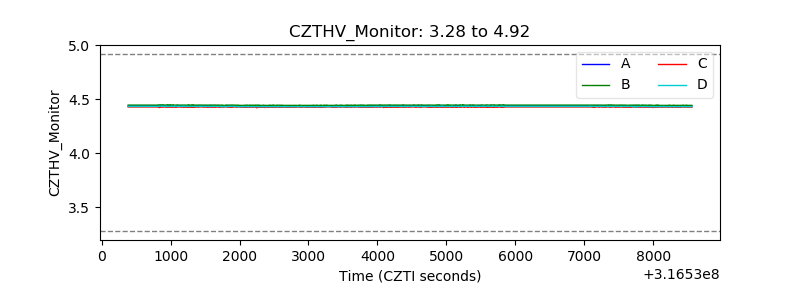 |
| D_VDD | 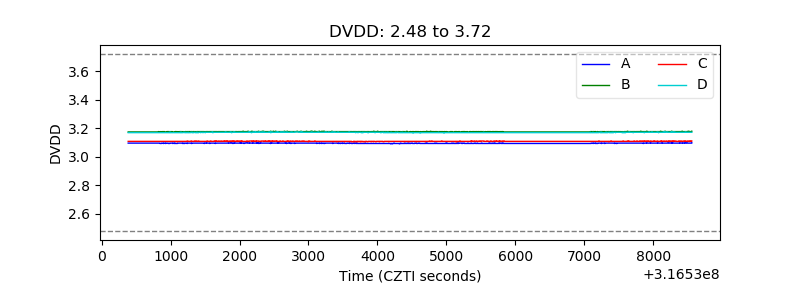 |
| Temperature 1 | 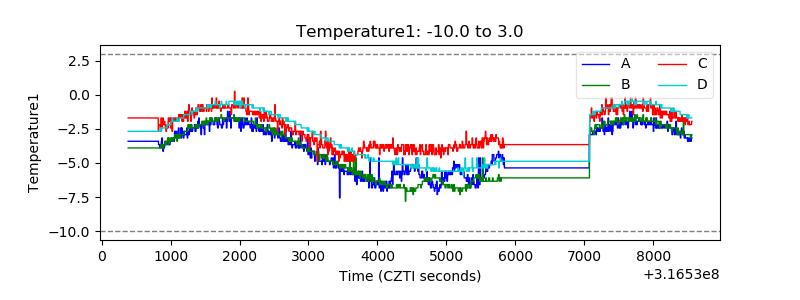 |
| Veto HV Monitor | 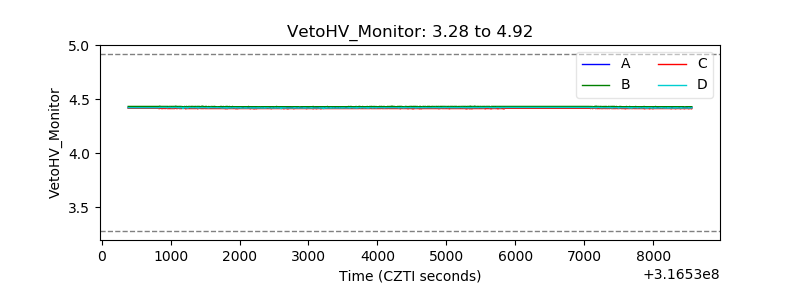 |
| Veto LLD | 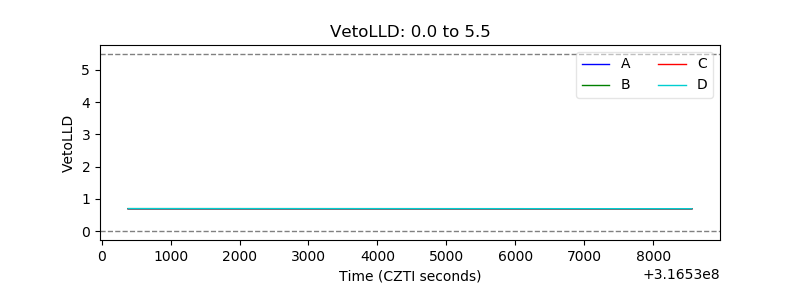 |
| Alpha Counter | 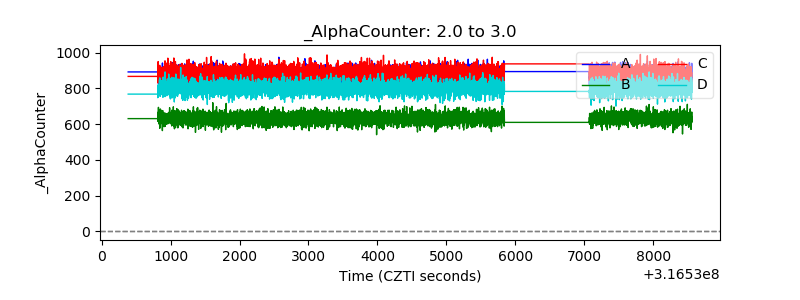 |
| _CPM_Rate | 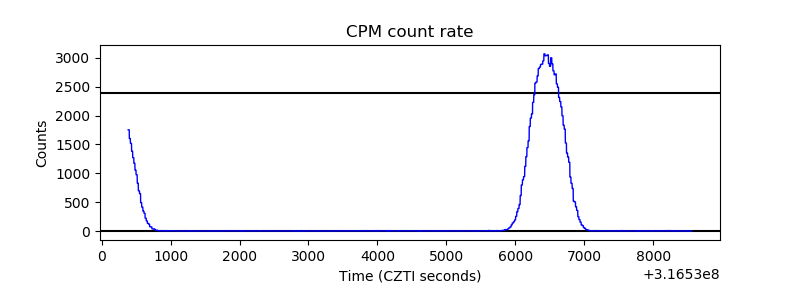 |
| CZT Counter | 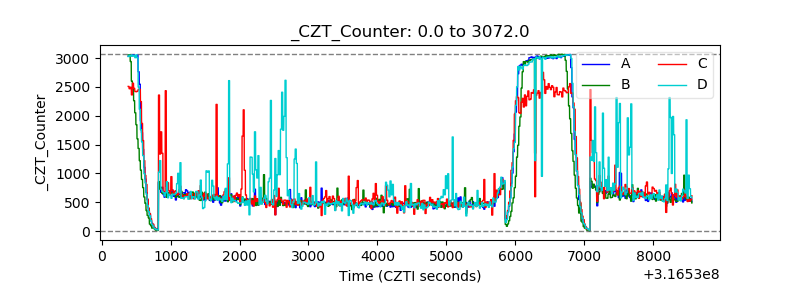 |
| +2.5 Volts monitor | 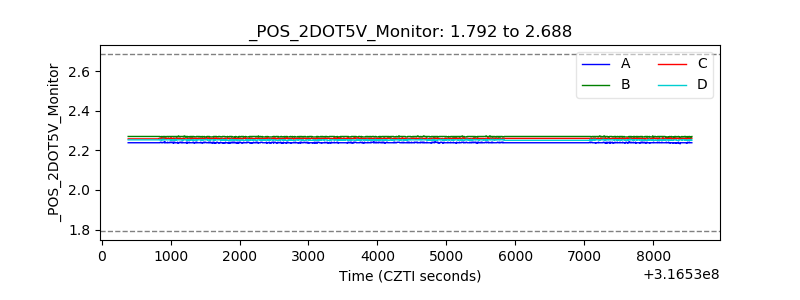 |
| +5 Volts monitor |  |
| _ROLL_ROT | 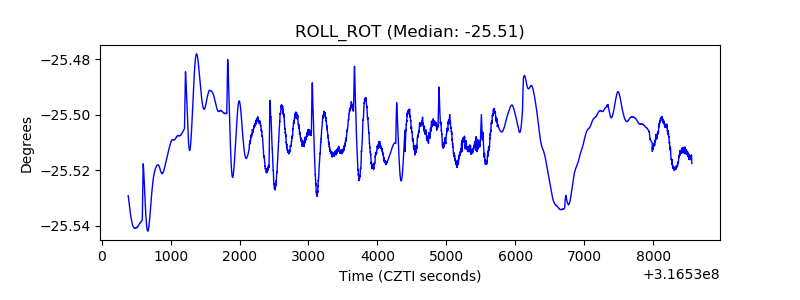 |
| _Roll_DEC | 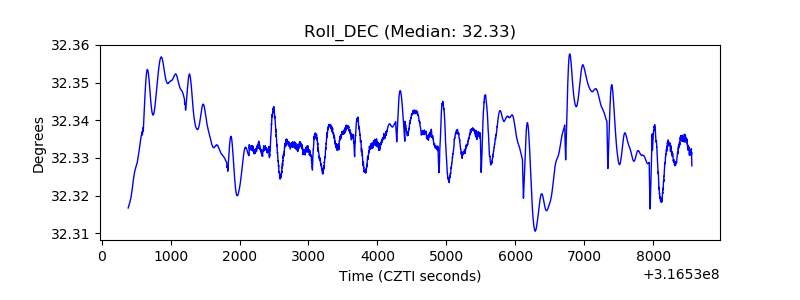 |
| _Roll_RA | 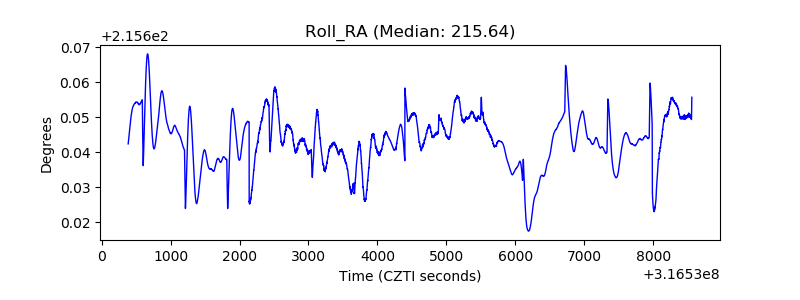 |
| Veto Counter | 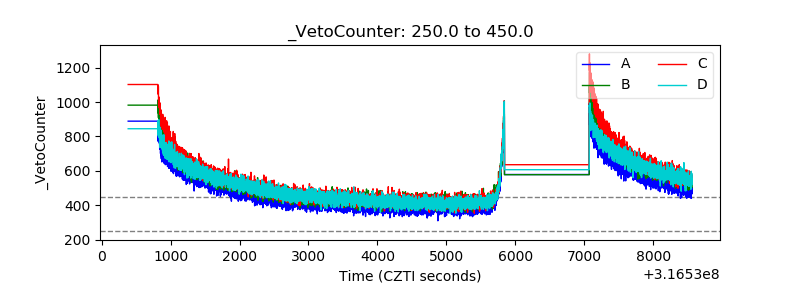 |