| Param | Original file | Final file |
|---|---|---|
| Filename | modeM0/AS1T03_175T01_9000003428_23202cztM0_level2.evt | modeM0/AS1T03_175T01_9000003428_23202cztM0_level2_quad_clean.evt |
| Size (bytes) | 532,013,760 | 67,818,240 |
| Size | 507.4 MB | 64.7 MB |
| Events in quadrant A | 3,588,906 | 404,155 |
| Events in quadrant B | 3,633,243 | 410,837 |
| Events in quadrant C | 4,049,712 | 395,096 |
| Events in quadrant D | 4,402,584 | 392,708 |
| Mode SS | |||
|---|---|---|---|
| Quadrant | BADHDUFLAG | Total packets | Discarded packets |
| A | 0 | 132 | 0 |
| B | 0 | 132 | 0 |
| C | 0 | 132 | 0 |
| D | 0 | 132 | 0 |
| Mode M9 | |||
|---|---|---|---|
| Quadrant | BADHDUFLAG | Total packets | Discarded packets |
| A | 0 | 14 | 0 |
| B | 0 | 15 | 0 |
| C | 0 | 15 | 0 |
| D | 0 | 15 | 0 |
| Mode M0 | |||
|---|---|---|---|
| Quadrant | BADHDUFLAG | Total packets | Discarded packets |
| A | 0 | 14889 | 2 |
| B | 0 | 15001 | 2 |
| C | 0 | 16333 | 2 |
| D | 0 | 17567 | 2 |
| Quadrant | Total seconds | Saturated seconds | Saturation percentage |
|---|---|---|---|
| A | 6456 | 94 | 1.456010% |
| B | 6456 | 106 | 1.641884% |
| C | 6456 | 253 | 3.918835% |
| D | 6456 | 266 | 4.120198% |
Noise dominated data is calculated using 1-second bins in cleaned event files. If a bin has >2000 counts, and if more than 50% of those come from <1% of pixels, then it is considered to be noise-dominated and hence unusable.
| Quadrant | # 1 sec bins | Bins with >0 counts | Bins with >2000 counts | High rate bins dominated by noise | Noise dominated (total time) | Noise dominated (detector-on time) | Marked lightcurve |
|---|---|---|---|---|---|---|---|
| A | 7751 | 6456 | 0 | 0 | 0.00% | 0.00% | 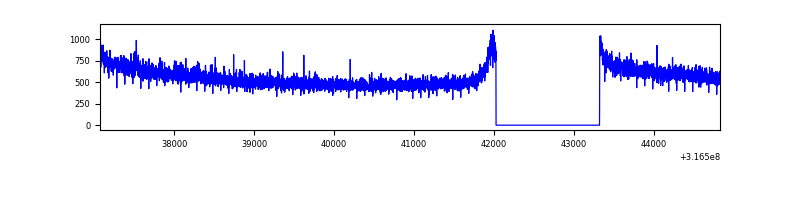 |
| B | 7751 | 6456 | 1 | 1 | 0.01% | 0.02% | 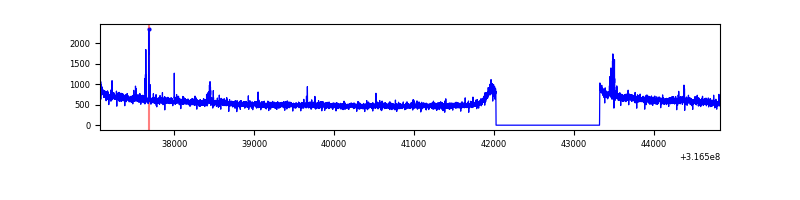 |
| C | 7751 | 6456 | 50 | 50 | 0.65% | 0.77% | 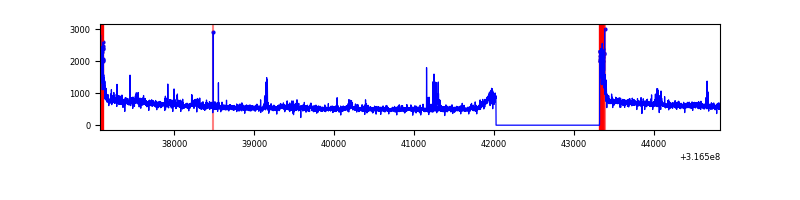 |
| D | 7751 | 6456 | 109 | 109 | 1.41% | 1.69% | 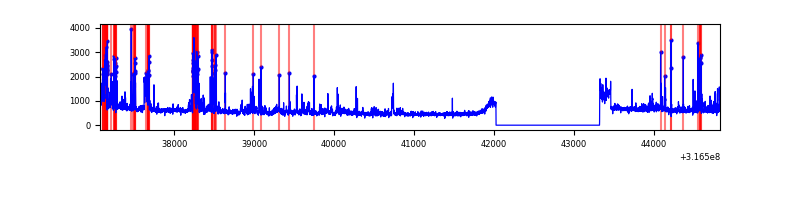 |
Top three noisy pixels from each quadrant. If the there are fewer than three noisy pixels in the level2.evt file, extra rows are filled as -1
| Pixel properties | Quadrant properties | ||||||
|---|---|---|---|---|---|---|---|
| Quadrant | DetID | PixID | Counts | Sigma | Mean | Median | Sigma |
| A | 12 | 227 | 10701 | 53.36 | 927 | 912 | 183.4 |
| A | 13 | 254 | 9590 | 47.3 | 927 | 912 | 183.4 |
| A | 0 | 226 | 8173 | 39.58 | 927 | 912 | 183.4 |
| B | 0 | 190 | 55935 | 324.31 | 916 | 896 | 169.7 |
| B | 12 | 111 | 19248 | 108.14 | 916 | 896 | 169.7 |
| B | 11 | 111 | 17421 | 97.37 | 916 | 896 | 169.7 |
| C | 0 | 10 | 312730 | 1531.29 | 894 | 904 | 203.6 |
| C | 14 | 238 | 143669 | 701.08 | 894 | 904 | 203.6 |
| C | 7 | 247 | 80172 | 389.26 | 894 | 904 | 203.6 |
| D | 1 | 52 | 339270 | 1548.34 | 909 | 885 | 218.5 |
| D | 12 | 233 | 338083 | 1542.91 | 909 | 885 | 218.5 |
| D | 7 | 238 | 183477 | 835.48 | 909 | 885 | 218.5 |
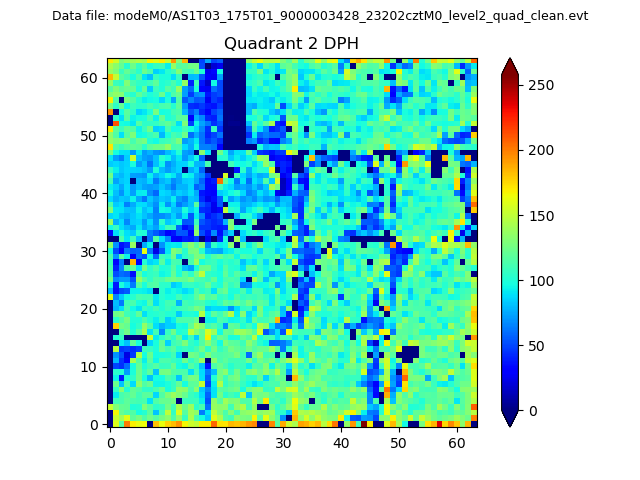
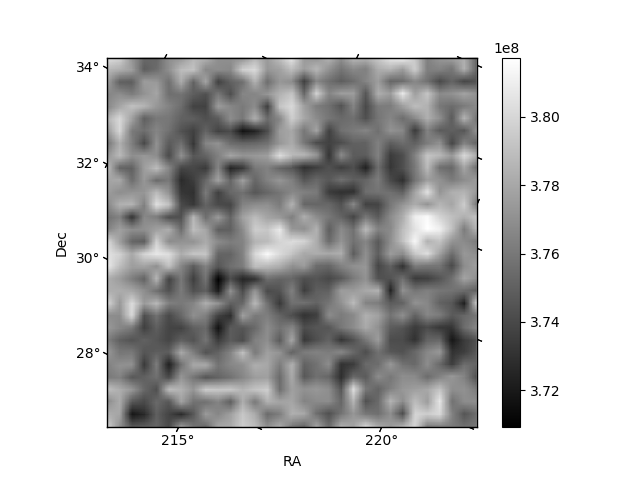
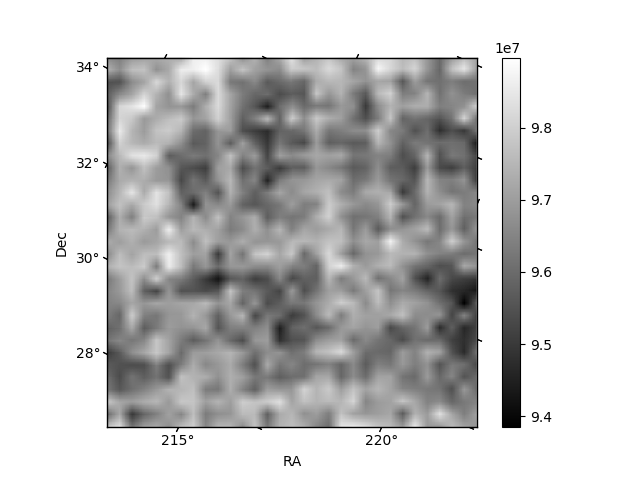
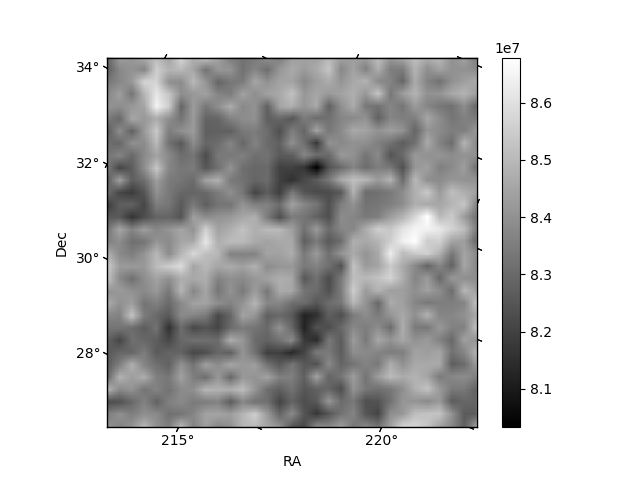
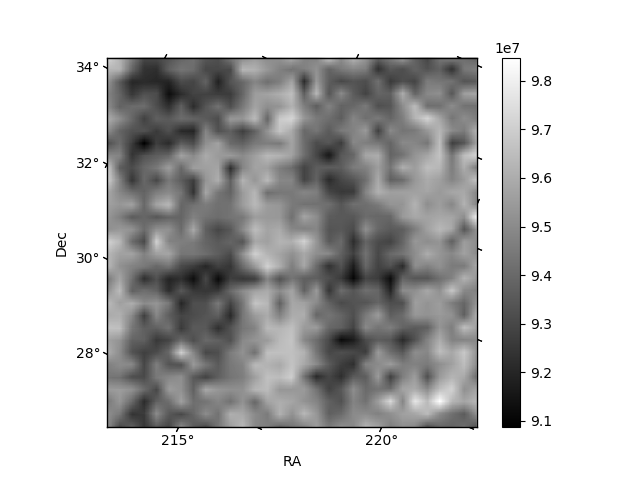
Histogram calculated using DETX and DETY for each event in the final _common_clean file
| Quadrant A | 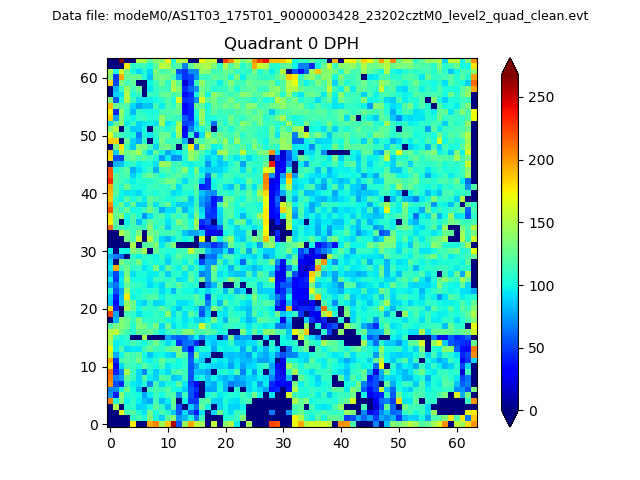 |
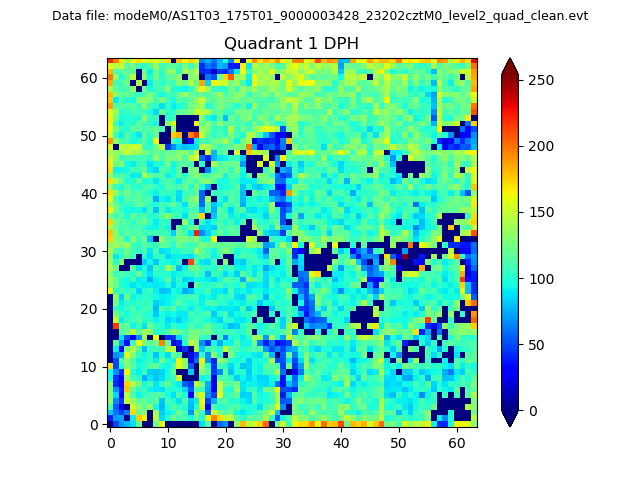 |
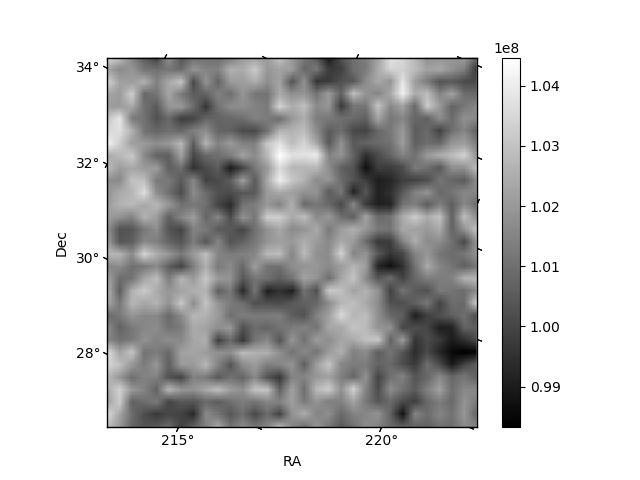
Quadrant B |
|---|---|---|---|
| Quadrant D | 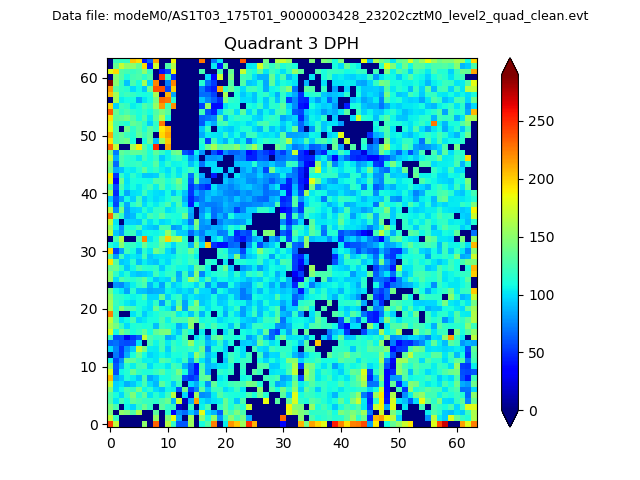 |
 |
Quadrant C |
| Plot type | Count rate plots | Images |
|---|---|---|
| Comparison with Poisson distribution Blue bars denote a histogram of data divided into 1 sec bins. Red curve is a Poisson curve with rate = median count rate of data. |
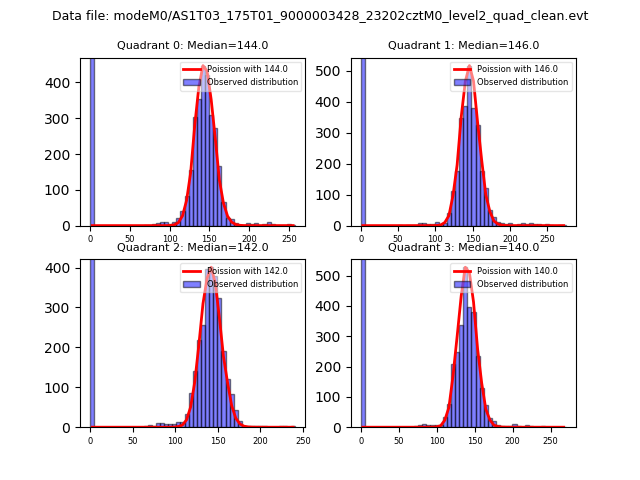 |
 |
| Quadrant-wise count rates Data is divided into 100 sec bins |
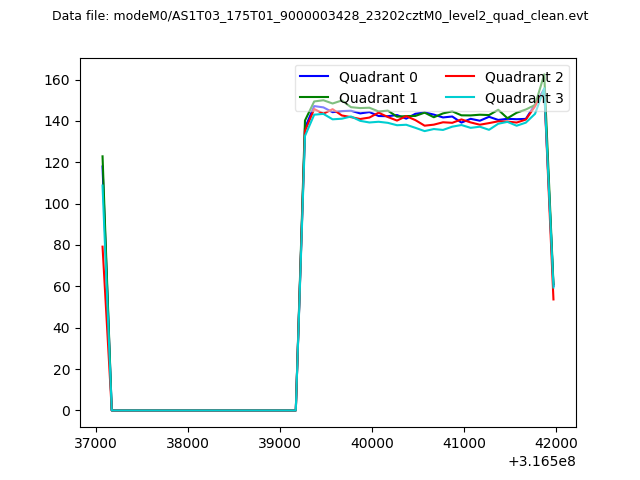 |
|
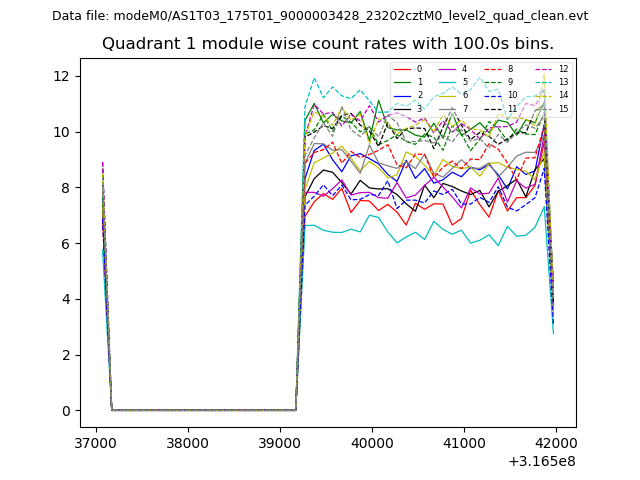
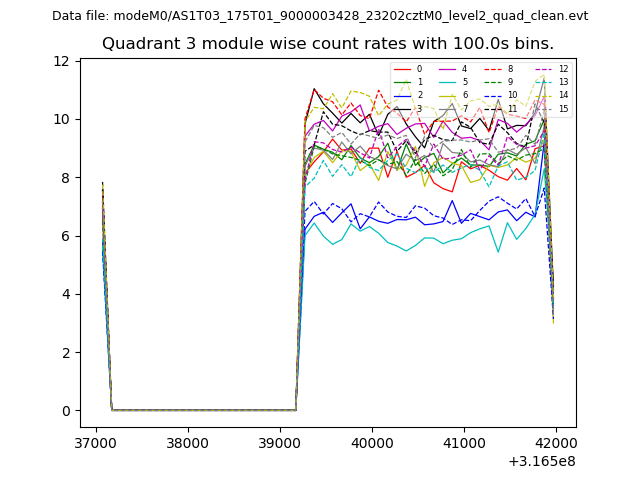
| Module-wise count rates for Quadrant A Data is divided into 100 sec bins |
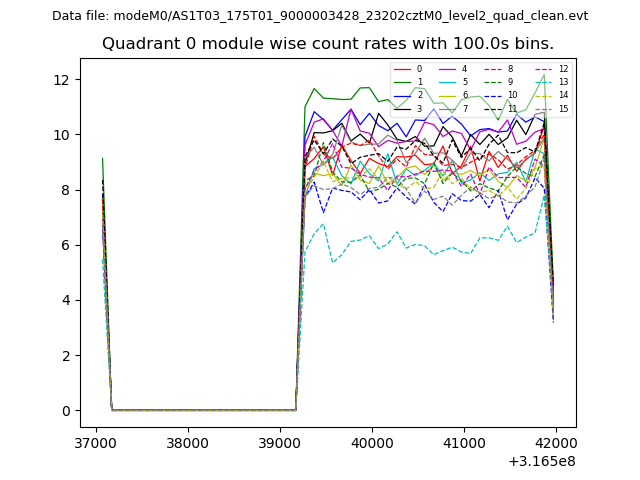 |
 |
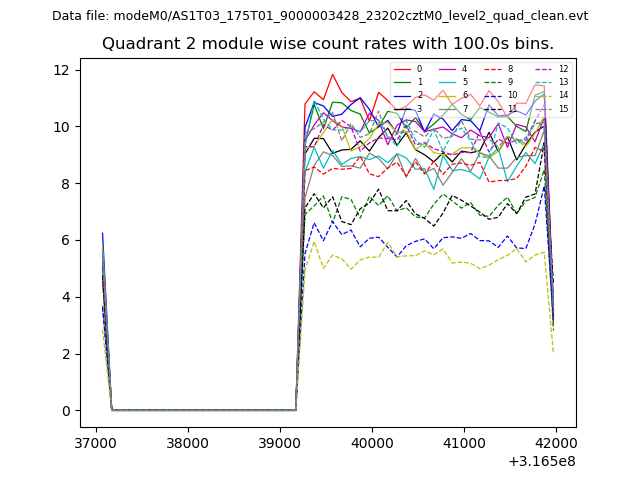
| Module-wise count rates for Quadrant B Data is divided into 100 sec bins |
 |
 |
| Module-wise count rates for Quadrant C Data is divided into 100 sec bins |
 |
 |
| Module-wise count rates for Quadrant D Data is divided into 100 sec bins |
 |
 |
| Parameter | Plot |
|---|---|
| CZT HV Monitor | 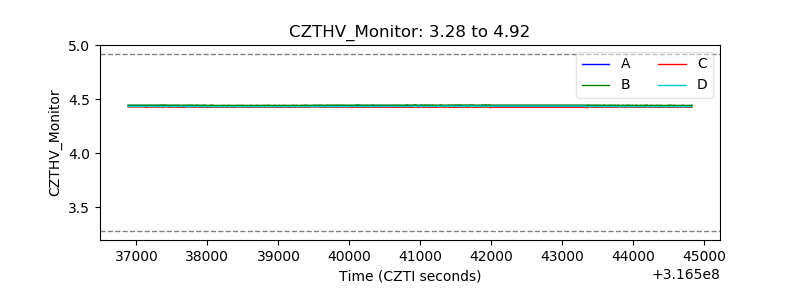 |
| D_VDD | 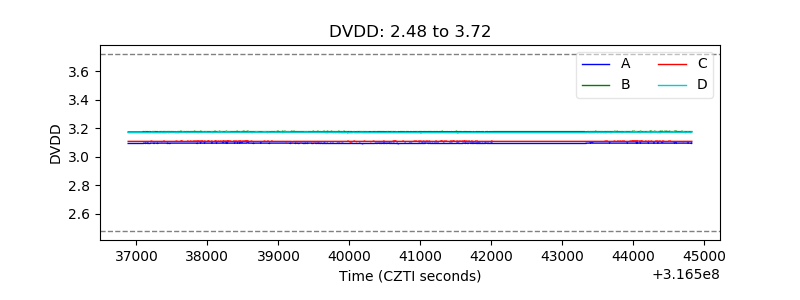 |
| Temperature 1 | 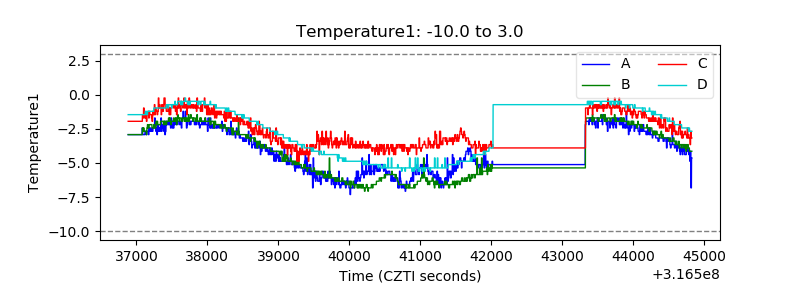 |
| Veto HV Monitor | 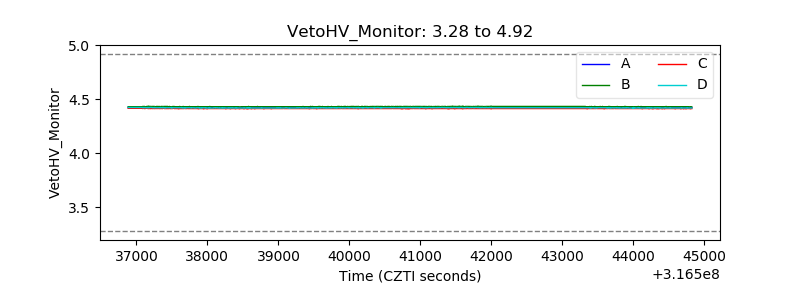 |
| Veto LLD | 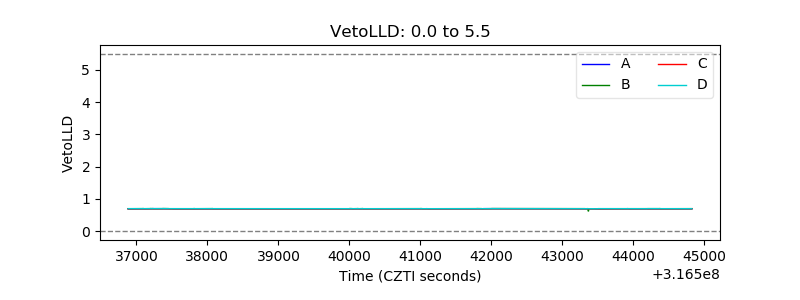 |
| Alpha Counter | 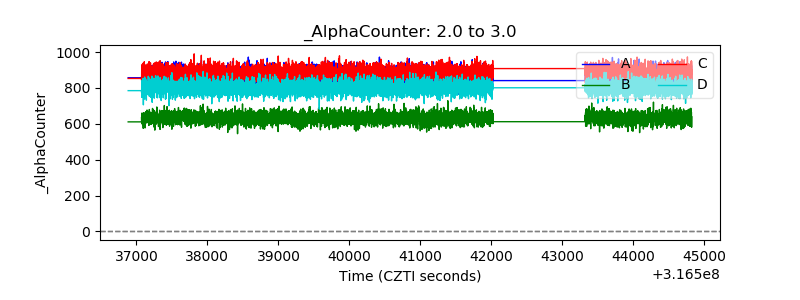 |
| _CPM_Rate | 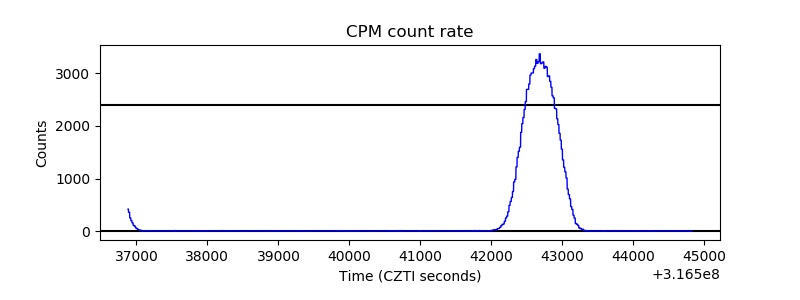 |
| CZT Counter | 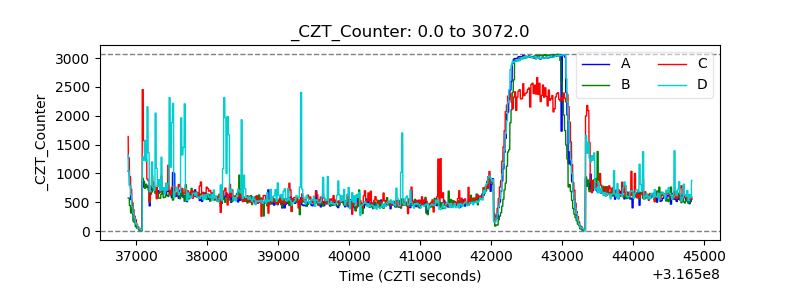 |
| +2.5 Volts monitor | 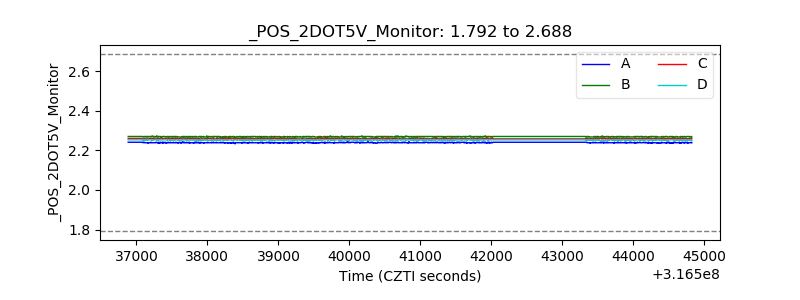 |
| +5 Volts monitor |  |
| _ROLL_ROT | 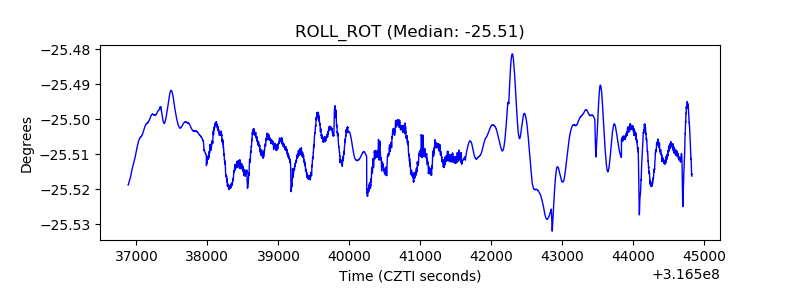 |
| _Roll_DEC | 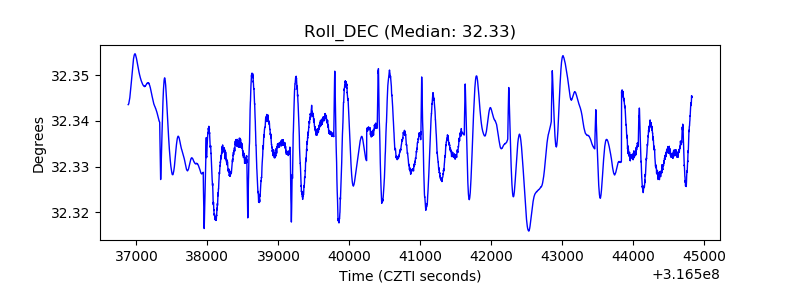 |
| _Roll_RA | 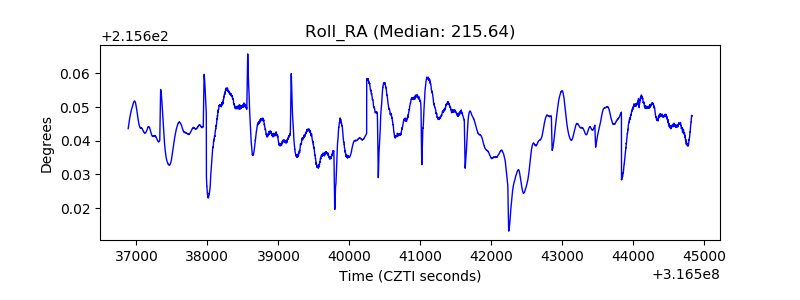 |
| Veto Counter | 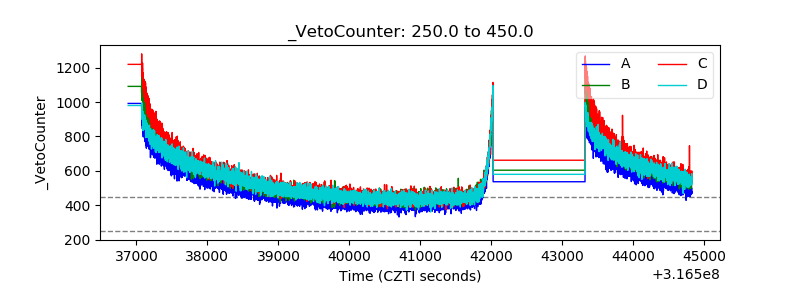 |