| Param | Original file | Final file |
|---|---|---|
| Filename | modeM0/AS1T03_175T01_9000003428_23203cztM0_level2.evt | modeM0/AS1T03_175T01_9000003428_23203cztM0_level2_quad_clean.evt |
| Size (bytes) | 466,848,000 | 73,117,440 |
| Size | 445.2 MB | 69.7 MB |
| Events in quadrant A | 3,218,634 | 450,536 |
| Events in quadrant B | 3,275,424 | 459,149 |
| Events in quadrant C | 3,495,381 | 448,689 |
| Events in quadrant D | 3,744,654 | 439,302 |
| Mode SS | |||
|---|---|---|---|
| Quadrant | BADHDUFLAG | Total packets | Discarded packets |
| A | 0 | 122 | 0 |
| B | 0 | 122 | 0 |
| C | 0 | 122 | 0 |
| D | 0 | 122 | 0 |
| Mode M9 | |||
|---|---|---|---|
| Quadrant | BADHDUFLAG | Total packets | Discarded packets |
| A | 0 | 13 | 0 |
| B | 0 | 13 | 0 |
| C | 0 | 13 | 0 |
| D | 0 | 13 | 0 |
| Mode M0 | |||
|---|---|---|---|
| Quadrant | BADHDUFLAG | Total packets | Discarded packets |
| A | 0 | 13431 | 1 |
| B | 0 | 13569 | 1 |
| C | 0 | 14399 | 1 |
| D | 0 | 15252 | 1 |
| Quadrant | Total seconds | Saturated seconds | Saturation percentage |
|---|---|---|---|
| A | 5955 | 62 | 1.041142% |
| B | 5955 | 83 | 1.393787% |
| C | 5955 | 163 | 2.737196% |
| D | 5956 | 147 | 2.468099% |
Noise dominated data is calculated using 1-second bins in cleaned event files. If a bin has >2000 counts, and if more than 50% of those come from <1% of pixels, then it is considered to be noise-dominated and hence unusable.
| Quadrant | # 1 sec bins | Bins with >0 counts | Bins with >2000 counts | High rate bins dominated by noise | Noise dominated (total time) | Noise dominated (detector-on time) | Marked lightcurve |
|---|---|---|---|---|---|---|---|
| A | 7320 | 5956 | 0 | 0 | 0.00% | 0.00% | 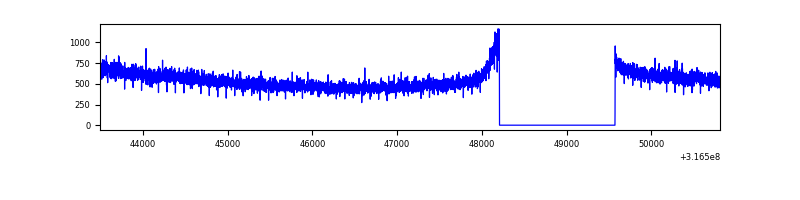 |
| B | 7320 | 5956 | 0 | 0 | 0.00% | 0.00% | 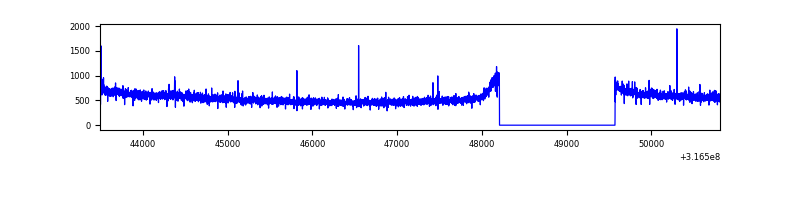 |
| C | 7320 | 5956 | 22 | 22 | 0.30% | 0.37% | 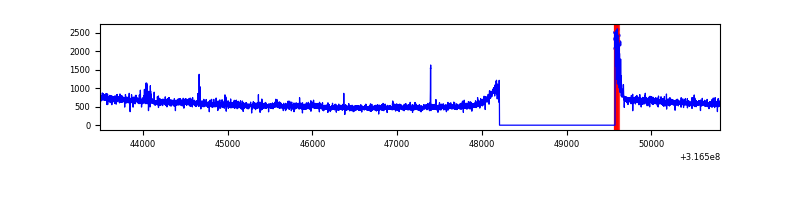 |
| D | 7321 | 5956 | 49 | 49 | 0.67% | 0.82% | 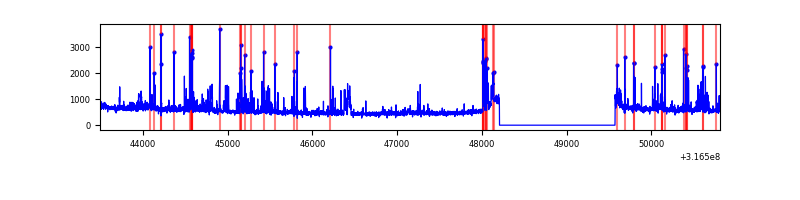 |
Top three noisy pixels from each quadrant. If the there are fewer than three noisy pixels in the level2.evt file, extra rows are filled as -1
| Pixel properties | Quadrant properties | ||||||
|---|---|---|---|---|---|---|---|
| Quadrant | DetID | PixID | Counts | Sigma | Mean | Median | Sigma |
| A | 13 | 254 | 8803 | 48.12 | 835 | 820 | 165.9 |
| A | 0 | 226 | 7054 | 37.58 | 835 | 820 | 165.9 |
| A | 3 | 137 | 6768 | 35.85 | 835 | 820 | 165.9 |
| B | 0 | 190 | 20830 | 129.49 | 832 | 813 | 154.6 |
| B | 12 | 111 | 17455 | 107.66 | 832 | 813 | 154.6 |
| B | 11 | 111 | 15496 | 94.99 | 832 | 813 | 154.6 |
| C | 0 | 10 | 145198 | 774.07 | 813 | 822 | 186.5 |
| C | 14 | 238 | 129733 | 691.15 | 813 | 822 | 186.5 |
| C | 7 | 247 | 40579 | 213.16 | 813 | 822 | 186.5 |
| D | 12 | 233 | 227029 | 1146.64 | 827 | 806 | 197.3 |
| D | 1 | 52 | 161867 | 816.36 | 827 | 806 | 197.3 |
| D | 12 | 217 | 104465 | 525.41 | 827 | 806 | 197.3 |
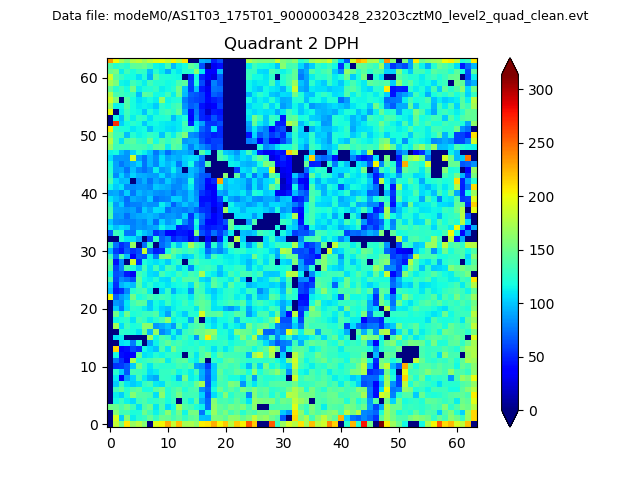
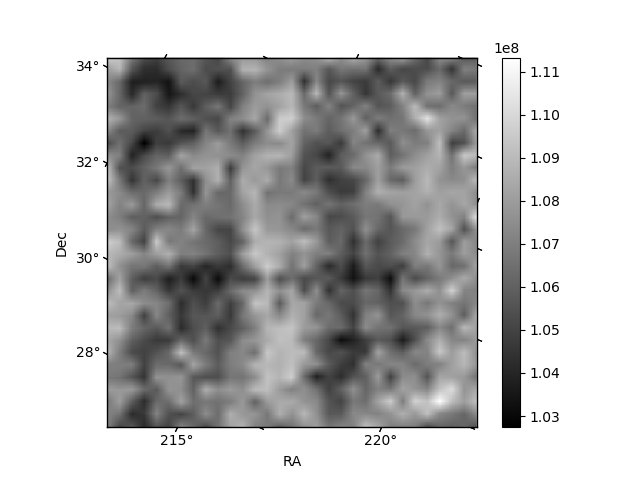
Histogram calculated using DETX and DETY for each event in the final _common_clean file
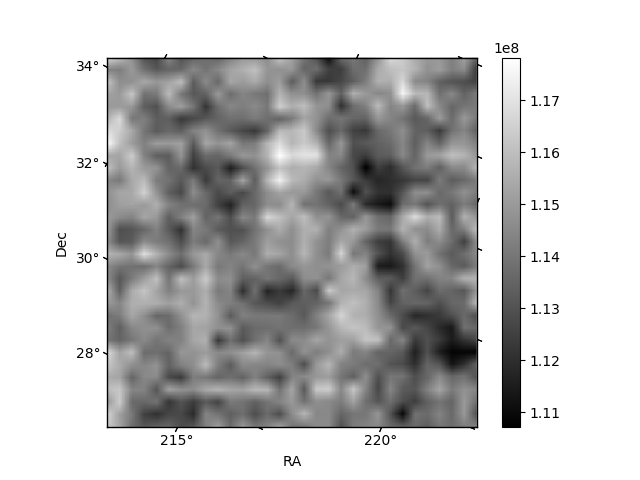
| Quadrant A | 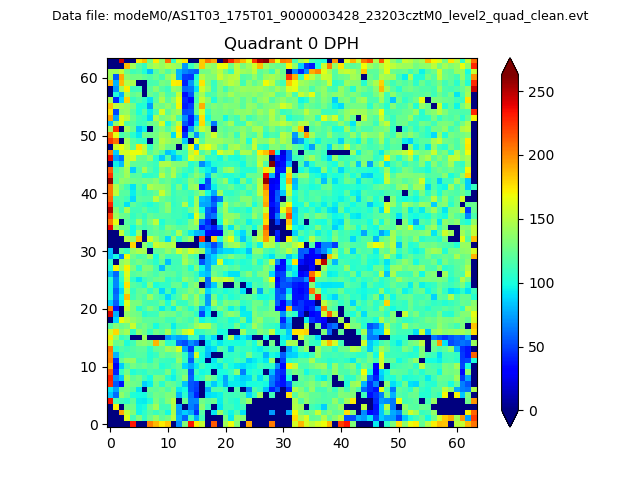 |
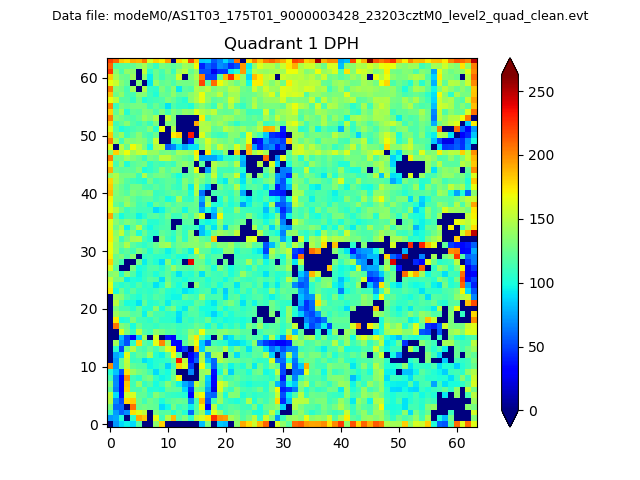 |
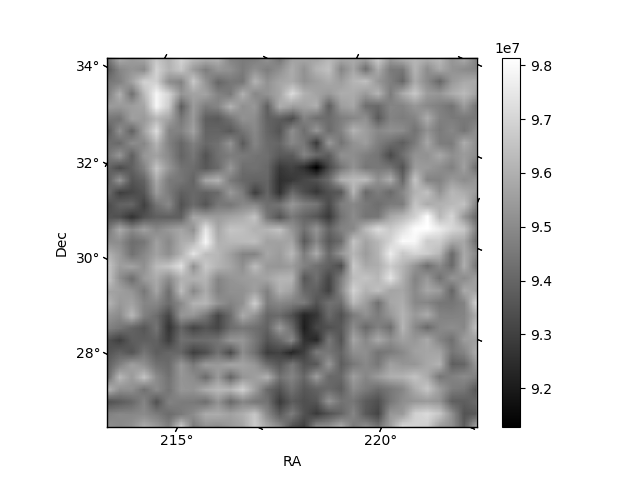
Quadrant B |
|---|---|---|---|
| Quadrant D | 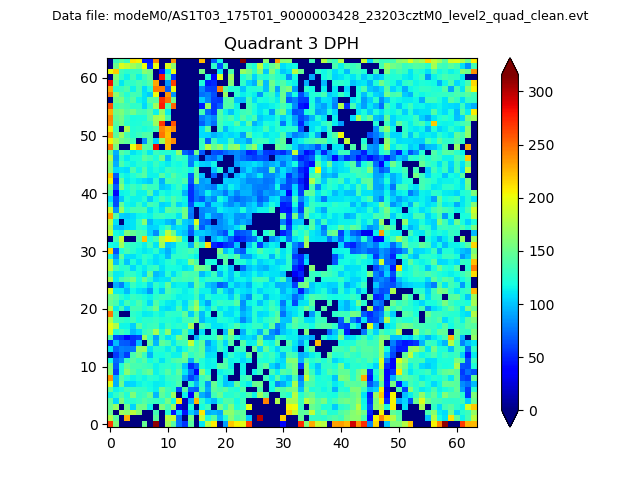 |
 |
Quadrant C |
| Plot type | Count rate plots | Images |
|---|---|---|
| Comparison with Poisson distribution Blue bars denote a histogram of data divided into 1 sec bins. Red curve is a Poisson curve with rate = median count rate of data. |
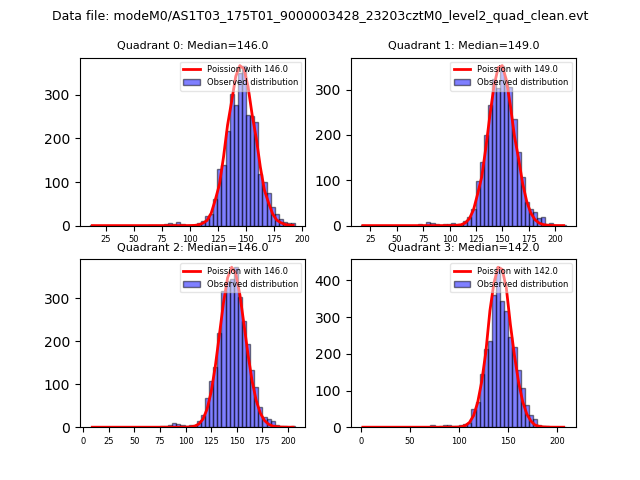 |
 |
| Quadrant-wise count rates Data is divided into 100 sec bins |
 |
|
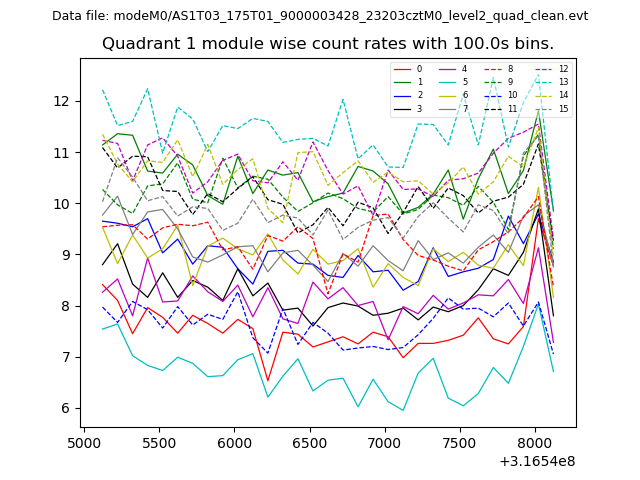
| Module-wise count rates for Quadrant A Data is divided into 100 sec bins |
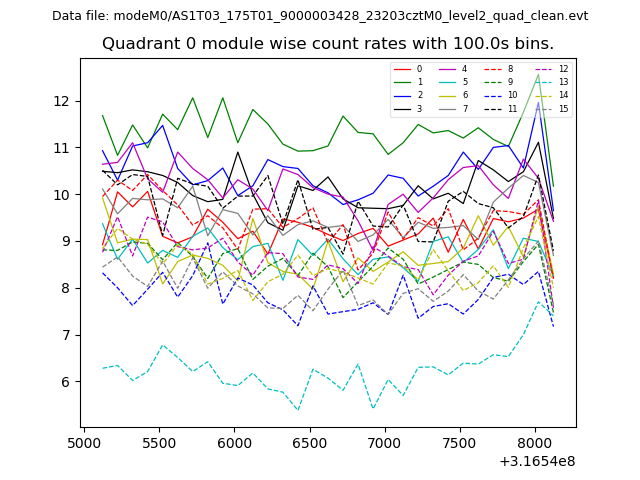 |
 |
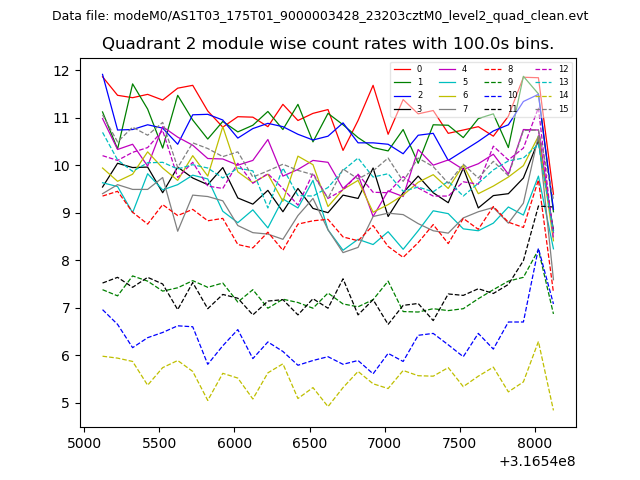
| Module-wise count rates for Quadrant B Data is divided into 100 sec bins |
 |
 |
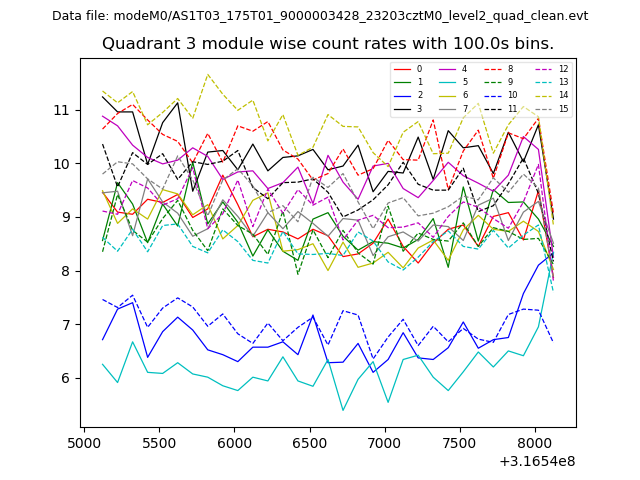
| Module-wise count rates for Quadrant C Data is divided into 100 sec bins |
 |
 |
| Module-wise count rates for Quadrant D Data is divided into 100 sec bins |
 |
 |
| Parameter | Plot |
|---|---|
| CZT HV Monitor | 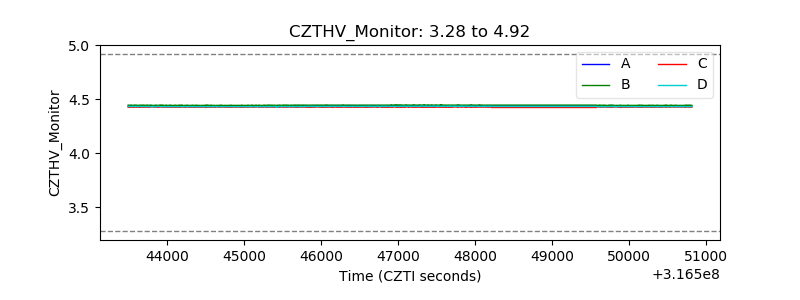 |
| D_VDD | 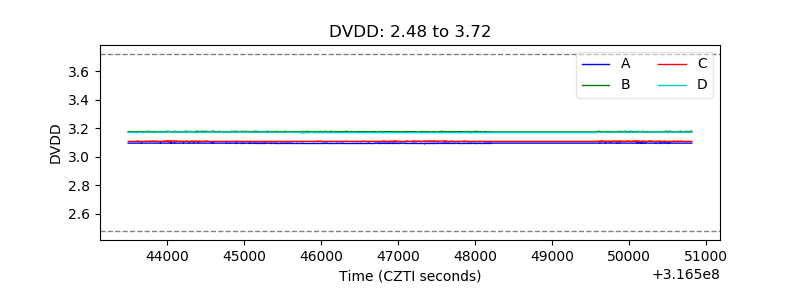 |
| Temperature 1 | 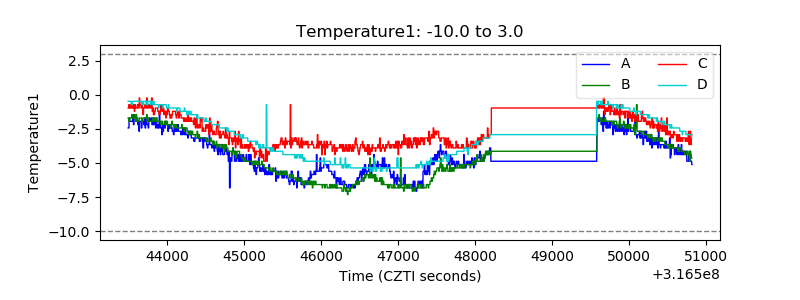 |
| Veto HV Monitor | 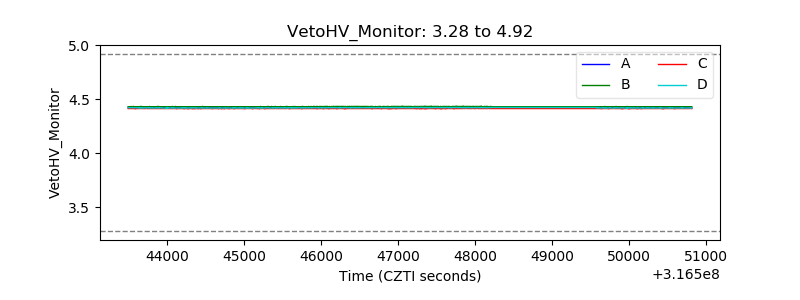 |
| Veto LLD | 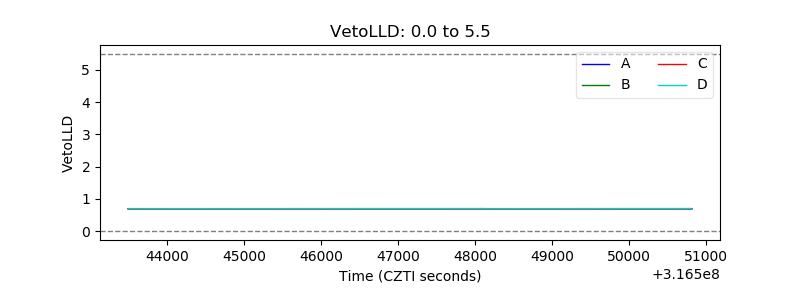 |
| Alpha Counter |  |
| _CPM_Rate | 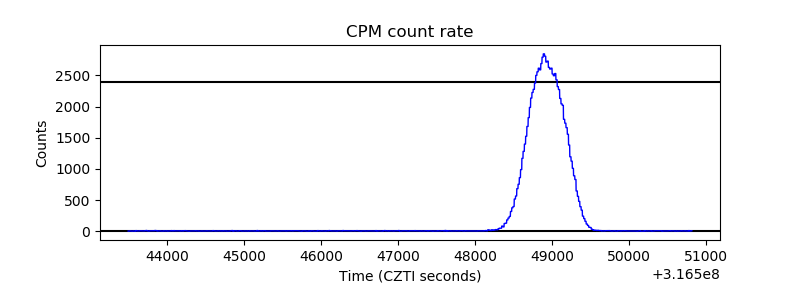 |
| CZT Counter | 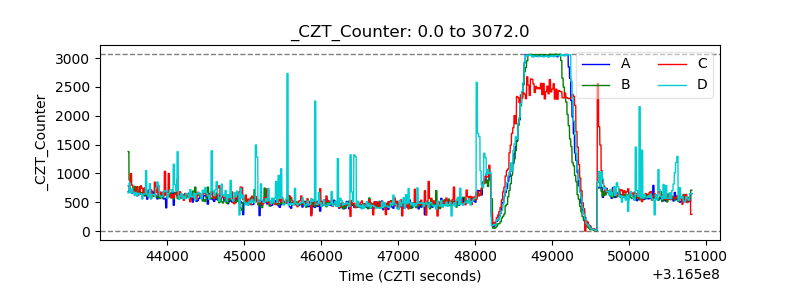 |
| +2.5 Volts monitor |  |
| +5 Volts monitor |  |
| _ROLL_ROT | 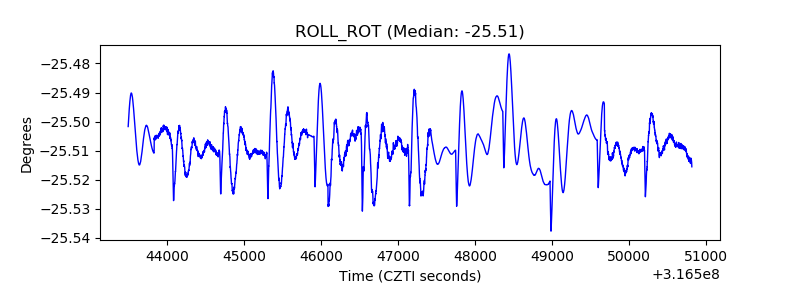 |
| _Roll_DEC | 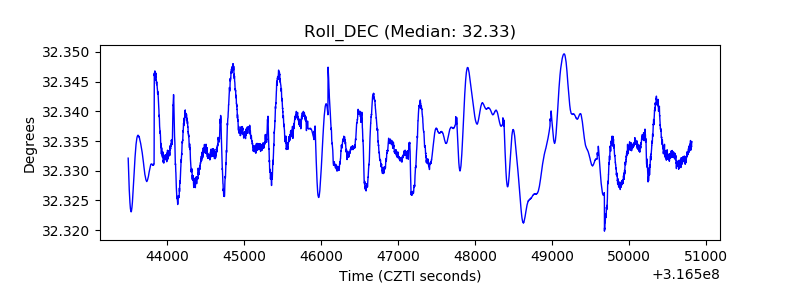 |
| _Roll_RA | 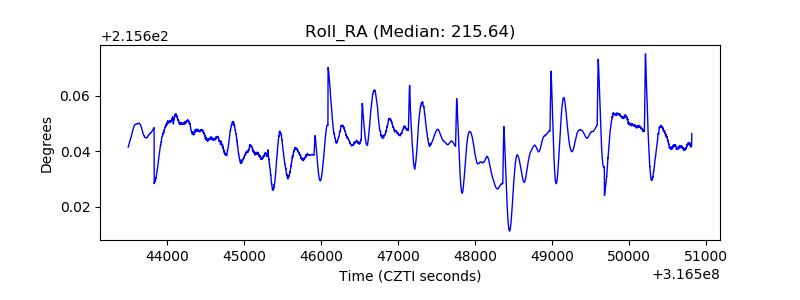 |
| Veto Counter | 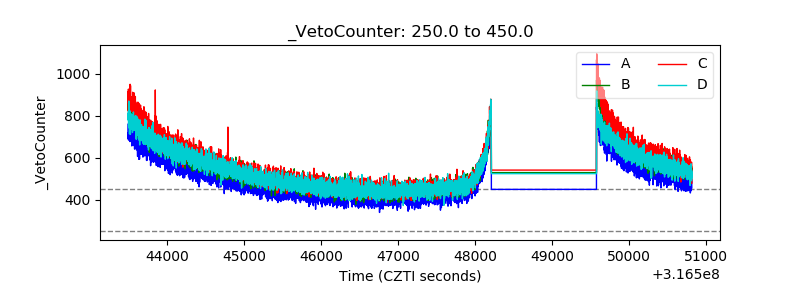 |