| Param | Original file | Final file |
|---|---|---|
| Filename | modeM0/AS1T03_175T01_9000003428_23205cztM0_level2.evt | modeM0/AS1T03_175T01_9000003428_23205cztM0_level2_quad_clean.evt |
| Size (bytes) | 504,204,480 | 86,495,040 |
| Size | 480.8 MB | 82.5 MB |
| Events in quadrant A | 3,279,575 | 548,295 |
| Events in quadrant B | 3,355,695 | 558,379 |
| Events in quadrant C | 4,561,022 | 543,762 |
| Events in quadrant D | 3,650,380 | 533,770 |
| Mode SS | |||
|---|---|---|---|
| Quadrant | BADHDUFLAG | Total packets | Discarded packets |
| A | 0 | 126 | 0 |
| B | 0 | 126 | 0 |
| C | 0 | 126 | 0 |
| D | 0 | 126 | 0 |
| Mode M9 | |||
|---|---|---|---|
| Quadrant | BADHDUFLAG | Total packets | Discarded packets |
| A | 0 | 21 | 0 |
| B | 0 | 22 | 0 |
| C | 0 | 22 | 0 |
| D | 0 | 22 | 0 |
| Mode M0 | |||
|---|---|---|---|
| Quadrant | BADHDUFLAG | Total packets | Discarded packets |
| A | 0 | 13712 | 2 |
| B | 0 | 13896 | 2 |
| C | 0 | 17617 | 2 |
| D | 0 | 15127 | 2 |
| Quadrant | Total seconds | Saturated seconds | Saturation percentage |
|---|---|---|---|
| A | 6234 | 109 | 1.748476% |
| B | 6234 | 137 | 2.197626% |
| C | 6234 | 770 | 12.351620% |
| D | 6234 | 155 | 2.486365% |
Noise dominated data is calculated using 1-second bins in cleaned event files. If a bin has >2000 counts, and if more than 50% of those come from <1% of pixels, then it is considered to be noise-dominated and hence unusable.
| Quadrant | # 1 sec bins | Bins with >0 counts | Bins with >2000 counts | High rate bins dominated by noise | Noise dominated (total time) | Noise dominated (detector-on time) | Marked lightcurve |
|---|---|---|---|---|---|---|---|
| A | 7489 | 6235 | 0 | 0 | 0.00% | 0.00% | 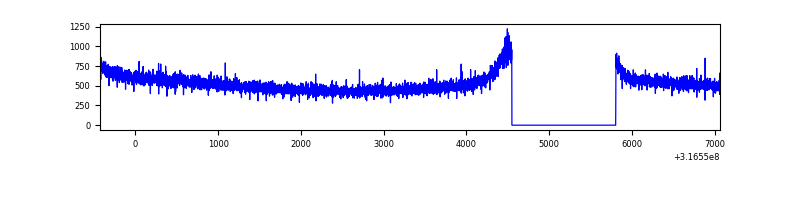 |
| B | 7489 | 6234 | 1 | 1 | 0.01% | 0.02% | 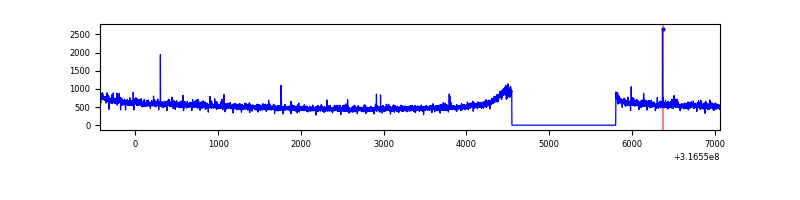 |
| C | 7489 | 6234 | 434 | 434 | 5.80% | 6.96% | 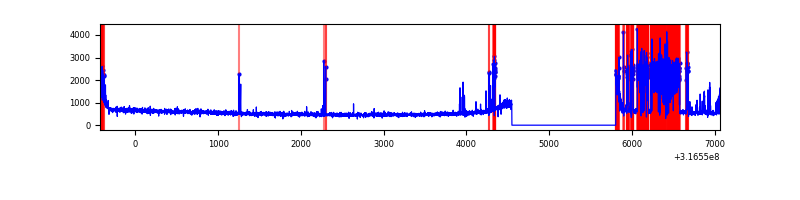 |
| D | 7489 | 6234 | 42 | 42 | 0.56% | 0.67% | 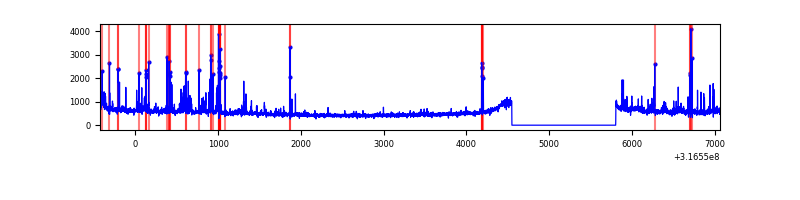 |
Top three noisy pixels from each quadrant. If the there are fewer than three noisy pixels in the level2.evt file, extra rows are filled as -1
| Pixel properties | Quadrant properties | ||||||
|---|---|---|---|---|---|---|---|
| Quadrant | DetID | PixID | Counts | Sigma | Mean | Median | Sigma |
| A | 13 | 254 | 9749 | 52.68 | 850 | 833 | 169.2 |
| A | 0 | 226 | 7204 | 37.64 | 850 | 833 | 169.2 |
| A | 3 | 137 | 7054 | 36.75 | 850 | 833 | 169.2 |
| B | 12 | 111 | 18716 | 111.8 | 850 | 831 | 160.0 |
| B | 11 | 111 | 16557 | 98.3 | 850 | 831 | 160.0 |
| B | 14 | 111 | 14443 | 85.09 | 850 | 831 | 160.0 |
| C | 9 | 15 | 1055537 | 5763.79 | 794 | 801 | 183.0 |
| C | 0 | 10 | 190968 | 1039.2 | 794 | 801 | 183.0 |
| C | 14 | 238 | 125639 | 682.2 | 794 | 801 | 183.0 |
| D | 1 | 52 | 193181 | 950.29 | 841 | 820 | 202.4 |
| D | 12 | 233 | 106994 | 524.51 | 841 | 820 | 202.4 |
| D | 13 | 153 | 84231 | 412.06 | 841 | 820 | 202.4 |
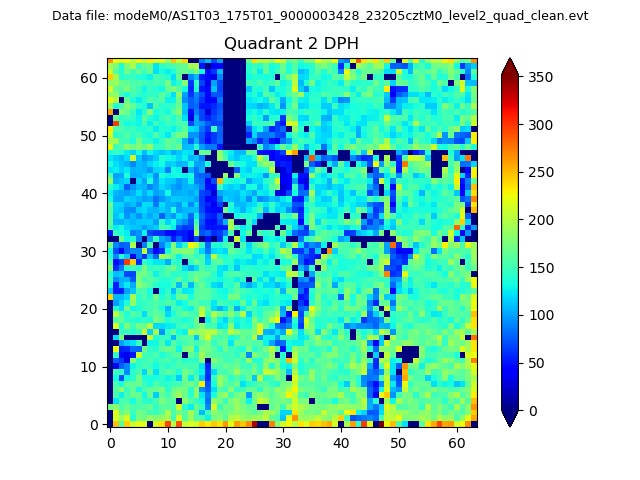
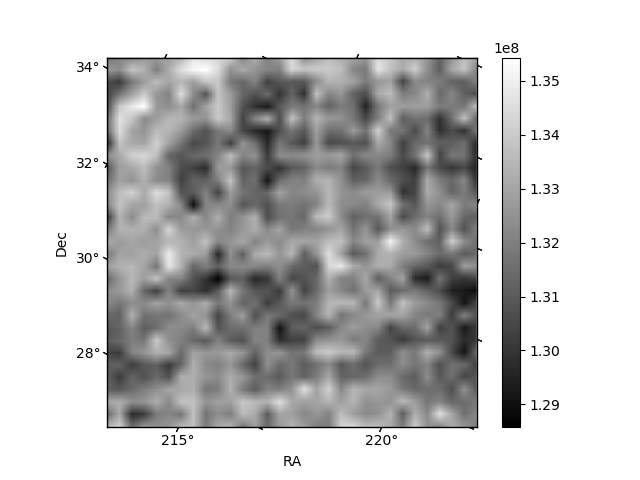
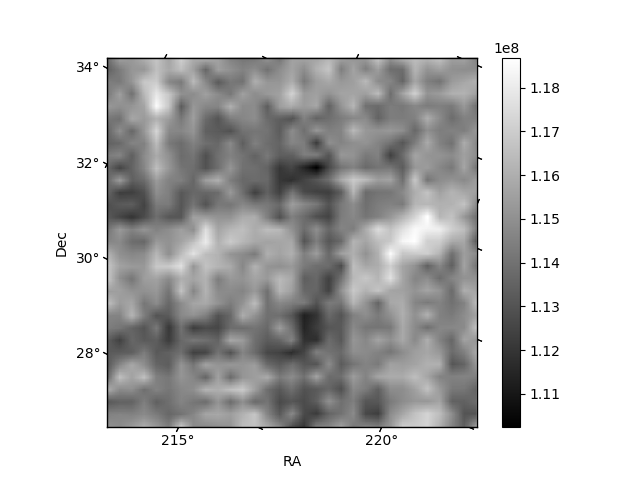
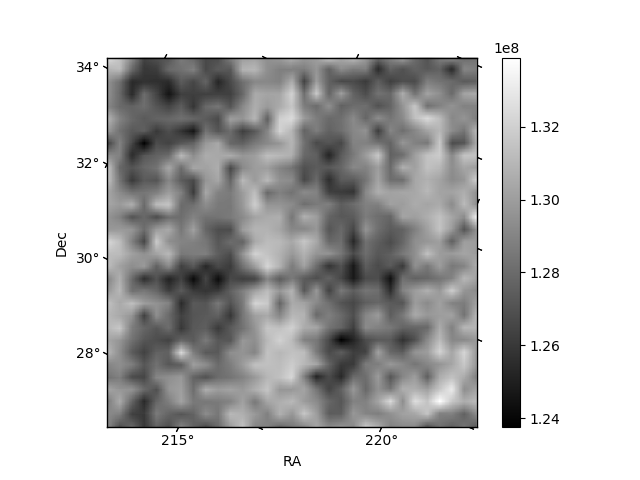
Histogram calculated using DETX and DETY for each event in the final _common_clean file
| Quadrant A |  |
 |
Quadrant B |
|---|---|---|---|
| Quadrant D | 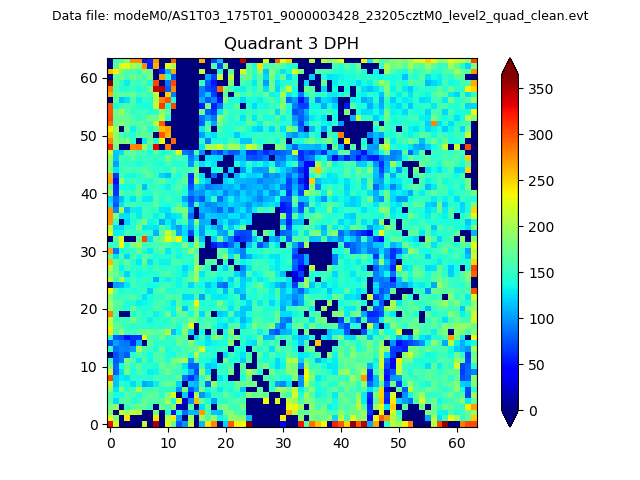 |
 |
Quadrant C |
| Plot type | Count rate plots | Images |
|---|---|---|
| Comparison with Poisson distribution Blue bars denote a histogram of data divided into 1 sec bins. Red curve is a Poisson curve with rate = median count rate of data. |
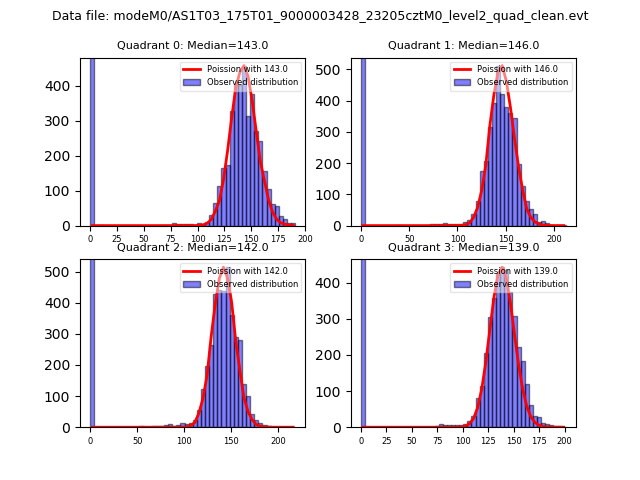 |
 |
| Quadrant-wise count rates Data is divided into 100 sec bins |
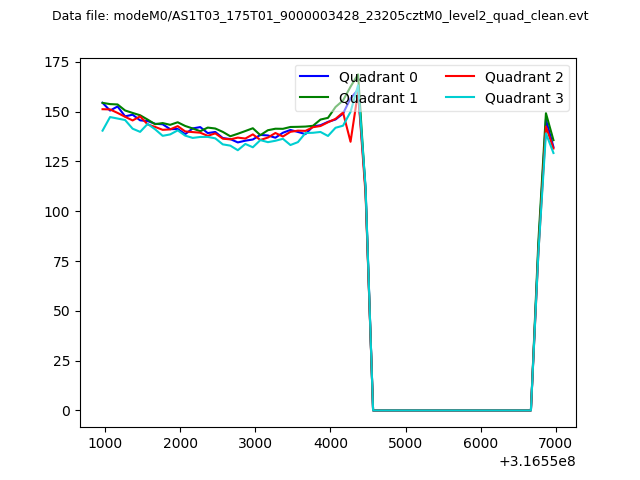 |
|
| Module-wise count rates for Quadrant A Data is divided into 100 sec bins |
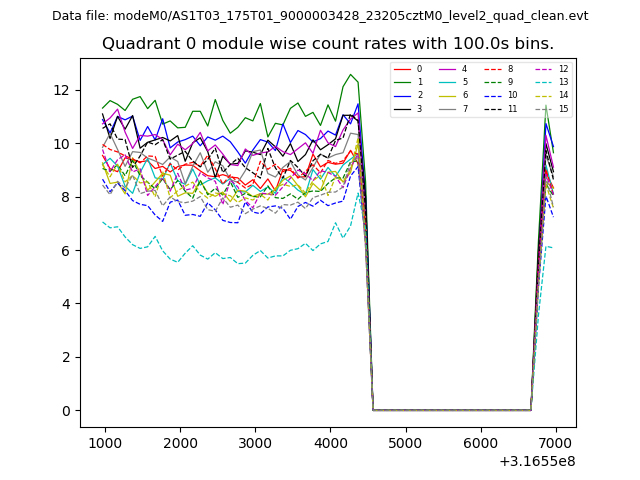 |
 |
| Module-wise count rates for Quadrant B Data is divided into 100 sec bins |
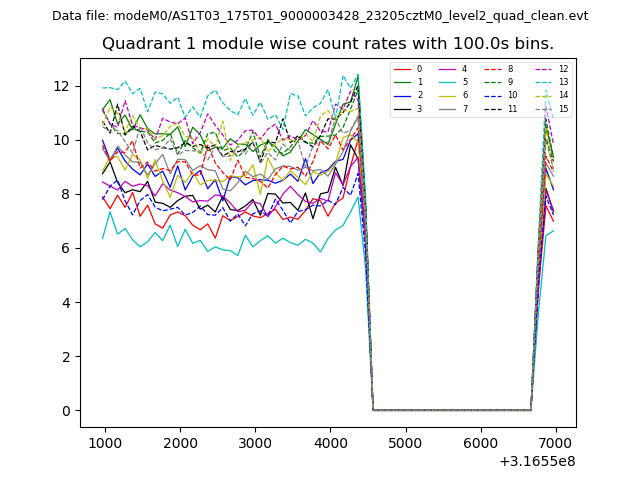 |
 |
| Module-wise count rates for Quadrant C Data is divided into 100 sec bins |
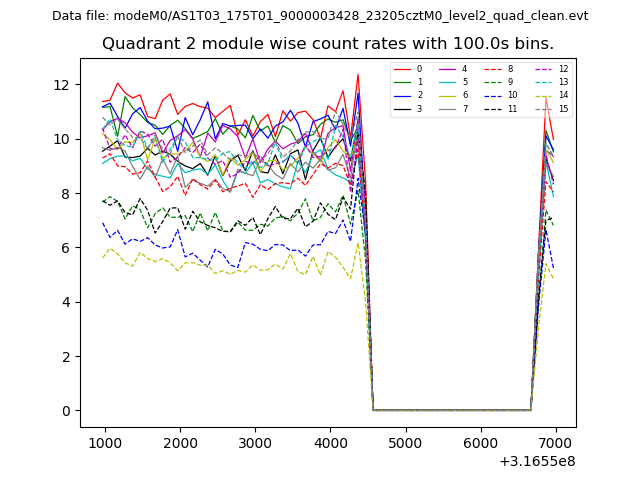 |
 |
| Module-wise count rates for Quadrant D Data is divided into 100 sec bins |
 |
 |
| Parameter | Plot |
|---|---|
| CZT HV Monitor | 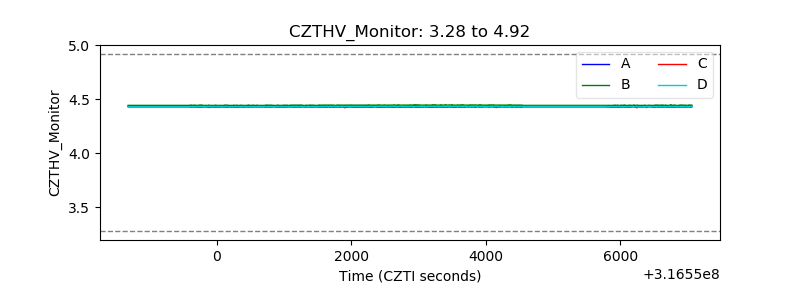 |
| D_VDD | 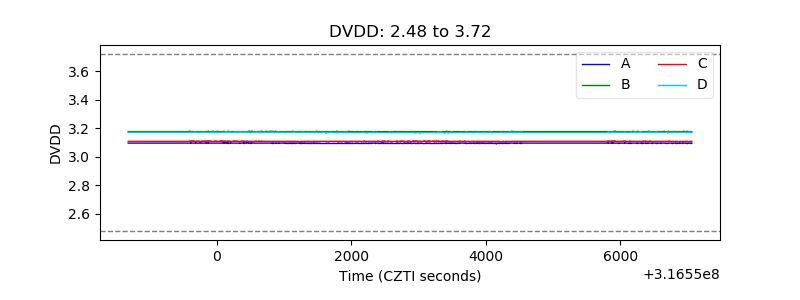 |
| Temperature 1 | 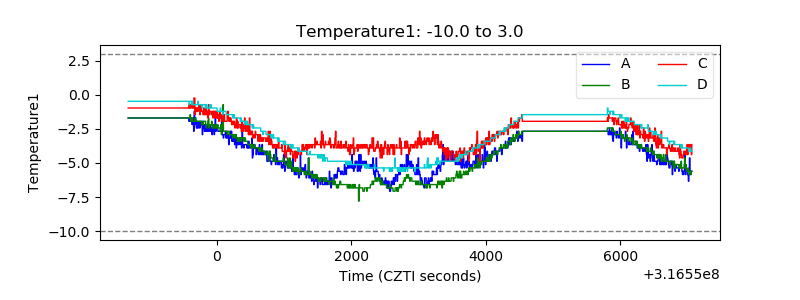 |
| Veto HV Monitor | 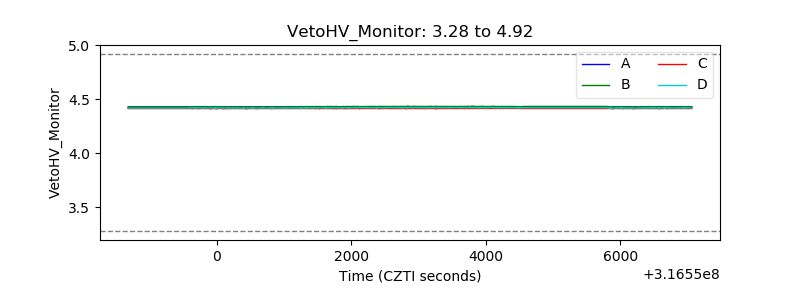 |
| Veto LLD | 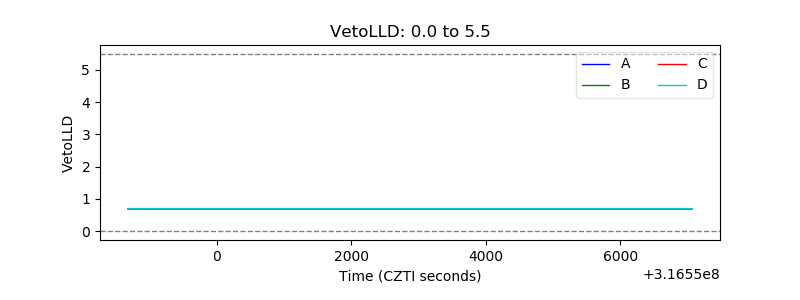 |
| Alpha Counter | 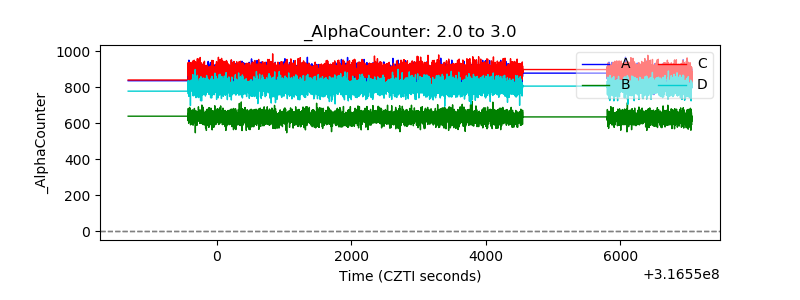 |
| _CPM_Rate | 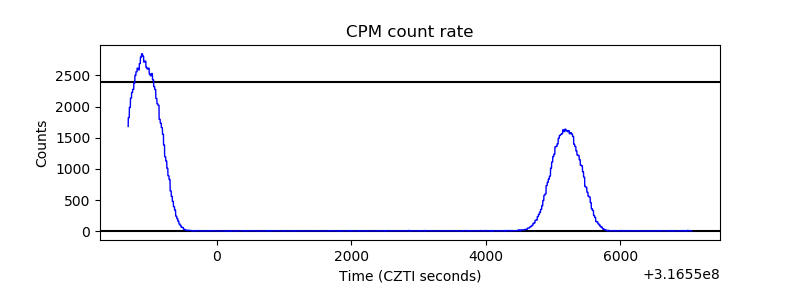 |
| CZT Counter | 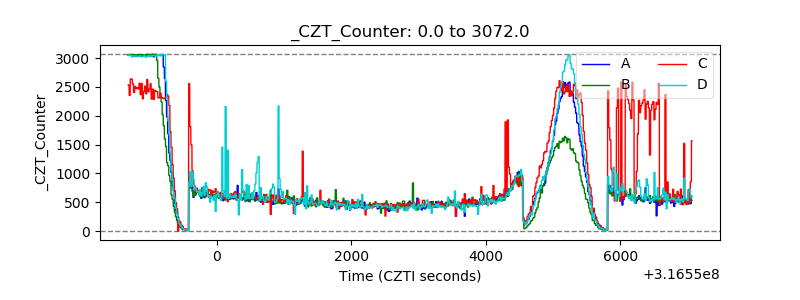 |
| +2.5 Volts monitor | 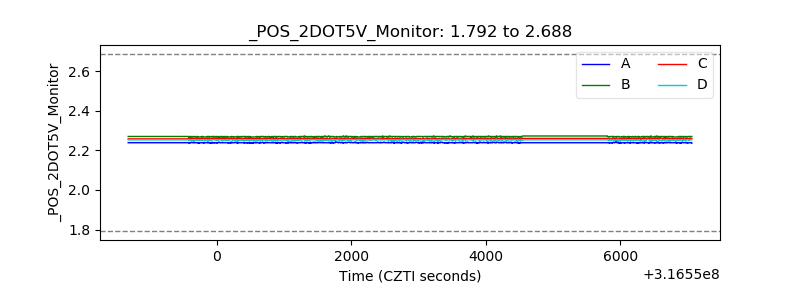 |
| +5 Volts monitor | 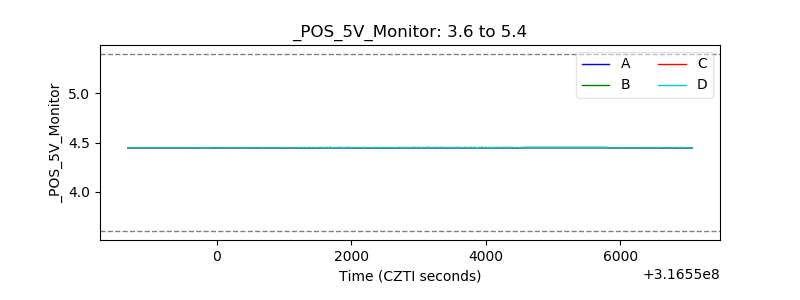 |
| _ROLL_ROT | 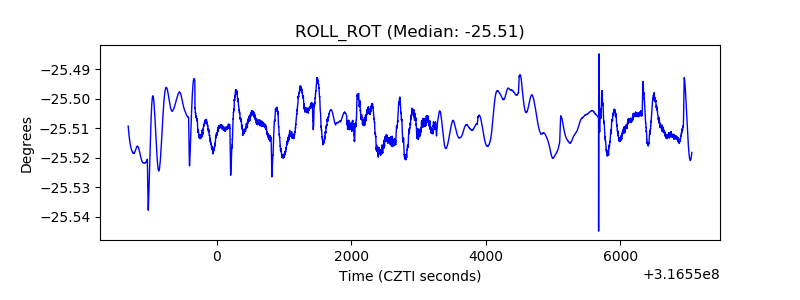 |
| _Roll_DEC | 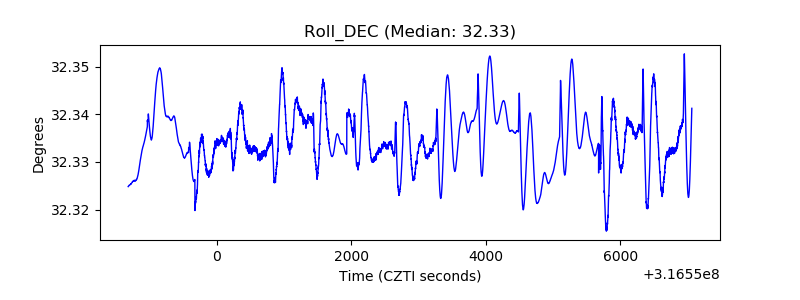 |
| _Roll_RA | 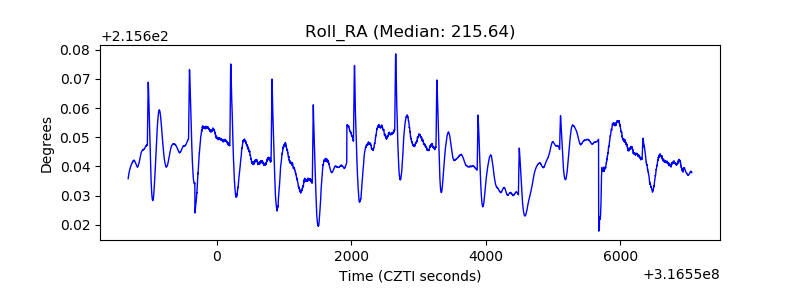 |
| Veto Counter | 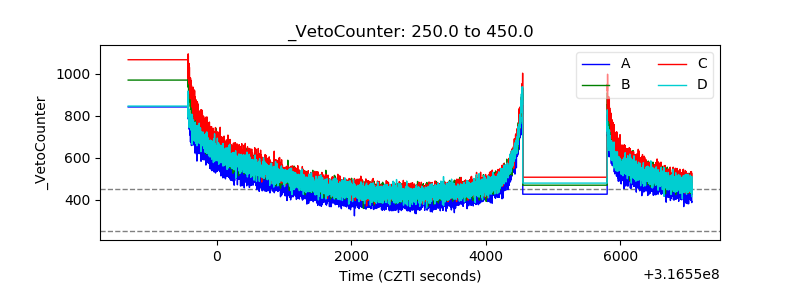 |