| Param | Original file | Final file |
|---|---|---|
| Filename | modeM0/AS1A08_008T02_9000003430_23207cztM0_level2.evt | modeM0/AS1A08_008T02_9000003430_23207cztM0_level2_quad_clean.evt |
| Size (bytes) | 543,136,320 | 140,356,800 |
| Size | 518.0 MB | 133.9 MB |
| Events in quadrant A | 3,640,141 | 947,761 |
| Events in quadrant B | 3,958,803 | 951,758 |
| Events in quadrant C | 3,899,861 | 910,922 |
| Events in quadrant D | 4,411,580 | 889,357 |
| Mode M9 | |||
|---|---|---|---|
| Quadrant | BADHDUFLAG | Total packets | Discarded packets |
| A | 0 | 9 | 0 |
| B | 0 | 9 | 0 |
| C | 0 | 9 | 0 |
| D | 0 | 9 | 0 |
| Mode M0 | |||
|---|---|---|---|
| Quadrant | BADHDUFLAG | Total packets | Discarded packets |
| A | 0 | 16236 | 2 |
| B | 0 | 17091 | 2 |
| C | 0 | 16705 | 2 |
| D | 0 | 18566 | 2 |
| Mode SS | |||
|---|---|---|---|
| Quadrant | BADHDUFLAG | Total packets | Discarded packets |
| A | 0 | 164 | 0 |
| B | 0 | 164 | 0 |
| C | 0 | 164 | 0 |
| D | 0 | 164 | 0 |
| Quadrant | Total seconds | Saturated seconds | Saturation percentage |
|---|---|---|---|
| A | 7925 | 85 | 1.072555% |
| B | 7926 | 218 | 2.750442% |
| C | 7926 | 221 | 2.788292% |
| D | 7926 | 225 | 2.838759% |
Noise dominated data is calculated using 1-second bins in cleaned event files. If a bin has >2000 counts, and if more than 50% of those come from <1% of pixels, then it is considered to be noise-dominated and hence unusable.
| Quadrant | # 1 sec bins | Bins with >0 counts | Bins with >2000 counts | High rate bins dominated by noise | Noise dominated (total time) | Noise dominated (detector-on time) | Marked lightcurve |
|---|---|---|---|---|---|---|---|
| A | 8890 | 7927 | 0 | 0 | 0.00% | 0.00% | 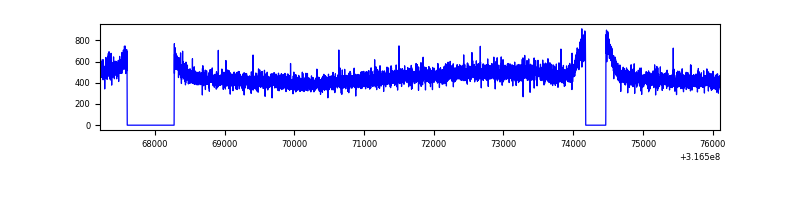 |
| B | 8891 | 7928 | 42 | 42 | 0.47% | 0.53% | 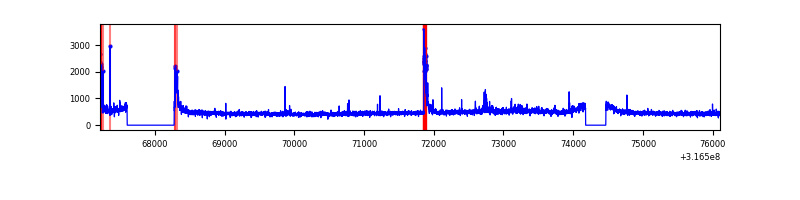 |
| C | 8891 | 7928 | 14 | 14 | 0.16% | 0.18% | 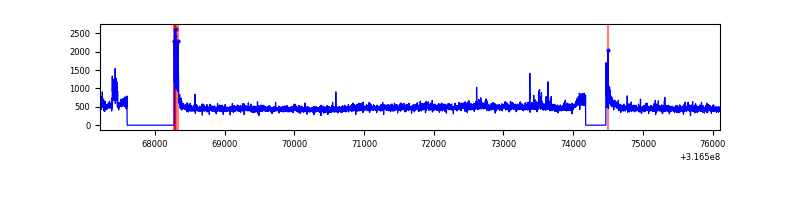 |
| D | 8891 | 7928 | 131 | 131 | 1.47% | 1.65% | 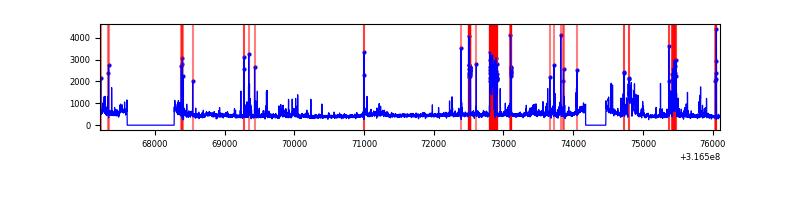 |
Top three noisy pixels from each quadrant. If the there are fewer than three noisy pixels in the level2.evt file, extra rows are filled as -1
| Pixel properties | Quadrant properties | ||||||
|---|---|---|---|---|---|---|---|
| Quadrant | DetID | PixID | Counts | Sigma | Mean | Median | Sigma |
| A | 13 | 254 | 11376 | 54.97 | 942 | 920 | 190.2 |
| A | 3 | 137 | 8454 | 39.61 | 942 | 920 | 190.2 |
| A | 0 | 226 | 8001 | 37.23 | 942 | 920 | 190.2 |
| B | 12 | 17 | 161917 | 897.98 | 940 | 911 | 179.3 |
| B | 0 | 190 | 55340 | 303.57 | 940 | 911 | 179.3 |
| B | 15 | 32 | 55128 | 302.38 | 940 | 911 | 179.3 |
| C | 14 | 238 | 144084 | 686.67 | 903 | 906 | 208.5 |
| C | 0 | 10 | 136496 | 650.27 | 903 | 906 | 208.5 |
| C | 2 | 16 | 34541 | 161.31 | 903 | 906 | 208.5 |
| D | 13 | 153 | 390981 | 1766.44 | 910 | 882 | 220.8 |
| D | 1 | 52 | 342405 | 1546.48 | 910 | 882 | 220.8 |
| D | 13 | 172 | 119842 | 538.67 | 910 | 882 | 220.8 |
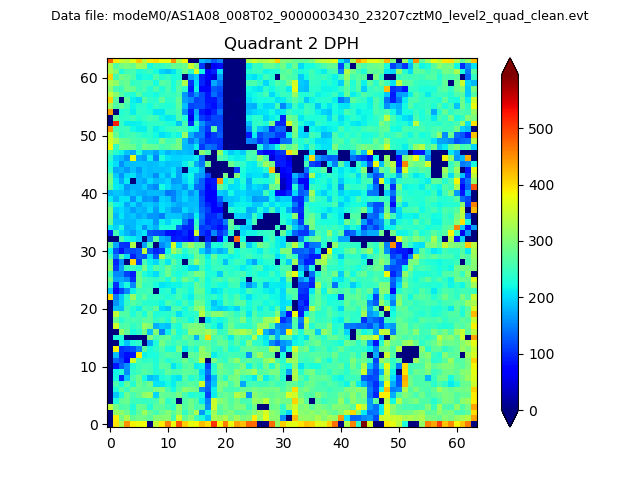
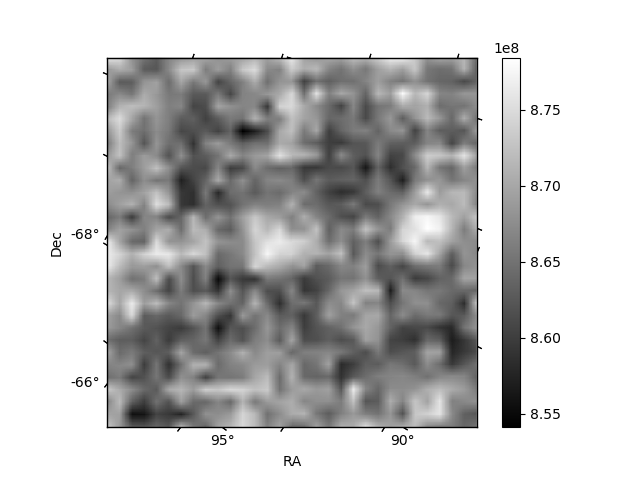
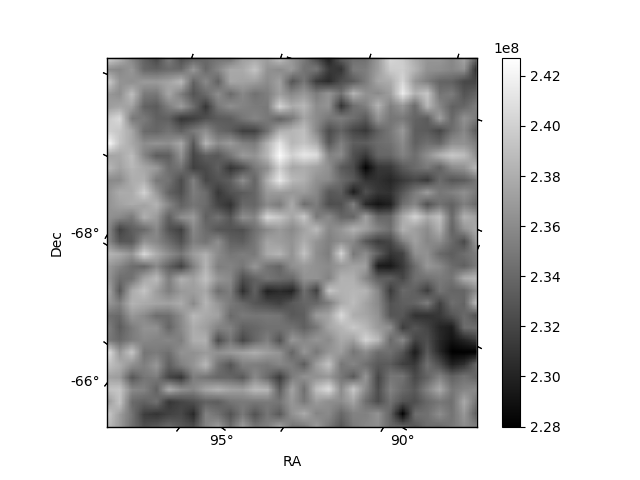
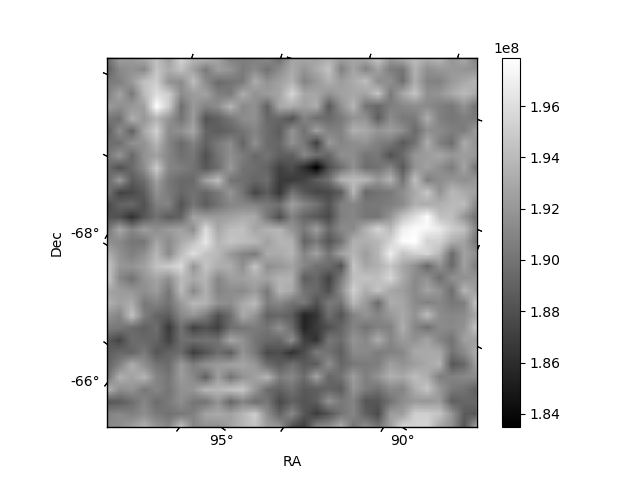
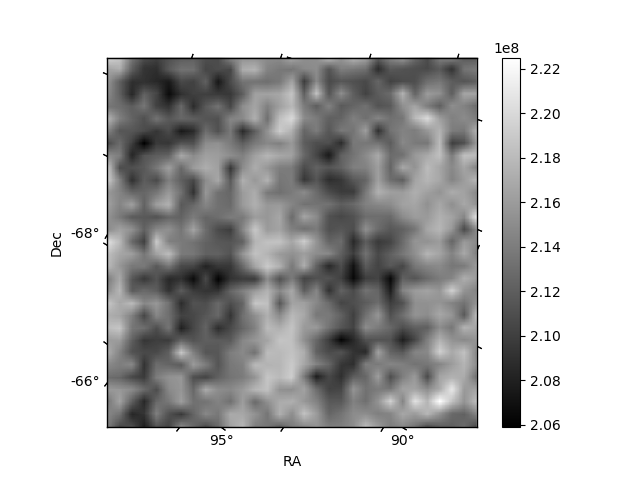
Histogram calculated using DETX and DETY for each event in the final _common_clean file
| Quadrant A | 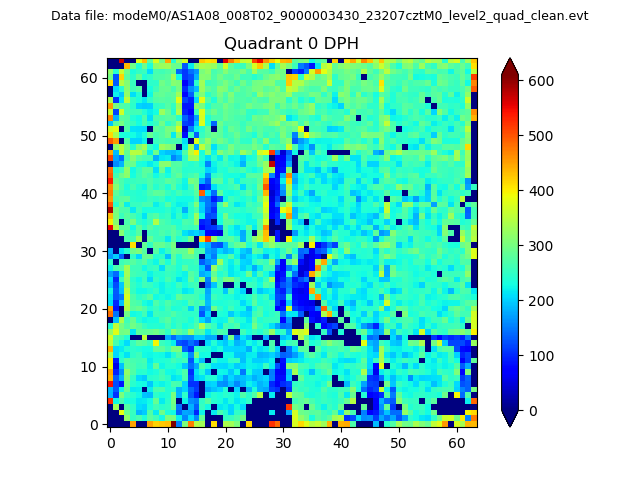 |
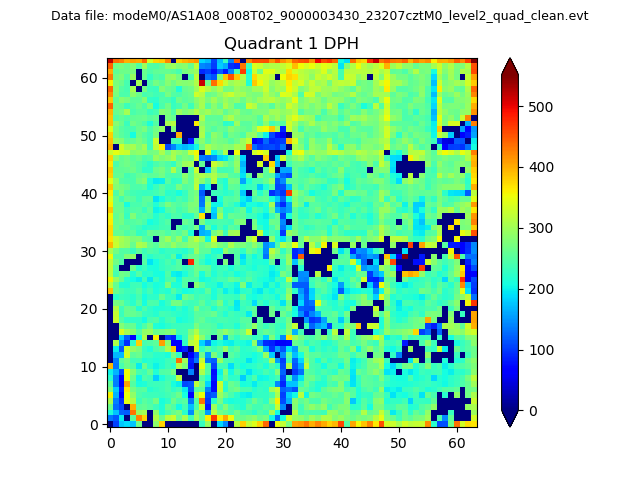 |
Quadrant B |
|---|---|---|---|
| Quadrant D | 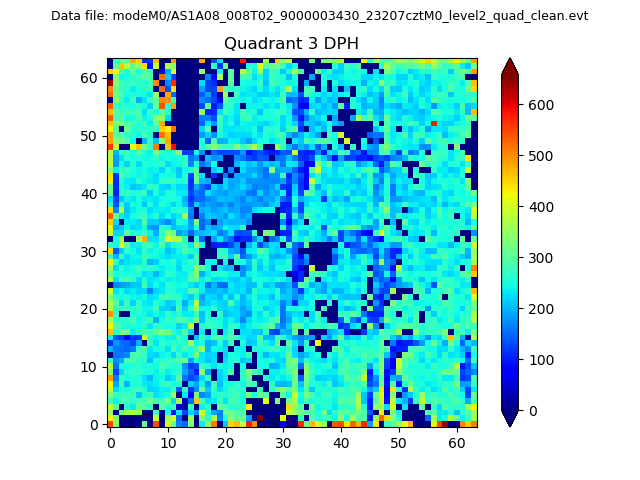 |
 |
Quadrant C |
| Plot type | Count rate plots | Images |
|---|---|---|
| Comparison with Poisson distribution Blue bars denote a histogram of data divided into 1 sec bins. Red curve is a Poisson curve with rate = median count rate of data. |
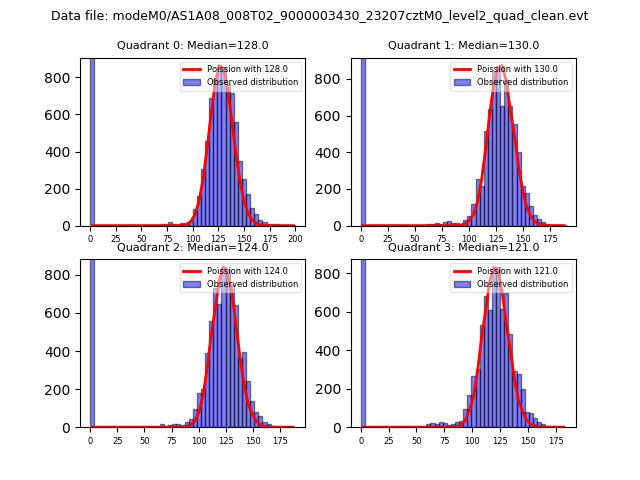 |
 |
| Quadrant-wise count rates Data is divided into 100 sec bins |
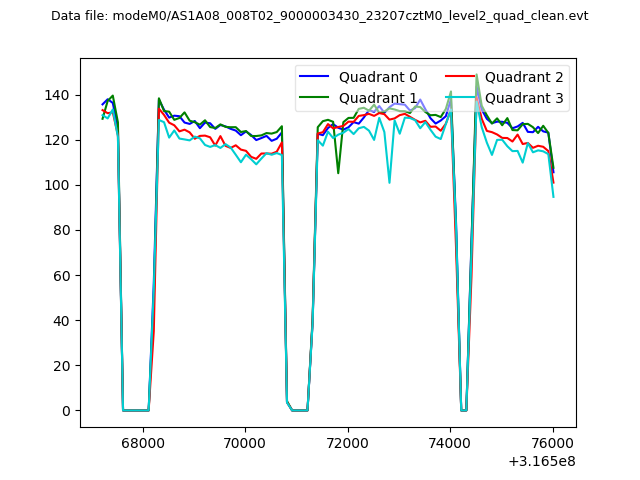 |
|
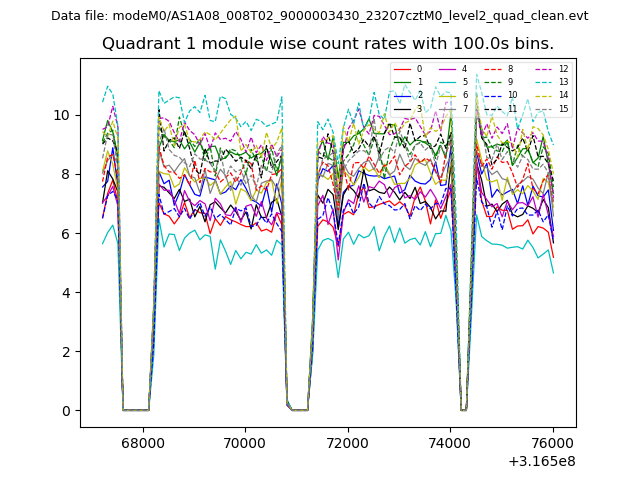
| Module-wise count rates for Quadrant A Data is divided into 100 sec bins |
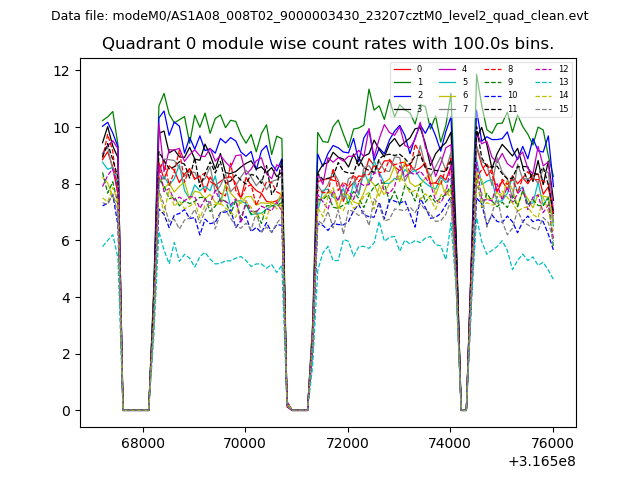 |
 |
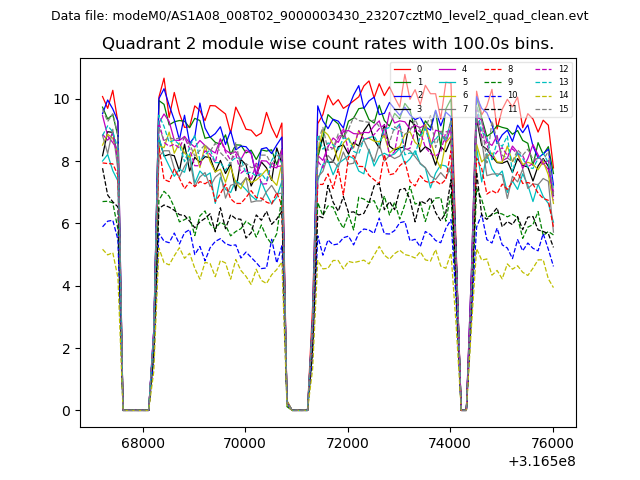
| Module-wise count rates for Quadrant B Data is divided into 100 sec bins |
 |
 |
| Module-wise count rates for Quadrant C Data is divided into 100 sec bins |
 |
 |
| Module-wise count rates for Quadrant D Data is divided into 100 sec bins |
 |
 |
| Parameter | Plot |
|---|---|
| CZT HV Monitor | 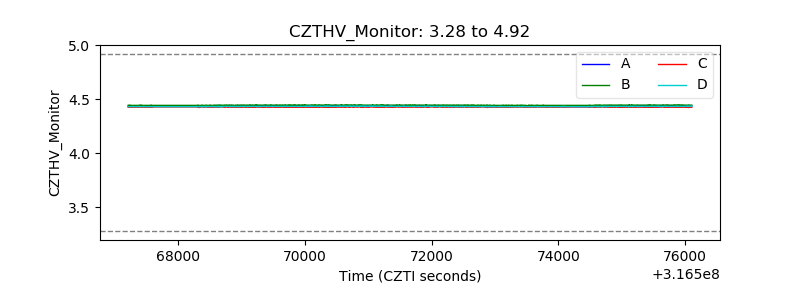 |
| D_VDD | 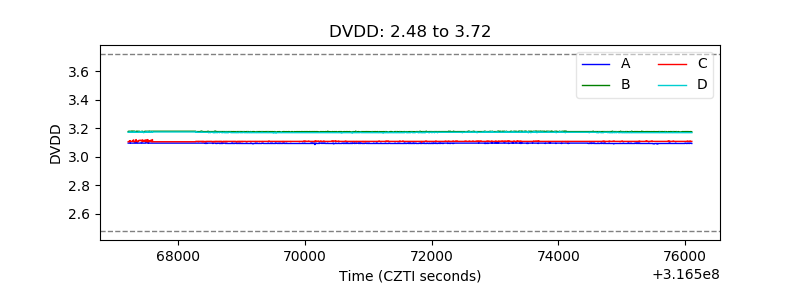 |
| Temperature 1 | 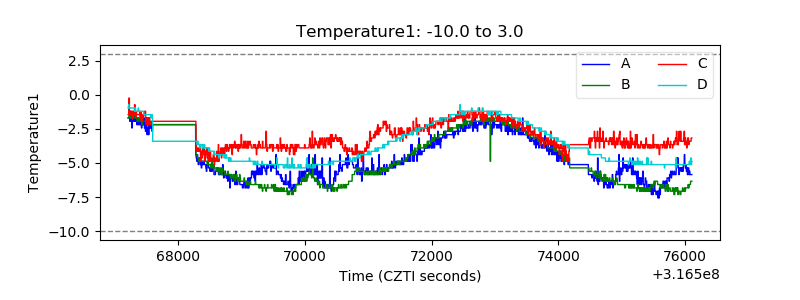 |
| Veto HV Monitor | 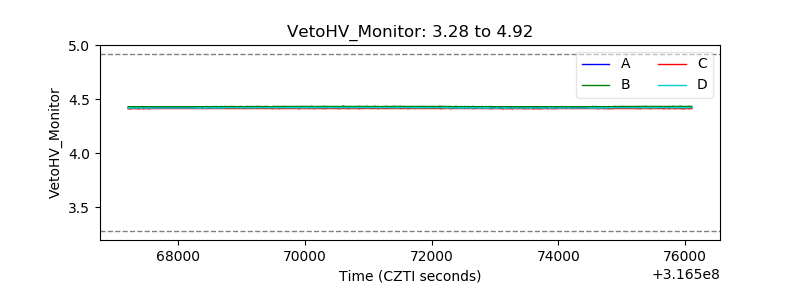 |
| Veto LLD | 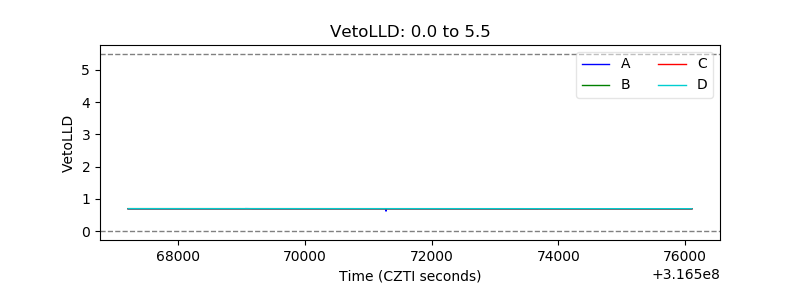 |
| Alpha Counter | 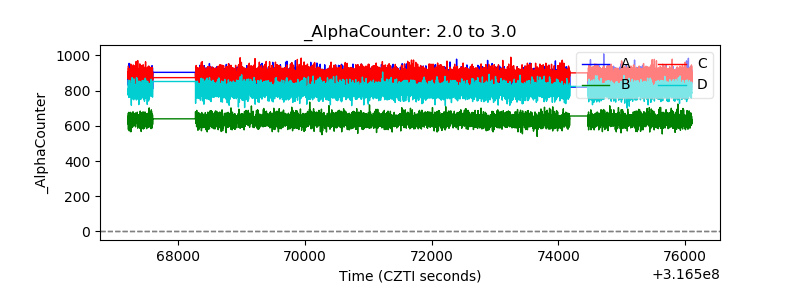 |
| _CPM_Rate | 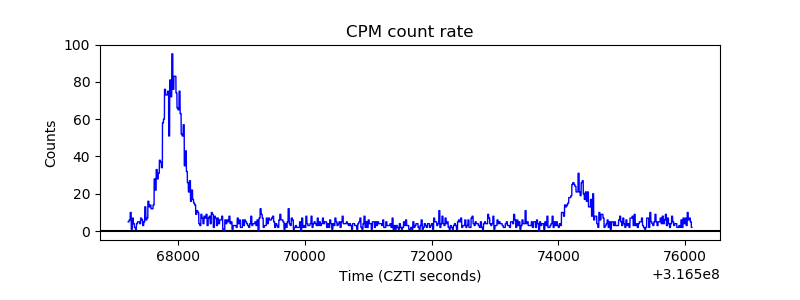 |
| CZT Counter | 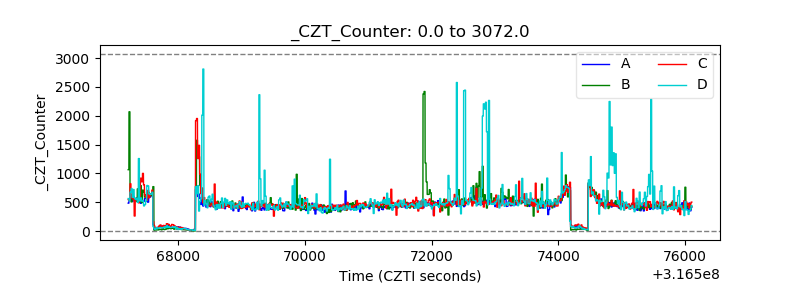 |
| +2.5 Volts monitor |  |
| +5 Volts monitor |  |
| _ROLL_ROT | 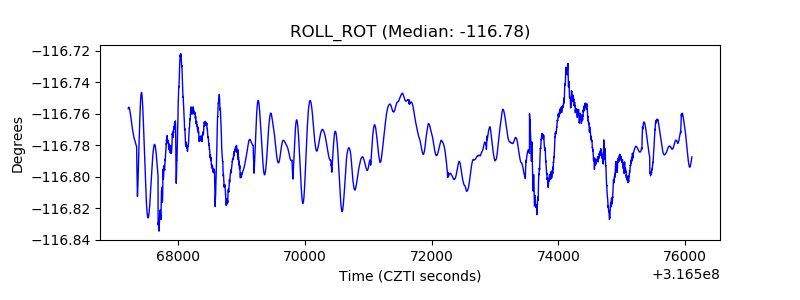 |
| _Roll_DEC | 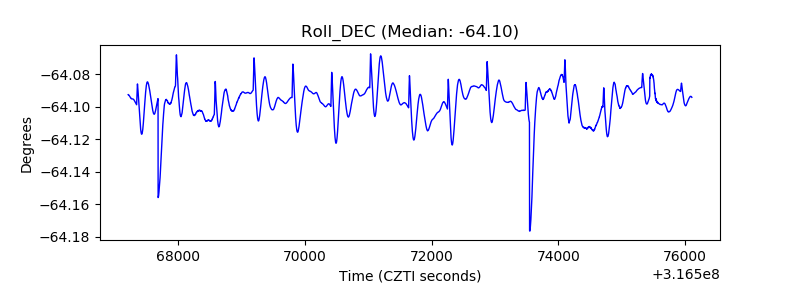 |
| _Roll_RA | 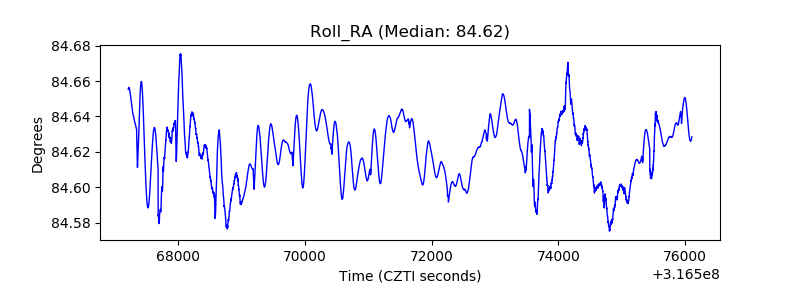 |
| Veto Counter | 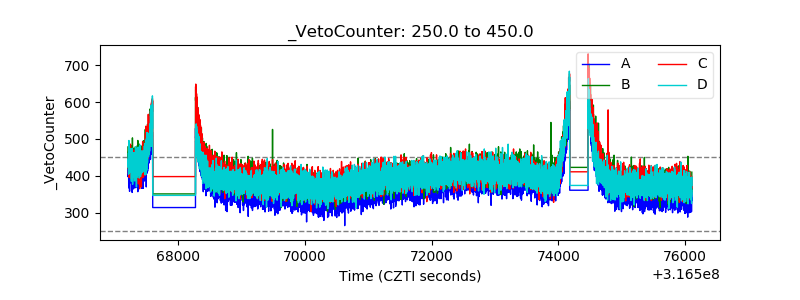 |