| Param | Original file | Final file |
|---|---|---|
| Filename | modeM0/AS1A08_008T02_9000003430_23208cztM0_level2.evt | modeM0/AS1A08_008T02_9000003430_23208cztM0_level2_quad_clean.evt |
| Size (bytes) | 470,917,440 | 126,616,320 |
| Size | 449.1 MB | 120.8 MB |
| Events in quadrant A | 3,295,289 | 848,900 |
| Events in quadrant B | 3,384,574 | 860,145 |
| Events in quadrant C | 3,474,939 | 817,909 |
| Events in quadrant D | 3,611,593 | 800,859 |
| Mode M9 | |||
|---|---|---|---|
| Quadrant | BADHDUFLAG | Total packets | Discarded packets |
| A | 0 | 3 | 0 |
| B | 0 | 3 | 0 |
| C | 0 | 3 | 0 |
| D | 0 | 3 | 0 |
| Mode M0 | |||
|---|---|---|---|
| Quadrant | BADHDUFLAG | Total packets | Discarded packets |
| A | 0 | 14849 | 1 |
| B | 0 | 14968 | 1 |
| C | 0 | 15040 | 1 |
| D | 0 | 15970 | 1 |
| Mode SS | |||
|---|---|---|---|
| Quadrant | BADHDUFLAG | Total packets | Discarded packets |
| A | 0 | 148 | 0 |
| B | 0 | 148 | 0 |
| C | 0 | 148 | 0 |
| D | 0 | 148 | 0 |
| Quadrant | Total seconds | Saturated seconds | Saturation percentage |
|---|---|---|---|
| A | 7289 | 97 | 1.330772% |
| B | 7289 | 122 | 1.673755% |
| C | 7290 | 154 | 2.112483% |
| D | 7290 | 135 | 1.851852% |
Noise dominated data is calculated using 1-second bins in cleaned event files. If a bin has >2000 counts, and if more than 50% of those come from <1% of pixels, then it is considered to be noise-dominated and hence unusable.
| Quadrant | # 1 sec bins | Bins with >0 counts | Bins with >2000 counts | High rate bins dominated by noise | Noise dominated (total time) | Noise dominated (detector-on time) | Marked lightcurve |
|---|---|---|---|---|---|---|---|
| A | 7559 | 7291 | 0 | 0 | 0.00% | 0.00% |  |
| B | 7559 | 7291 | 1 | 1 | 0.01% | 0.01% |  |
| C | 7560 | 7291 | 1 | 1 | 0.01% | 0.01% |  |
| D | 7560 | 7292 | 48 | 48 | 0.63% | 0.66% | 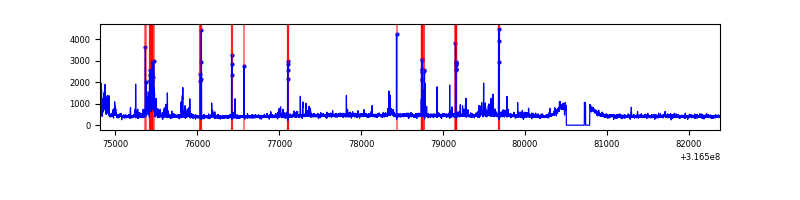 |
Top three noisy pixels from each quadrant. If the there are fewer than three noisy pixels in the level2.evt file, extra rows are filled as -1
| Pixel properties | Quadrant properties | ||||||
|---|---|---|---|---|---|---|---|
| Quadrant | DetID | PixID | Counts | Sigma | Mean | Median | Sigma |
| A | 13 | 254 | 10628 | 56.75 | 854 | 836 | 172.5 |
| A | 3 | 137 | 7719 | 39.89 | 854 | 836 | 172.5 |
| A | 0 | 226 | 7191 | 36.83 | 854 | 836 | 172.5 |
| B | 0 | 190 | 21095 | 125.18 | 852 | 828 | 161.9 |
| B | 12 | 111 | 19880 | 117.68 | 852 | 828 | 161.9 |
| B | 11 | 111 | 17715 | 104.3 | 852 | 828 | 161.9 |
| C | 14 | 238 | 130205 | 674.34 | 823 | 828 | 191.9 |
| C | 0 | 10 | 64451 | 331.62 | 823 | 828 | 191.9 |
| C | 7 | 247 | 38080 | 194.16 | 823 | 828 | 191.9 |
| D | 13 | 153 | 145047 | 712.07 | 829 | 802 | 202.6 |
| D | 1 | 52 | 136152 | 668.16 | 829 | 802 | 202.6 |
| D | 13 | 172 | 84342 | 412.4 | 829 | 802 | 202.6 |
Histogram calculated using DETX and DETY for each event in the final _common_clean file
| Quadrant A |  |
 |
Quadrant B |
|---|---|---|---|
| Quadrant D |  |
 |
Quadrant C |
| Plot type | Count rate plots | Images |
|---|---|---|
| Comparison with Poisson distribution Blue bars denote a histogram of data divided into 1 sec bins. Red curve is a Poisson curve with rate = median count rate of data. |
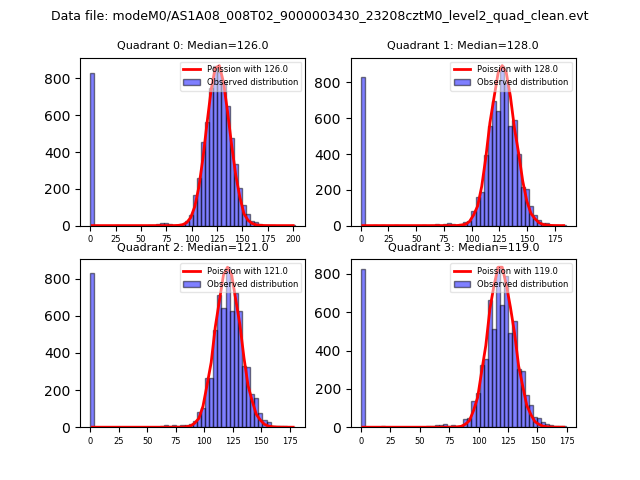 |
 |
| Quadrant-wise count rates Data is divided into 100 sec bins |
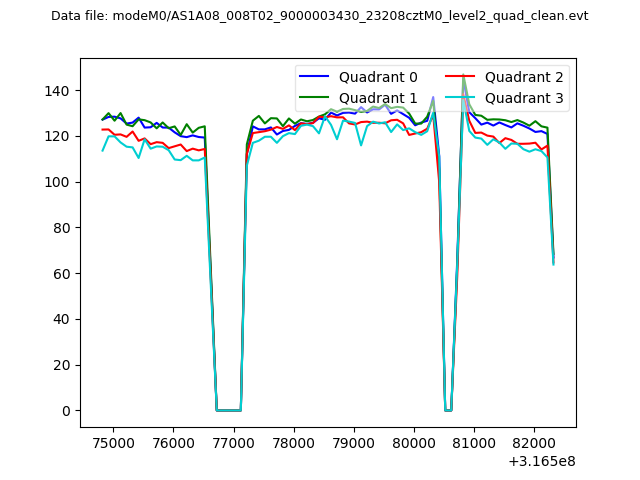 |
|
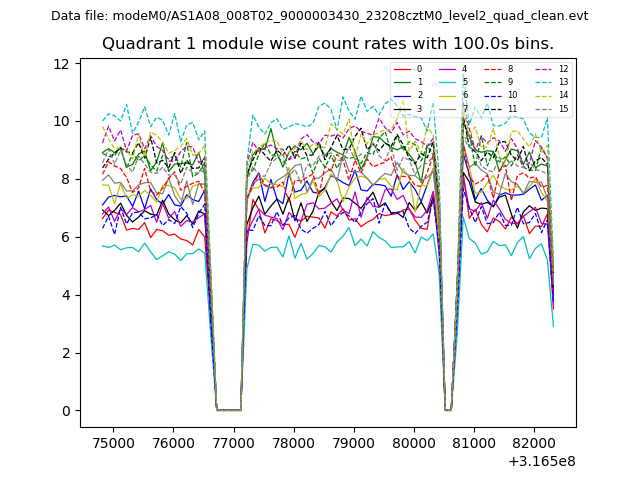
| Module-wise count rates for Quadrant A Data is divided into 100 sec bins |
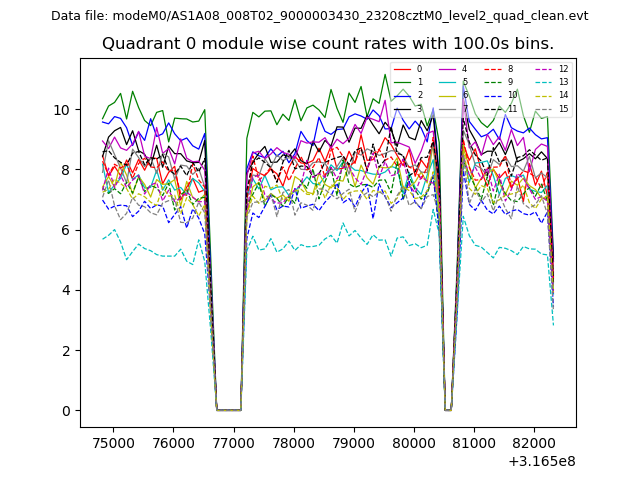 |
 |
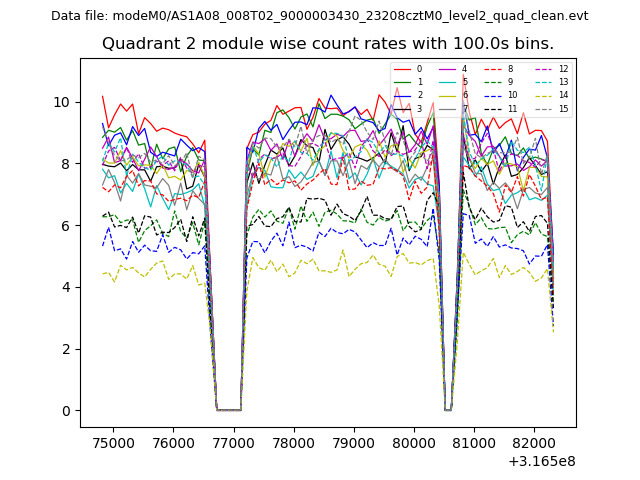
| Module-wise count rates for Quadrant B Data is divided into 100 sec bins |
 |
 |
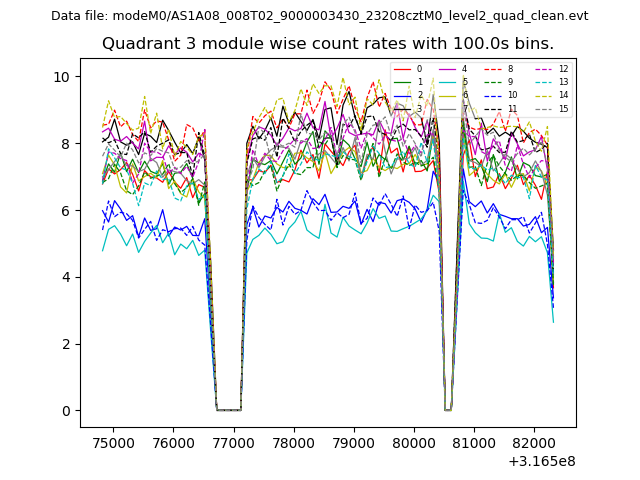
| Module-wise count rates for Quadrant C Data is divided into 100 sec bins |
 |
 |
| Module-wise count rates for Quadrant D Data is divided into 100 sec bins |
 |
 |
| Parameter | Plot |
|---|---|
| CZT HV Monitor | 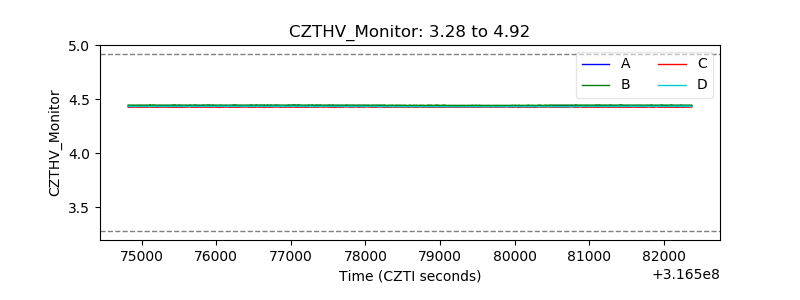 |
| D_VDD |  |
| Temperature 1 |  |
| Veto HV Monitor |  |
| Veto LLD |  |
| Alpha Counter | 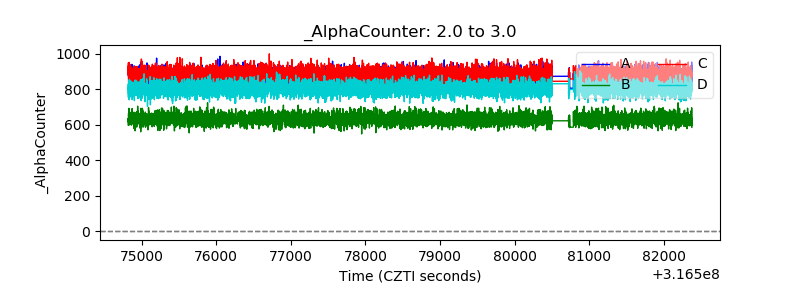 |
| _CPM_Rate | 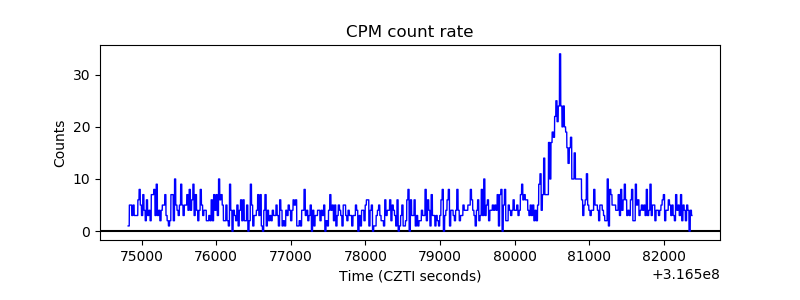 |
| CZT Counter |  |
| +2.5 Volts monitor |  |
| +5 Volts monitor |  |
| _ROLL_ROT | 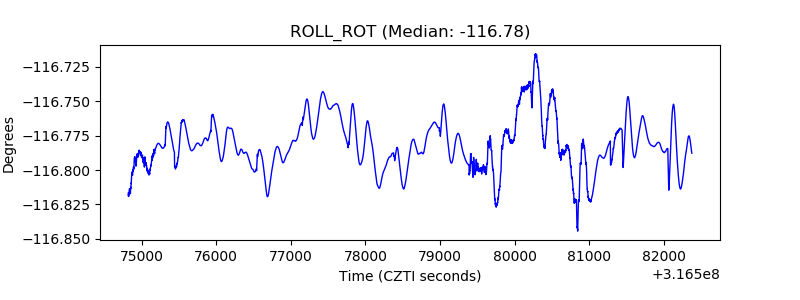 |
| _Roll_DEC |  |
| _Roll_RA |  |
| Veto Counter | 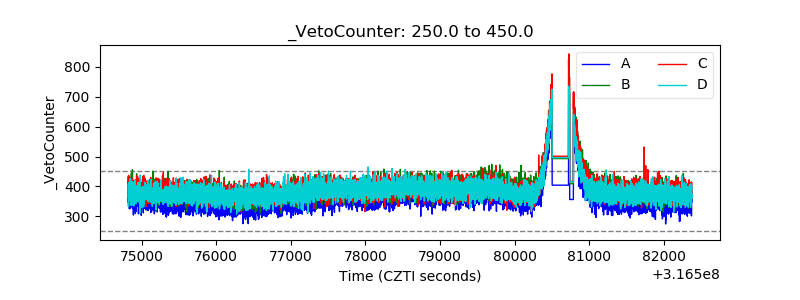 |