| Param | Original file | Final file |
|---|---|---|
| Filename | modeM0/AS1A08_008T02_9000003430_23211cztM0_level2.evt | modeM0/AS1A08_008T02_9000003430_23211cztM0_level2_quad_clean.evt |
| Size (bytes) | 230,045,760 | 59,486,400 |
| Size | 219.4 MB | 56.7 MB |
| Events in quadrant A | 1,617,626 | 389,229 |
| Events in quadrant B | 1,653,108 | 398,618 |
| Events in quadrant C | 1,786,403 | 379,738 |
| Events in quadrant D | 1,654,654 | 370,335 |
| Mode M0 | |||
|---|---|---|---|
| Quadrant | BADHDUFLAG | Total packets | Discarded packets |
| A | 0 | 7456 | 0 |
| B | 0 | 7486 | 0 |
| C | 0 | 7588 | 0 |
| D | 0 | 7655 | 0 |
| Mode SS | |||
|---|---|---|---|
| Quadrant | BADHDUFLAG | Total packets | Discarded packets |
| A | 0 | 74 | 0 |
| B | 0 | 74 | 0 |
| C | 0 | 74 | 0 |
| D | 0 | 74 | 0 |
| Quadrant | Total seconds | Saturated seconds | Saturation percentage |
|---|---|---|---|
| A | 3724 | 3 | 0.080559% |
| B | 3724 | 2 | 0.053706% |
| C | 3724 | 10 | 0.268528% |
| D | 3724 | 17 | 0.456498% |
Noise dominated data is calculated using 1-second bins in cleaned event files. If a bin has >2000 counts, and if more than 50% of those come from <1% of pixels, then it is considered to be noise-dominated and hence unusable.
| Quadrant | # 1 sec bins | Bins with >0 counts | Bins with >2000 counts | High rate bins dominated by noise | Noise dominated (total time) | Noise dominated (detector-on time) | Marked lightcurve |
|---|---|---|---|---|---|---|---|
| A | 3724 | 3724 | 0 | 0 | 0.00% | 0.00% | 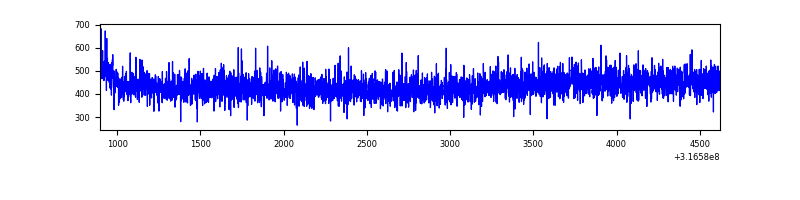 |
| B | 3724 | 3724 | 1 | 1 | 0.03% | 0.03% | 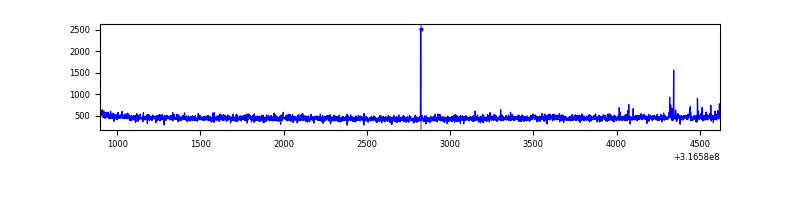 |
| C | 3724 | 3724 | 0 | 0 | 0.00% | 0.00% | 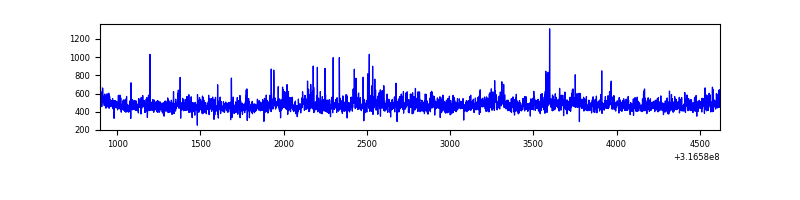 |
| D | 3724 | 3724 | 11 | 11 | 0.30% | 0.30% | 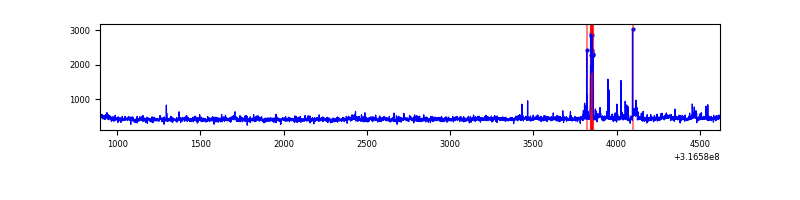 |
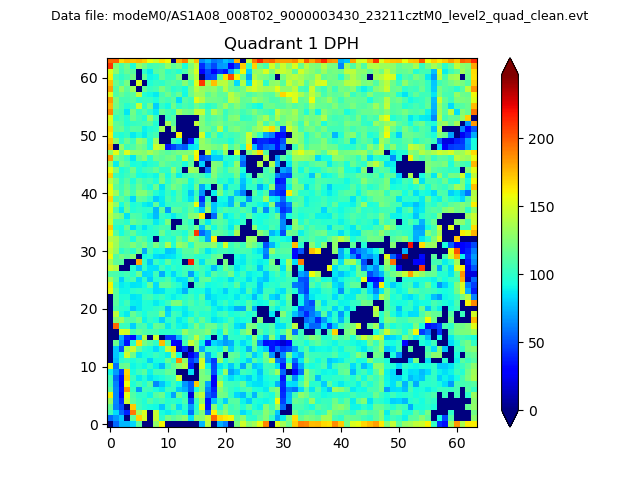
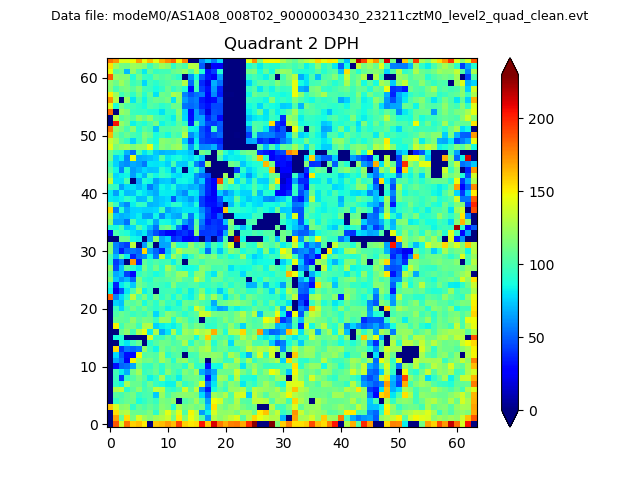
Top three noisy pixels from each quadrant. If the there are fewer than three noisy pixels in the level2.evt file, extra rows are filled as -1
| Pixel properties | Quadrant properties | ||||||
|---|---|---|---|---|---|---|---|
| Quadrant | DetID | PixID | Counts | Sigma | Mean | Median | Sigma |
| A | 13 | 254 | 5111 | 54.87 | 419 | 409 | 85.7 |
| A | 3 | 137 | 3759 | 39.09 | 419 | 409 | 85.7 |
| A | 0 | 226 | 3460 | 35.6 | 419 | 409 | 85.7 |
| B | 12 | 111 | 9624 | 113.48 | 419 | 408 | 81.2 |
| B | 0 | 190 | 9281 | 109.26 | 419 | 408 | 81.2 |
| B | 11 | 111 | 8774 | 103.02 | 419 | 408 | 81.2 |
| C | 0 | 10 | 91774 | 935.89 | 410 | 412 | 97.6 |
| C | 14 | 238 | 65455 | 666.28 | 410 | 412 | 97.6 |
| C | 0 | 239 | 16076 | 160.46 | 410 | 412 | 97.6 |
| D | 12 | 233 | 49841 | 486.71 | 413 | 400 | 101.6 |
| D | 13 | 153 | 27317 | 264.98 | 413 | 400 | 101.6 |
| D | 2 | 234 | 12416 | 118.29 | 413 | 400 | 101.6 |
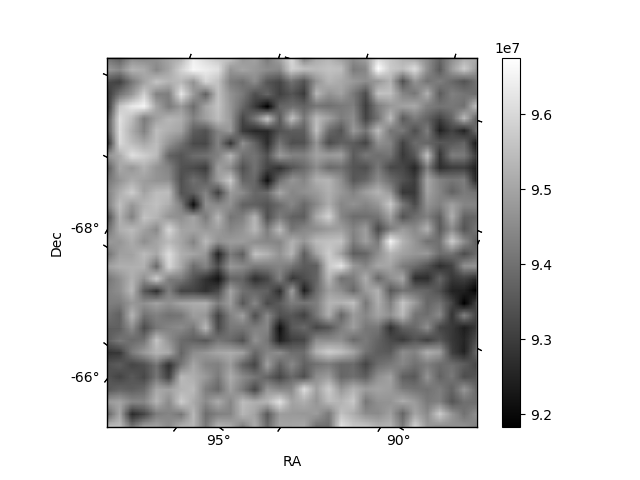
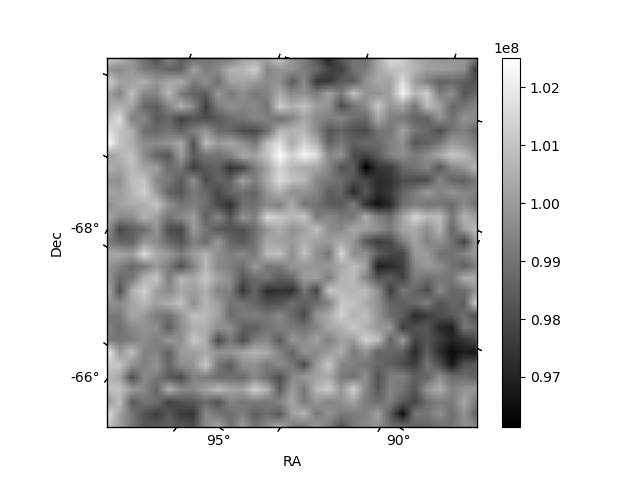
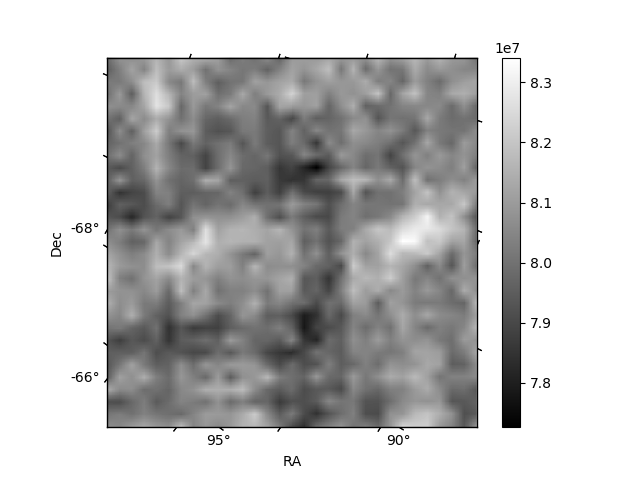
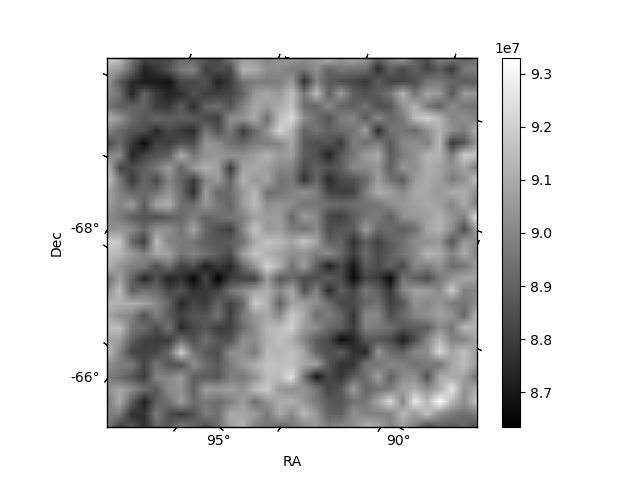
Histogram calculated using DETX and DETY for each event in the final _common_clean file
| Quadrant A | 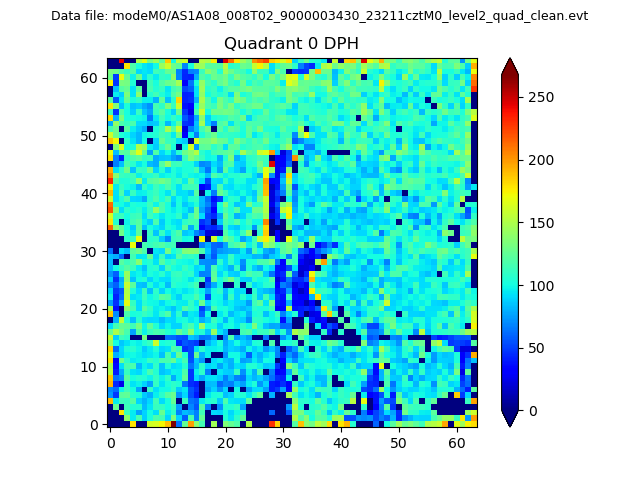 |
 |
Quadrant B |
|---|---|---|---|
| Quadrant D | 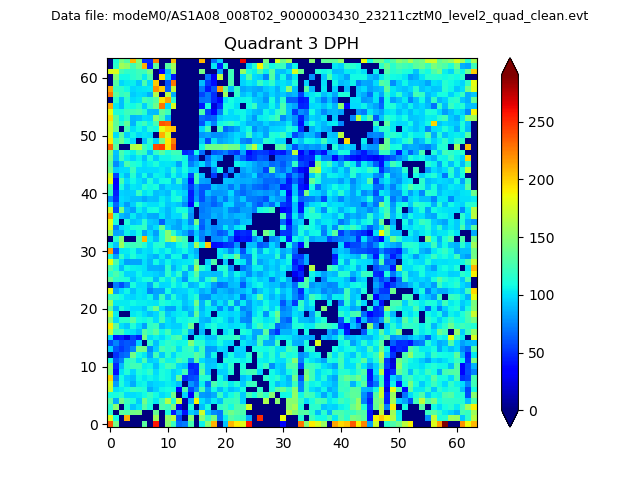 |
 |
Quadrant C |
| Plot type | Count rate plots | Images |
|---|---|---|
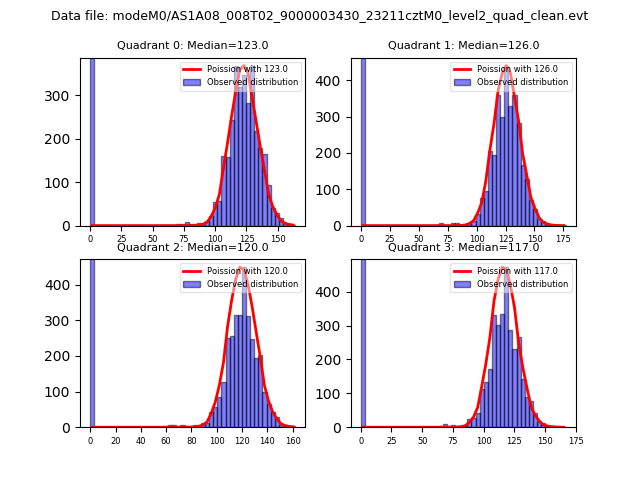
| Comparison with Poisson distribution Blue bars denote a histogram of data divided into 1 sec bins. Red curve is a Poisson curve with rate = median count rate of data. |
 |
 |
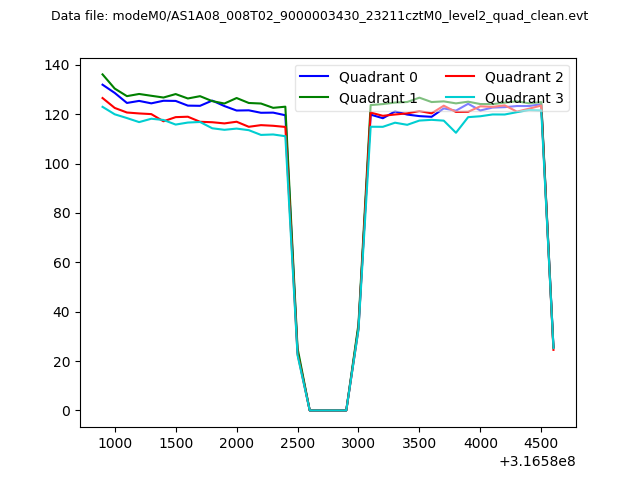
| Quadrant-wise count rates Data is divided into 100 sec bins |
 |
|
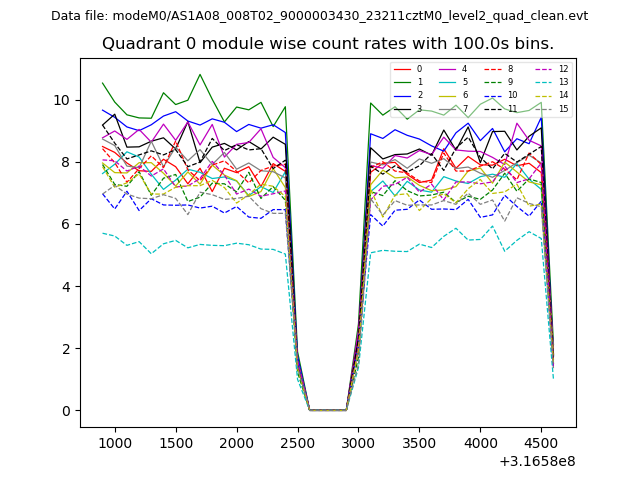
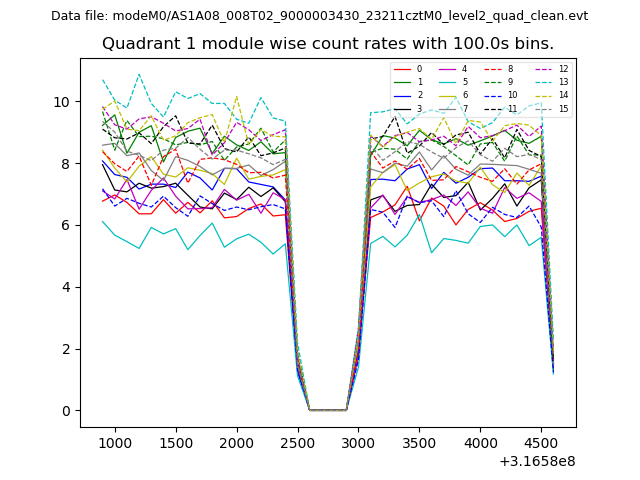
| Module-wise count rates for Quadrant A Data is divided into 100 sec bins |
 |
 |
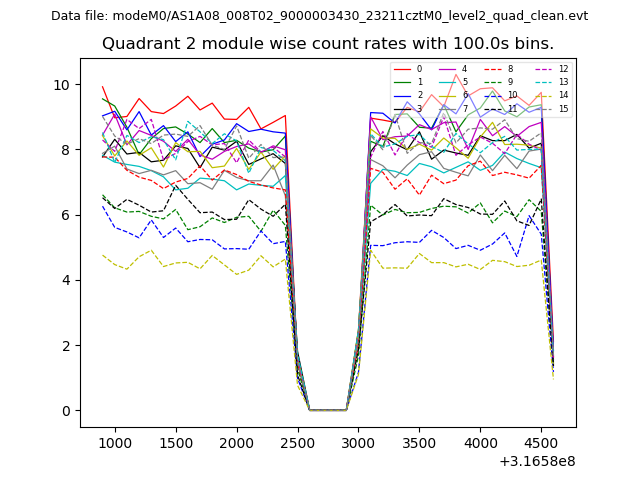
| Module-wise count rates for Quadrant B Data is divided into 100 sec bins |
 |
 |
| Module-wise count rates for Quadrant C Data is divided into 100 sec bins |
 |
 |
| Module-wise count rates for Quadrant D Data is divided into 100 sec bins |
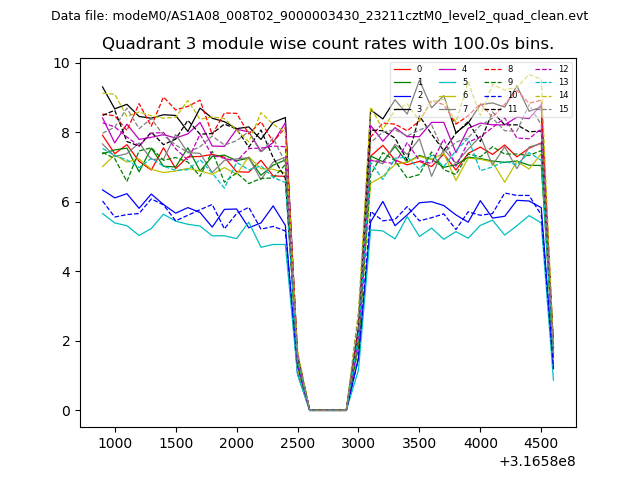 |
 |
| Parameter | Plot |
|---|---|
| CZT HV Monitor | 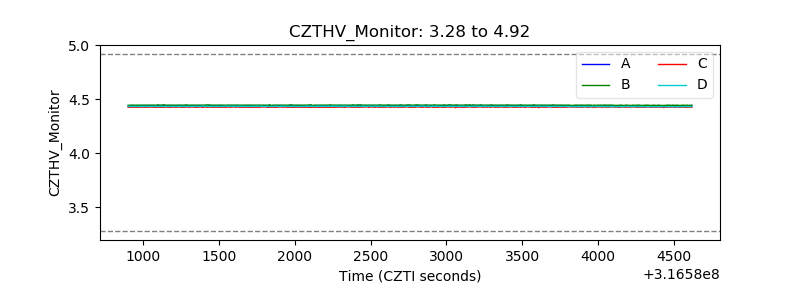 |
| D_VDD | 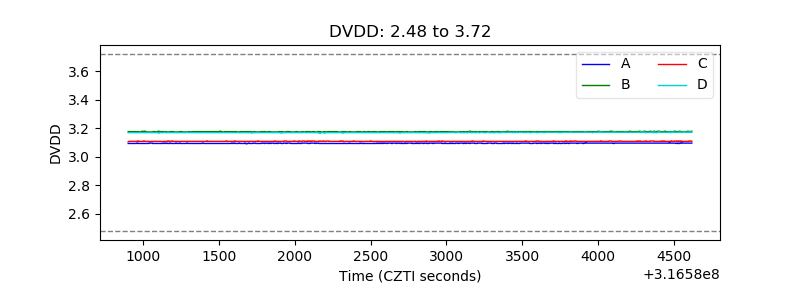 |
| Temperature 1 | 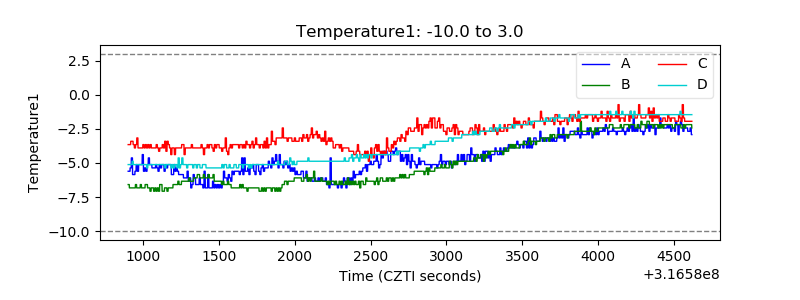 |
| Veto HV Monitor | 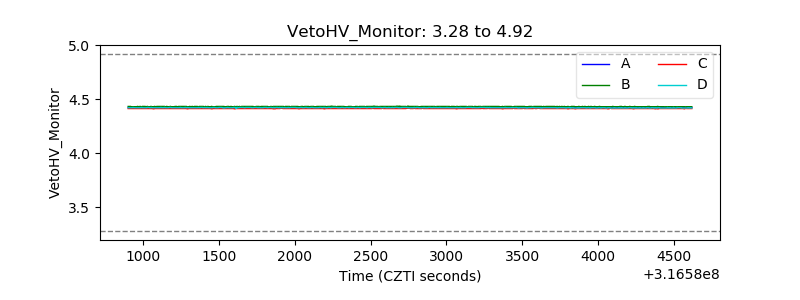 |
| Veto LLD | 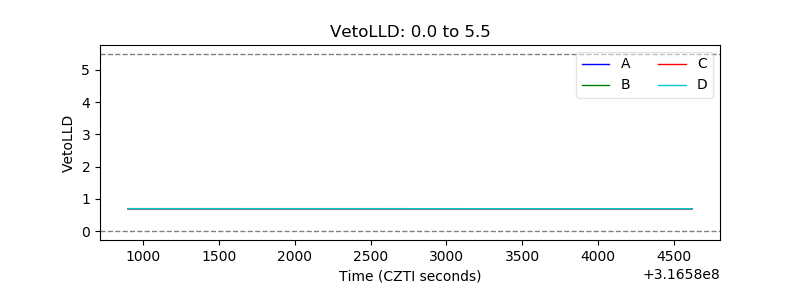 |
| Alpha Counter | 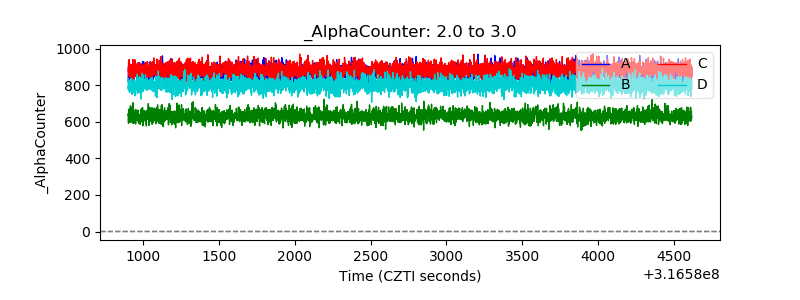 |
| _CPM_Rate | 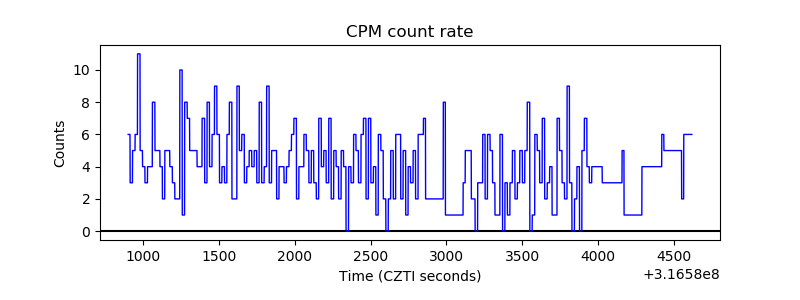 |
| CZT Counter | 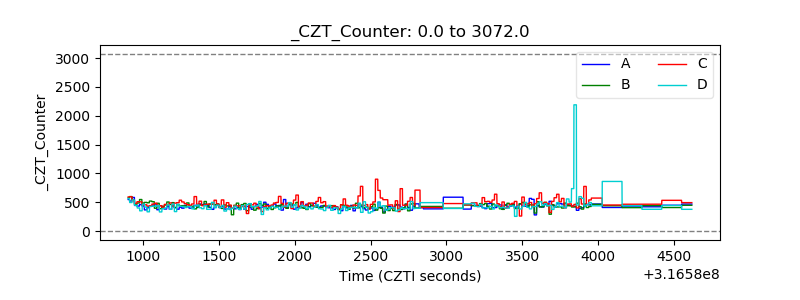 |
| +2.5 Volts monitor | 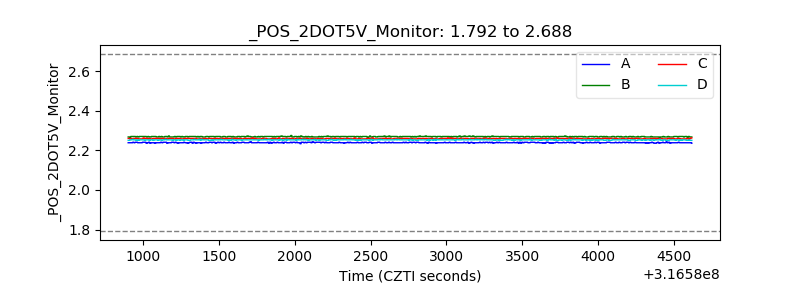 |
| +5 Volts monitor | 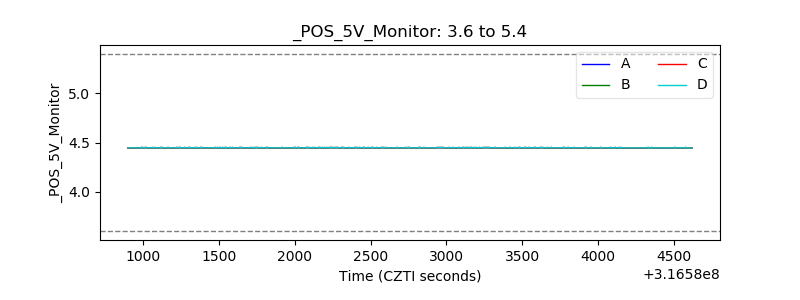 |
| _ROLL_ROT | 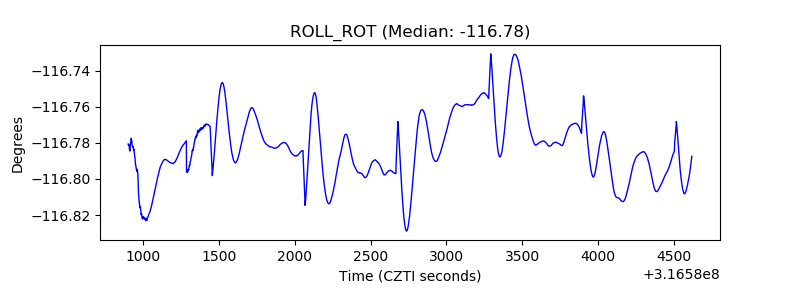 |
| _Roll_DEC | 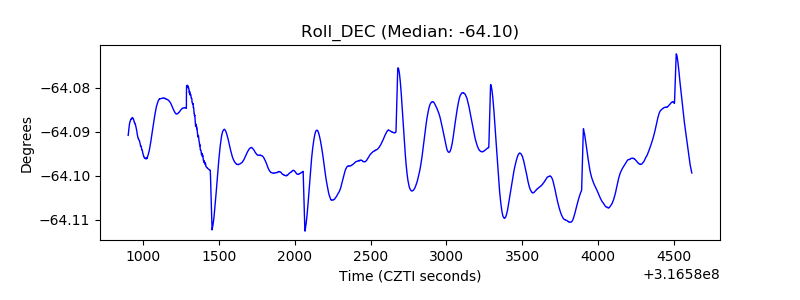 |
| _Roll_RA | 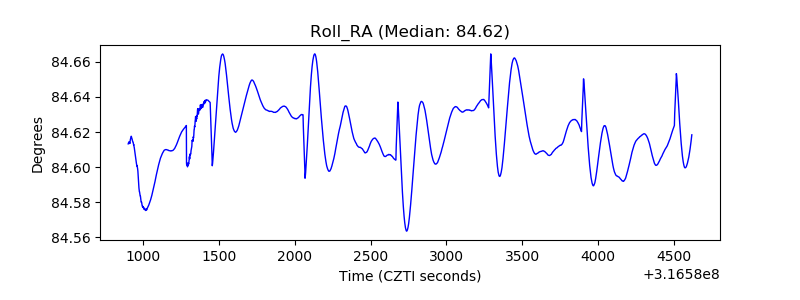 |
| Veto Counter | 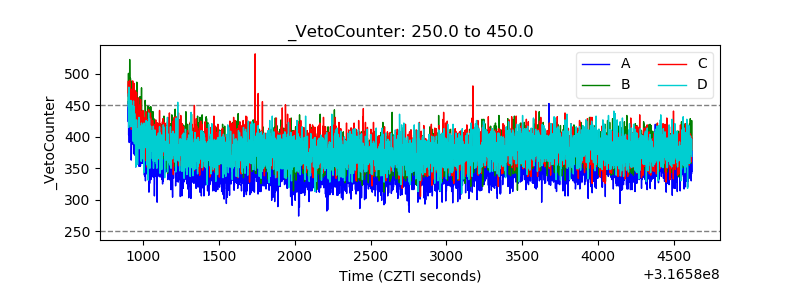 |