| Param | Original file | Final file |
|---|---|---|
| Filename | modeM0/AS1A08_008T02_9000003430_23212cztM0_level2.evt | modeM0/AS1A08_008T02_9000003430_23212cztM0_level2_quad_clean.evt |
| Size (bytes) | 907,833,600 | 180,590,400 |
| Size | 865.8 MB | 172.2 MB |
| Events in quadrant A | 5,012,464 | 1,237,498 |
| Events in quadrant B | 5,238,417 | 1,251,724 |
| Events in quadrant C | 5,273,930 | 1,202,511 |
| Events in quadrant D | 11,225,471 | 1,016,797 |
| Mode M9 | |||
|---|---|---|---|
| Quadrant | BADHDUFLAG | Total packets | Discarded packets |
| A | 0 | 11 | 0 |
| B | 0 | 11 | 0 |
| C | 0 | 11 | 0 |
| D | 0 | 11 | 0 |
| Mode M0 | |||
|---|---|---|---|
| Quadrant | BADHDUFLAG | Total packets | Discarded packets |
| A | 0 | 22262 | 2 |
| B | 0 | 22692 | 2 |
| C | 0 | 22463 | 2 |
| D | 0 | 40738 | 2 |
| Mode SS | |||
|---|---|---|---|
| Quadrant | BADHDUFLAG | Total packets | Discarded packets |
| A | 0 | 224 | 0 |
| B | 0 | 224 | 0 |
| C | 0 | 224 | 0 |
| D | 0 | 224 | 0 |
| Quadrant | Total seconds | Saturated seconds | Saturation percentage |
|---|---|---|---|
| A | 10982 | 98 | 0.892369% |
| B | 10983 | 126 | 1.147228% |
| C | 10983 | 173 | 1.575162% |
| D | 10983 | 2300 | 20.941455% |
Noise dominated data is calculated using 1-second bins in cleaned event files. If a bin has >2000 counts, and if more than 50% of those come from <1% of pixels, then it is considered to be noise-dominated and hence unusable.
| Quadrant | # 1 sec bins | Bins with >0 counts | Bins with >2000 counts | High rate bins dominated by noise | Noise dominated (total time) | Noise dominated (detector-on time) | Marked lightcurve |
|---|---|---|---|---|---|---|---|
| A | 12062 | 10985 | 0 | 0 | 0.00% | 0.00% | 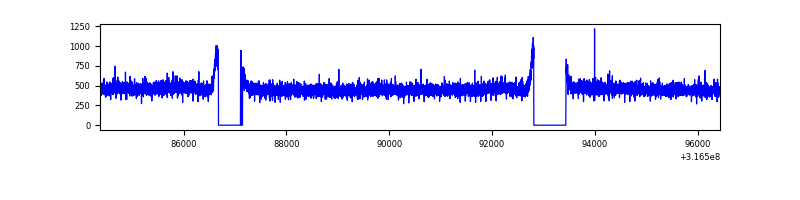 |
| B | 12063 | 10986 | 6 | 6 | 0.05% | 0.05% | 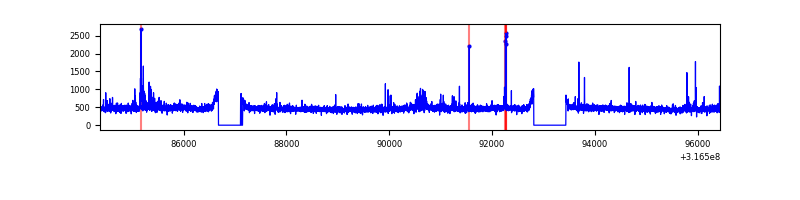 |
| C | 12063 | 10985 | 1 | 1 | 0.01% | 0.01% | 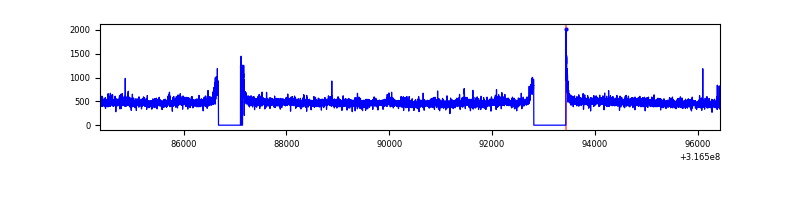 |
| D | 12063 | 10986 | 2025 | 2025 | 16.79% | 18.43% | 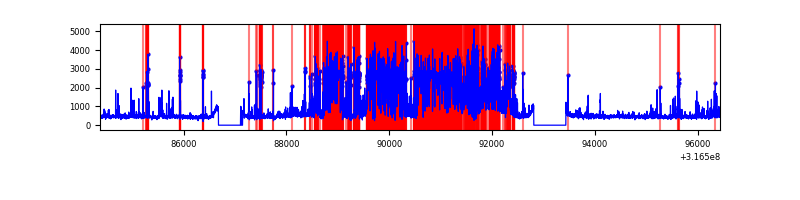 |
Top three noisy pixels from each quadrant. If the there are fewer than three noisy pixels in the level2.evt file, extra rows are filled as -1
| Pixel properties | Quadrant properties | ||||||
|---|---|---|---|---|---|---|---|
| Quadrant | DetID | PixID | Counts | Sigma | Mean | Median | Sigma |
| A | 13 | 254 | 16340 | 57.81 | 1299 | 1268 | 260.7 |
| A | 3 | 137 | 11741 | 40.17 | 1299 | 1268 | 260.7 |
| A | 0 | 226 | 11148 | 37.9 | 1299 | 1268 | 260.7 |
| B | 0 | 190 | 55320 | 220.56 | 1291 | 1257 | 245.1 |
| B | 0 | 228 | 53756 | 214.18 | 1291 | 1257 | 245.1 |
| B | 15 | 32 | 49283 | 195.93 | 1291 | 1257 | 245.1 |
| C | 14 | 238 | 197721 | 679.45 | 1245 | 1251 | 289.2 |
| C | 0 | 10 | 140890 | 482.91 | 1245 | 1251 | 289.2 |
| C | 7 | 247 | 77644 | 264.19 | 1245 | 1251 | 289.2 |
| D | 1 | 52 | 5171026 | 18967.07 | 1122 | 1088 | 272.6 |
| D | 13 | 153 | 1226016 | 4493.92 | 1122 | 1088 | 272.6 |
| D | 12 | 233 | 466656 | 1708.04 | 1122 | 1088 | 272.6 |
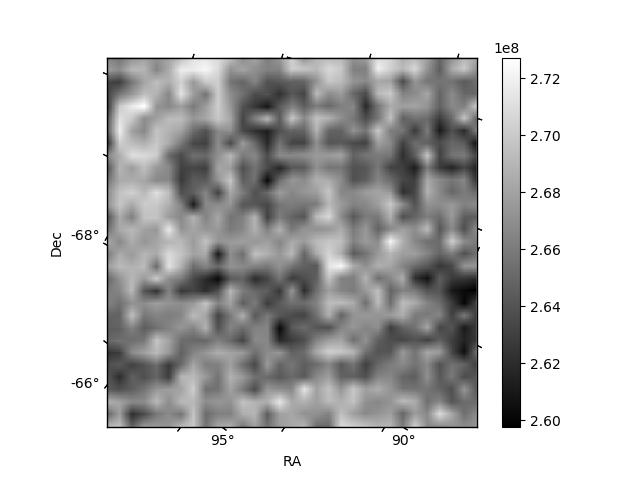
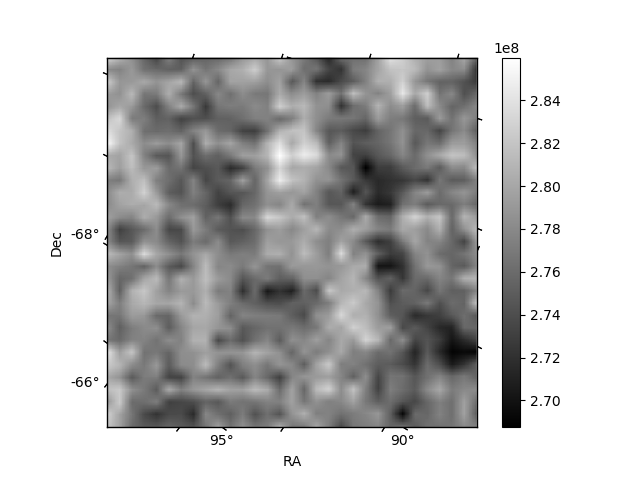
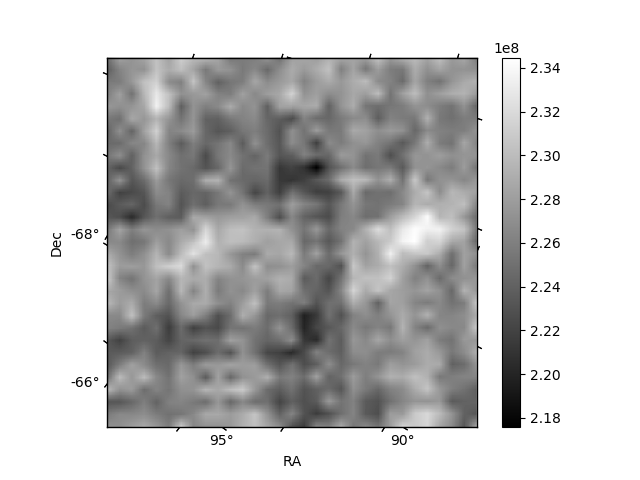
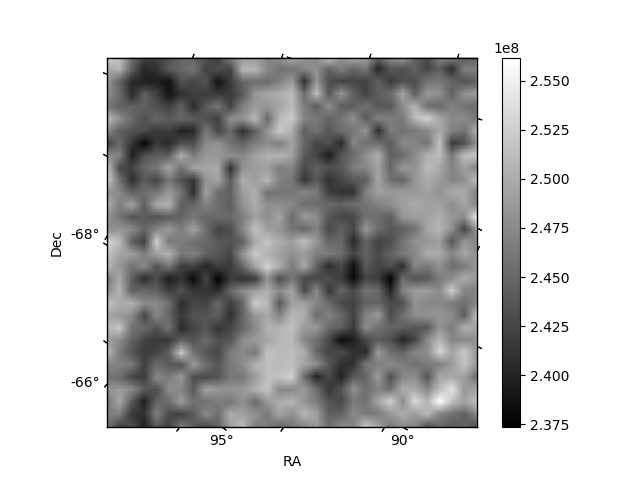
Histogram calculated using DETX and DETY for each event in the final _common_clean file
| Quadrant A | 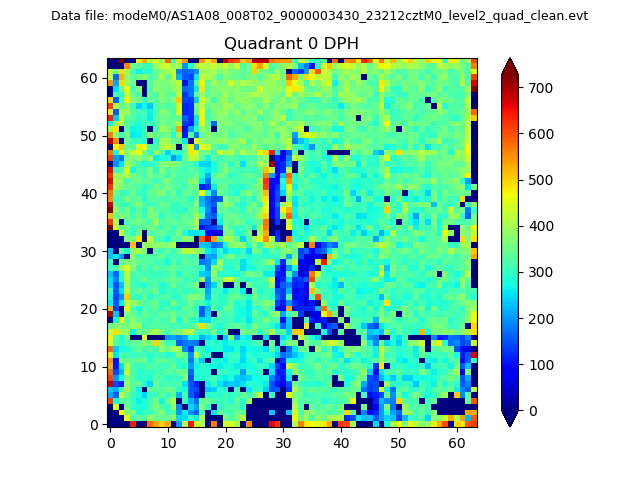 |
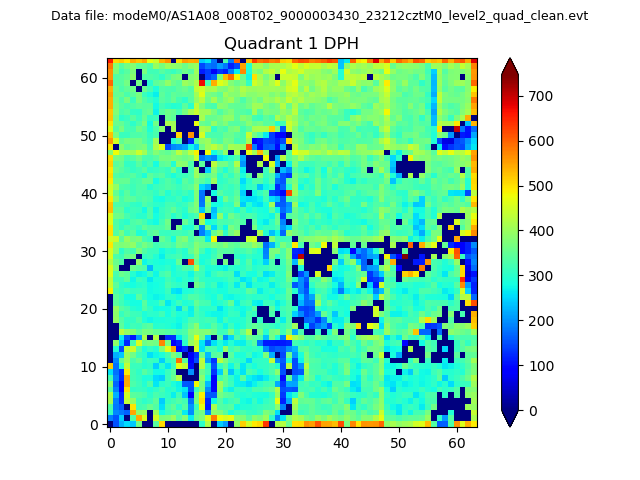 |
Quadrant B |
|---|---|---|---|
| Quadrant D |  |
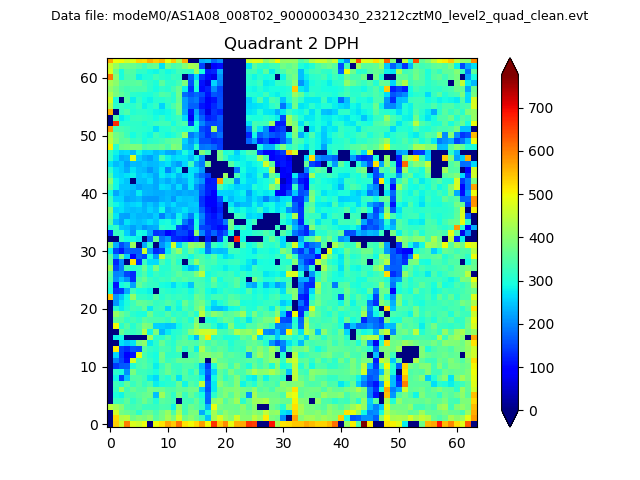 |
Quadrant C |
| Plot type | Count rate plots | Images |
|---|---|---|
| Comparison with Poisson distribution Blue bars denote a histogram of data divided into 1 sec bins. Red curve is a Poisson curve with rate = median count rate of data. |
 |
 |
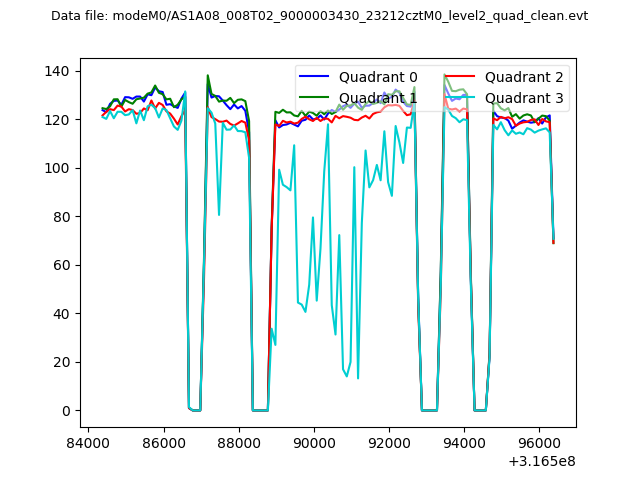
| Quadrant-wise count rates Data is divided into 100 sec bins |
 |
|
| Module-wise count rates for Quadrant A Data is divided into 100 sec bins |
 |
 |
| Module-wise count rates for Quadrant B Data is divided into 100 sec bins |
 |
 |
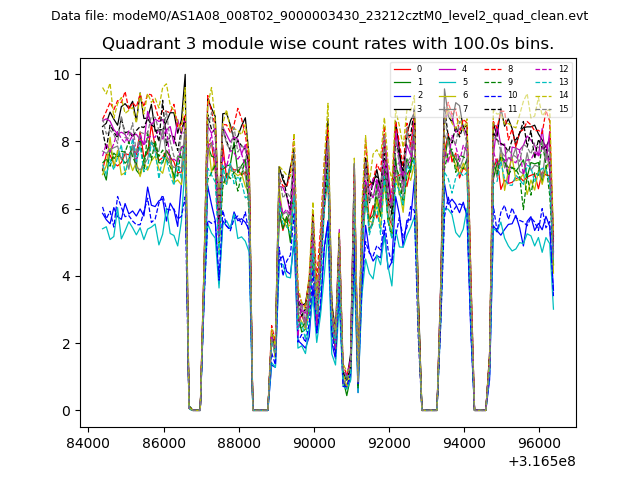
| Module-wise count rates for Quadrant C Data is divided into 100 sec bins |
 |
 |
| Module-wise count rates for Quadrant D Data is divided into 100 sec bins |
 |
 |
| Parameter | Plot |
|---|---|
| CZT HV Monitor |  |
| D_VDD | 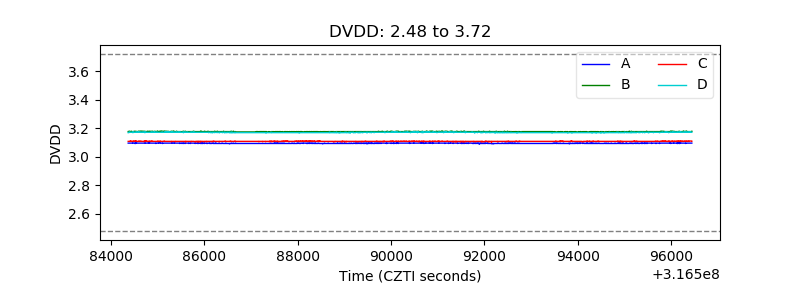 |
| Temperature 1 | 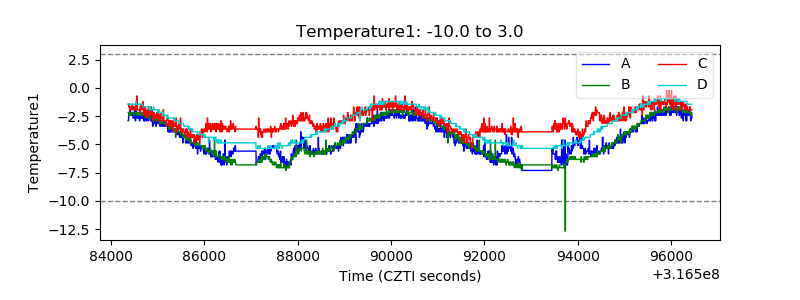 |
| Veto HV Monitor | 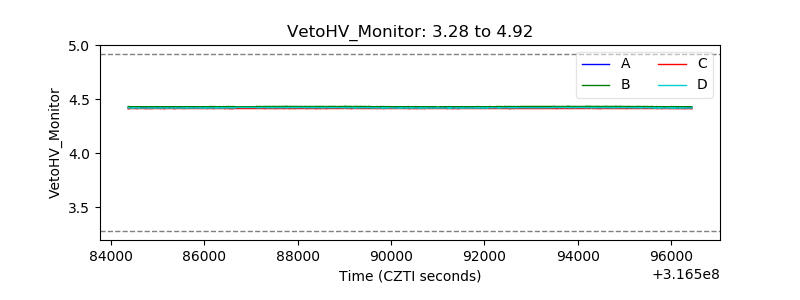 |
| Veto LLD | 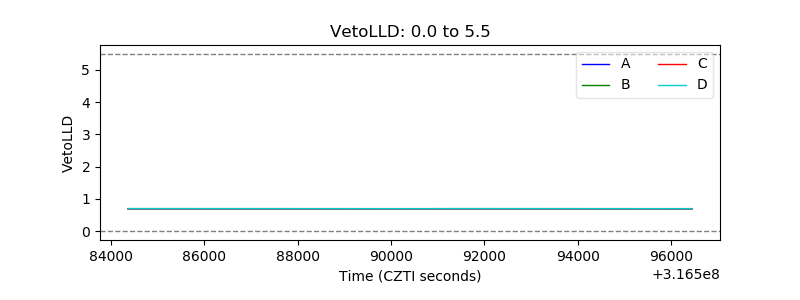 |
| Alpha Counter | 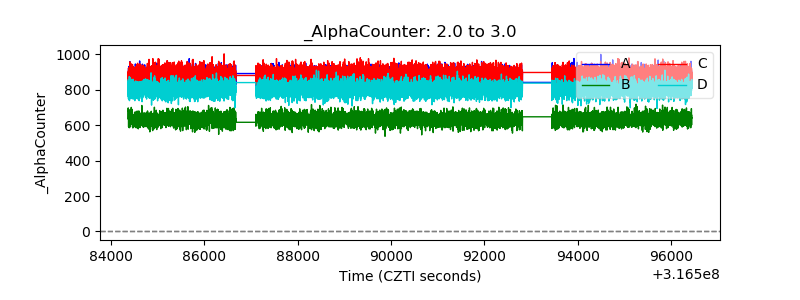 |
| _CPM_Rate | 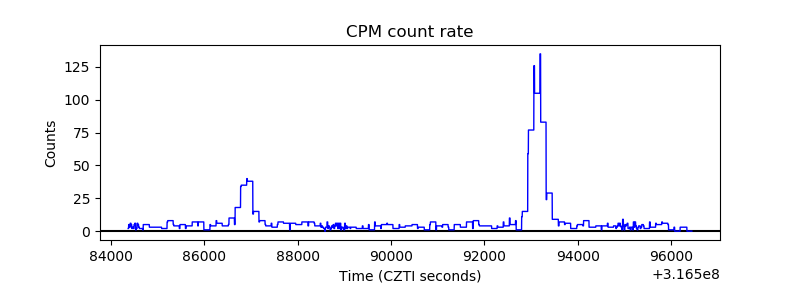 |
| CZT Counter | 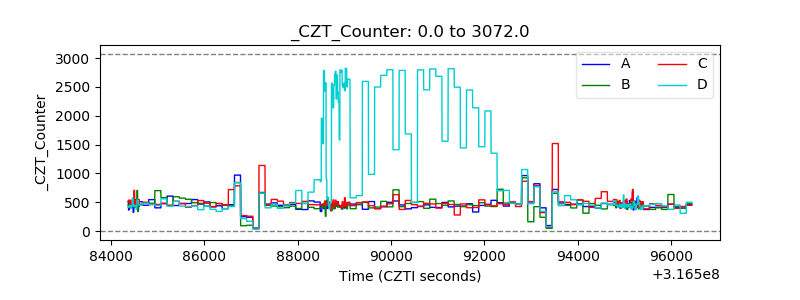 |
| +2.5 Volts monitor |  |
| +5 Volts monitor |  |
| _ROLL_ROT | 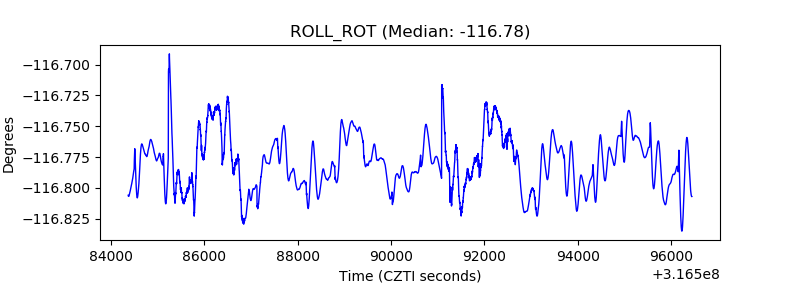 |
| _Roll_DEC | 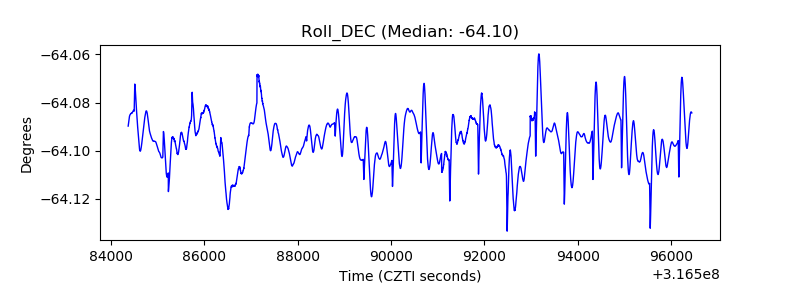 |
| _Roll_RA | 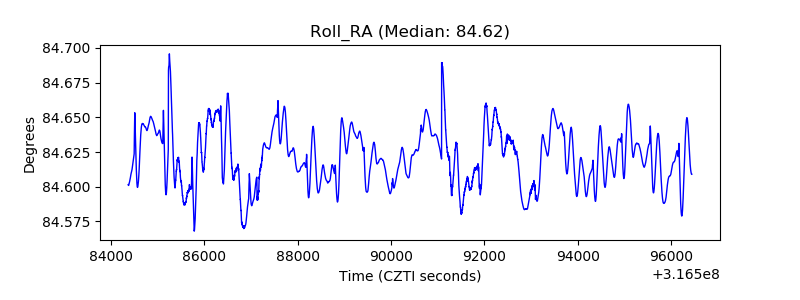 |
| Veto Counter |  |