| Param | Original file | Final file |
|---|---|---|
| Filename | modeM0/AS1A08_008T02_9000003430_23217cztM0_level2.evt | modeM0/AS1A08_008T02_9000003430_23217cztM0_level2_quad_clean.evt |
| Size (bytes) | 504,578,880 | 130,685,760 |
| Size | 481.2 MB | 124.6 MB |
| Events in quadrant A | 3,226,611 | 917,115 |
| Events in quadrant B | 3,476,037 | 928,914 |
| Events in quadrant C | 3,905,773 | 848,296 |
| Events in quadrant D | 4,245,756 | 824,529 |
| Mode M9 | |||
|---|---|---|---|
| Quadrant | BADHDUFLAG | Total packets | Discarded packets |
| A | 0 | 14 | 0 |
| B | 0 | 14 | 0 |
| C | 0 | 14 | 0 |
| D | 0 | 14 | 0 |
| Mode M0 | |||
|---|---|---|---|
| Quadrant | BADHDUFLAG | Total packets | Discarded packets |
| A | 0 | 13639 | 2 |
| B | 0 | 14487 | 2 |
| C | 0 | 15719 | 3 |
| D | 0 | 16953 | 2 |
| Mode SS | |||
|---|---|---|---|
| Quadrant | BADHDUFLAG | Total packets | Discarded packets |
| A | 0 | 128 | 0 |
| B | 0 | 128 | 0 |
| C | 0 | 128 | 0 |
| D | 0 | 128 | 0 |
| Quadrant | Total seconds | Saturated seconds | Saturation percentage |
|---|---|---|---|
| A | 6296 | 46 | 0.730623% |
| B | 6297 | 56 | 0.889312% |
| C | 6296 | 204 | 3.240152% |
| D | 6296 | 214 | 3.398983% |
Noise dominated data is calculated using 1-second bins in cleaned event files. If a bin has >2000 counts, and if more than 50% of those come from <1% of pixels, then it is considered to be noise-dominated and hence unusable.
| Quadrant | # 1 sec bins | Bins with >0 counts | Bins with >2000 counts | High rate bins dominated by noise | Noise dominated (total time) | Noise dominated (detector-on time) | Marked lightcurve |
|---|---|---|---|---|---|---|---|
| A | 7656 | 6297 | 0 | 0 | 0.00% | 0.00% |  |
| B | 7657 | 6298 | 2 | 2 | 0.03% | 0.03% |  |
| C | 7656 | 6297 | 66 | 66 | 0.86% | 1.05% | 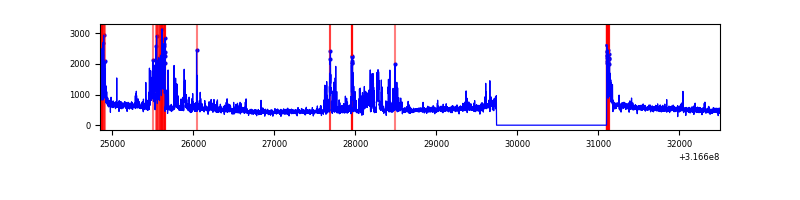 |
| D | 7656 | 6297 | 175 | 175 | 2.29% | 2.78% | 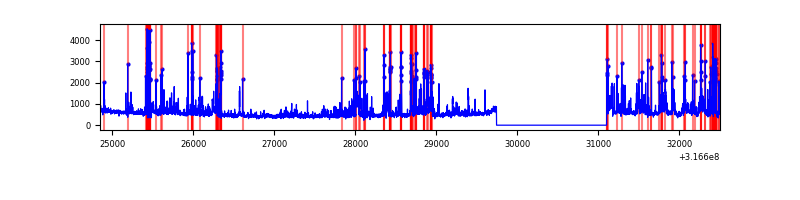 |
Top three noisy pixels from each quadrant. If the there are fewer than three noisy pixels in the level2.evt file, extra rows are filled as -1
| Pixel properties | Quadrant properties | ||||||
|---|---|---|---|---|---|---|---|
| Quadrant | DetID | PixID | Counts | Sigma | Mean | Median | Sigma |
| A | 13 | 254 | 10206 | 56.53 | 835 | 821 | 166.0 |
| A | 0 | 226 | 7386 | 39.55 | 835 | 821 | 166.0 |
| A | 3 | 137 | 6539 | 34.44 | 835 | 821 | 166.0 |
| B | 0 | 190 | 148471 | 945.72 | 834 | 815 | 156.1 |
| B | 15 | 32 | 29255 | 182.16 | 834 | 815 | 156.1 |
| B | 7 | 202 | 22119 | 136.45 | 834 | 815 | 156.1 |
| C | 2 | 16 | 266021 | 1514.81 | 773 | 780 | 175.1 |
| C | 7 | 247 | 264044 | 1503.52 | 773 | 780 | 175.1 |
| C | 0 | 10 | 233531 | 1329.26 | 773 | 780 | 175.1 |
| D | 7 | 238 | 528122 | 2780.1 | 783 | 763 | 189.7 |
| D | 13 | 153 | 223708 | 1175.31 | 783 | 763 | 189.7 |
| D | 1 | 52 | 144696 | 758.78 | 783 | 763 | 189.7 |
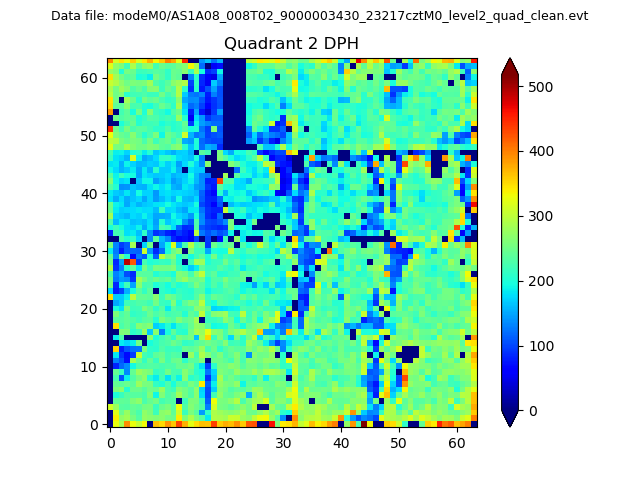
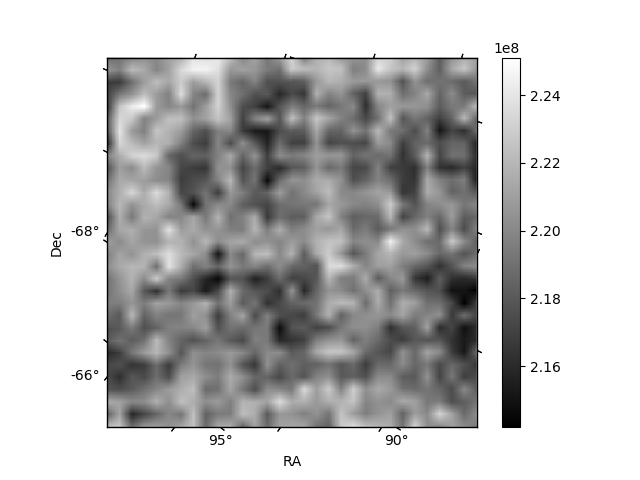
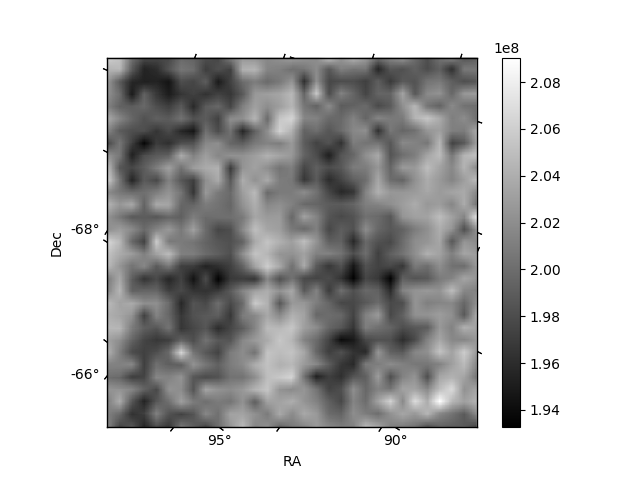
Histogram calculated using DETX and DETY for each event in the final _common_clean file
| Quadrant A | 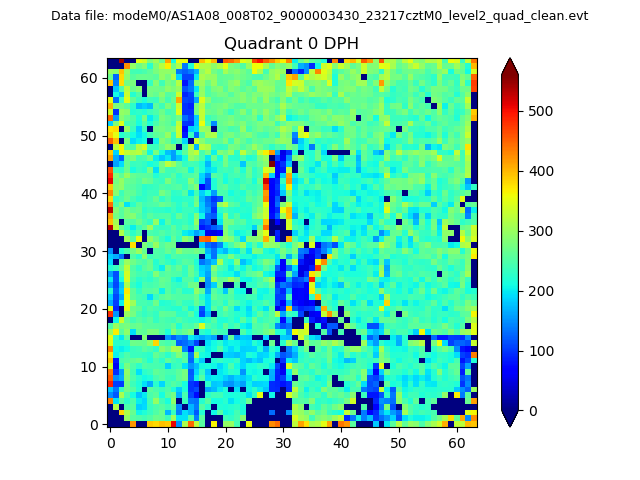 |
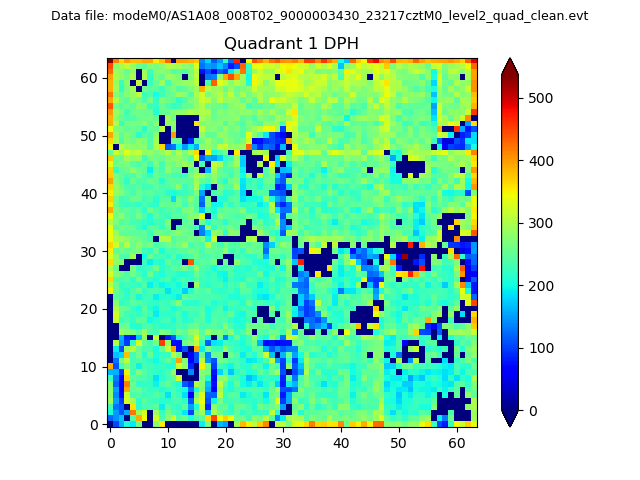 |
Quadrant B |
|---|---|---|---|
| Quadrant D | 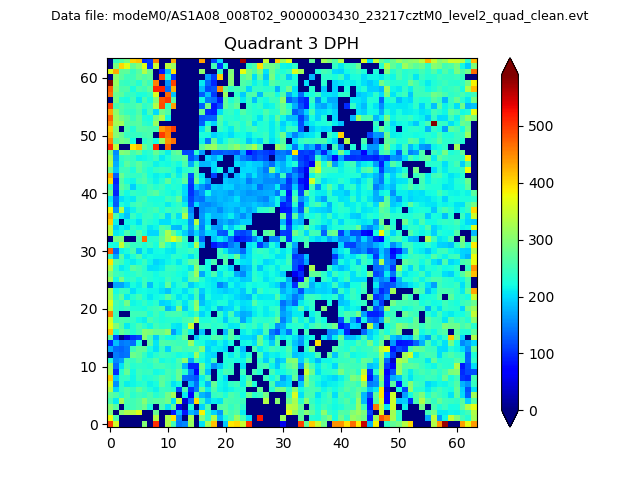 |
 |
Quadrant C |
| Plot type | Count rate plots | Images |
|---|---|---|
| Comparison with Poisson distribution Blue bars denote a histogram of data divided into 1 sec bins. Red curve is a Poisson curve with rate = median count rate of data. |
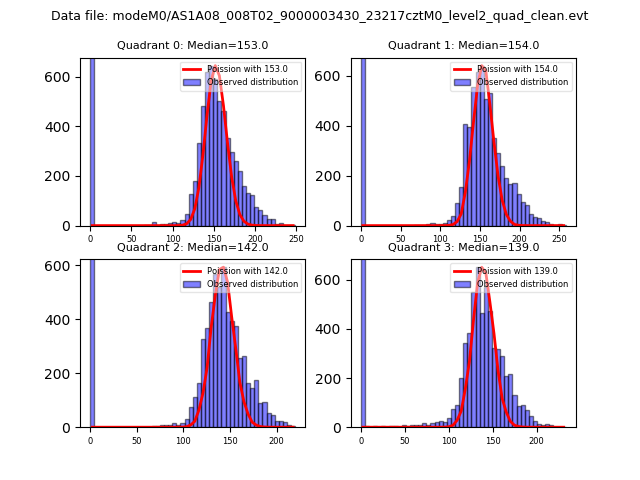 |
 |
| Quadrant-wise count rates Data is divided into 100 sec bins |
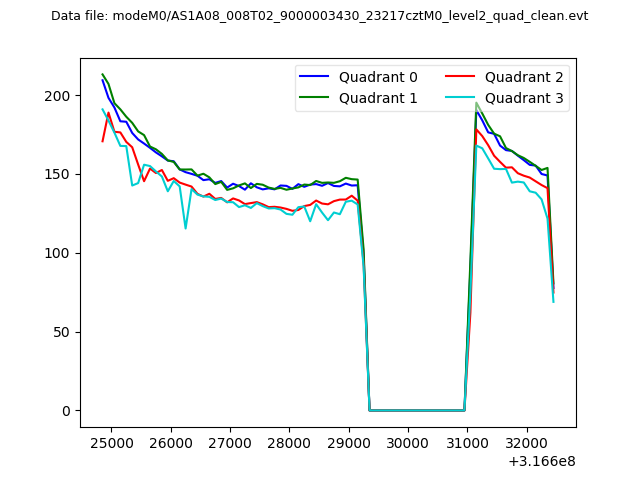 |
|
| Module-wise count rates for Quadrant A Data is divided into 100 sec bins |
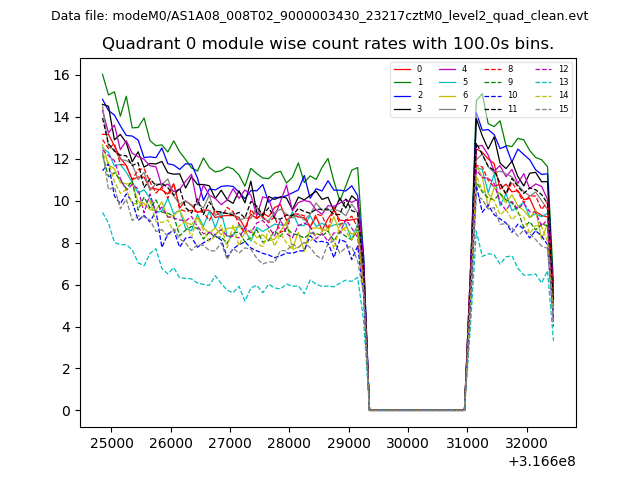 |
 |
| Module-wise count rates for Quadrant B Data is divided into 100 sec bins |
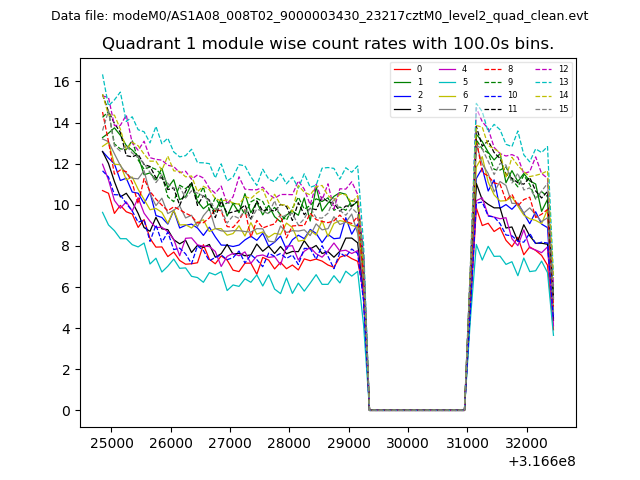 |
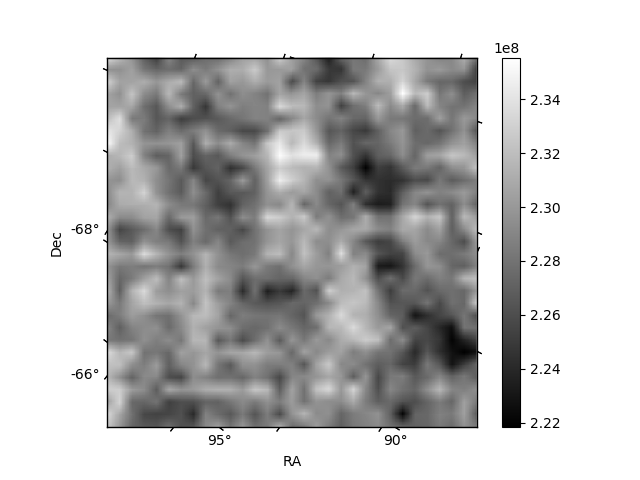 |
| Module-wise count rates for Quadrant C Data is divided into 100 sec bins |
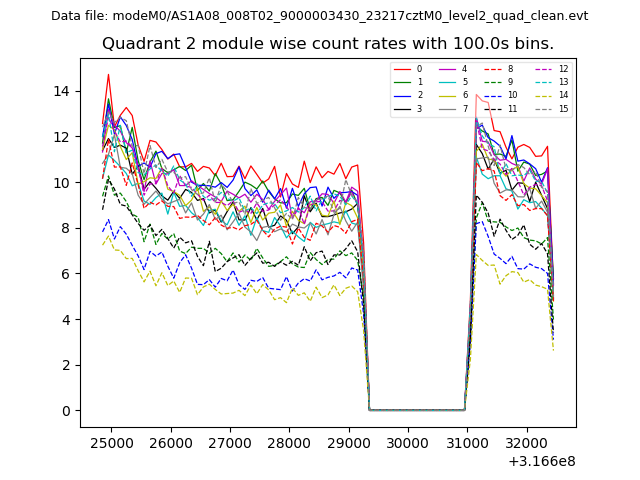 |
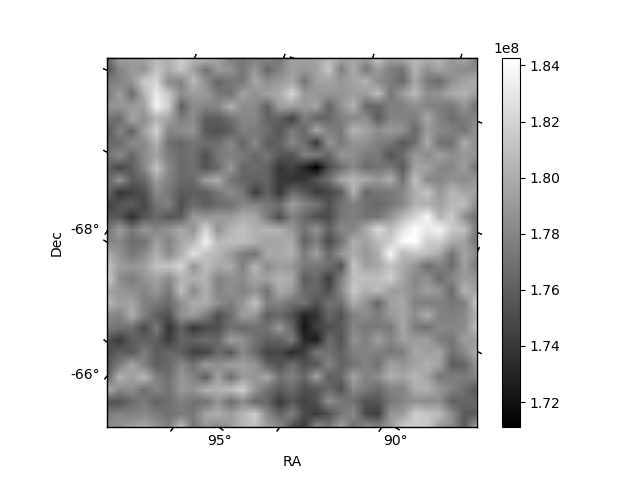 |
| Module-wise count rates for Quadrant D Data is divided into 100 sec bins |
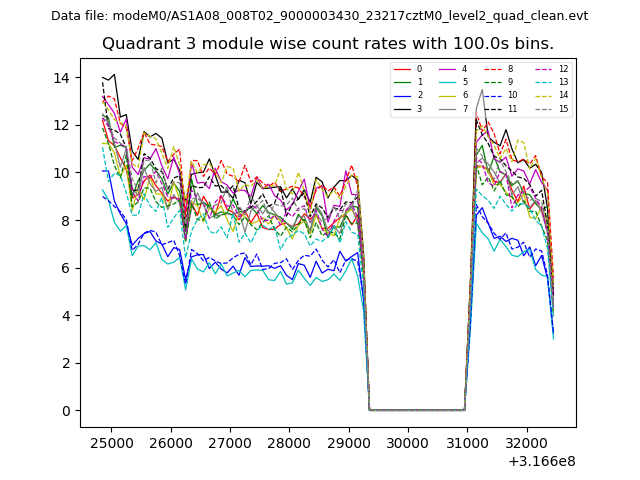 |
 |
| Parameter | Plot |
|---|---|
| CZT HV Monitor | 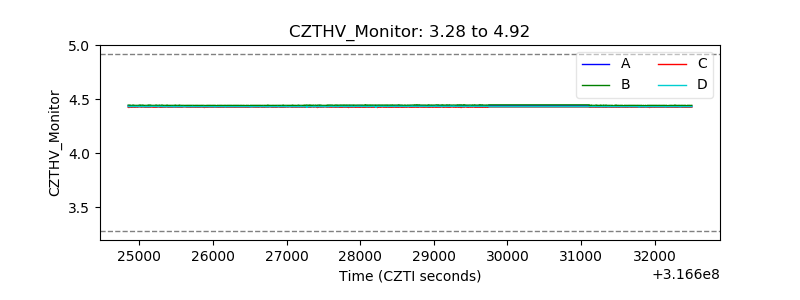 |
| D_VDD | 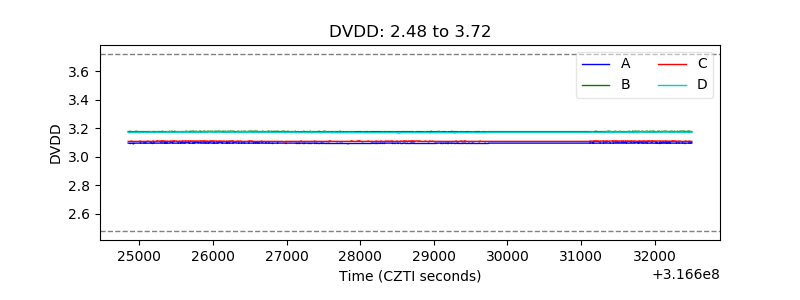 |
| Temperature 1 | 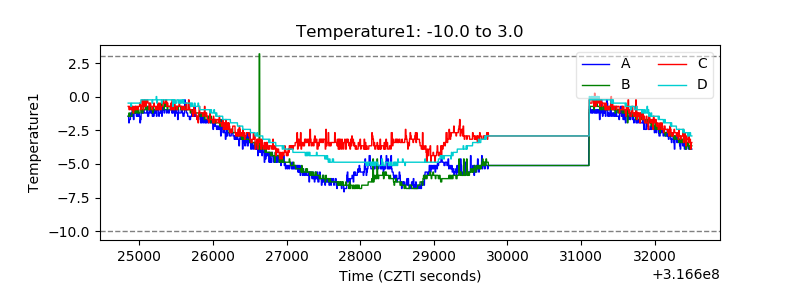 |
| Veto HV Monitor |  |
| Veto LLD | 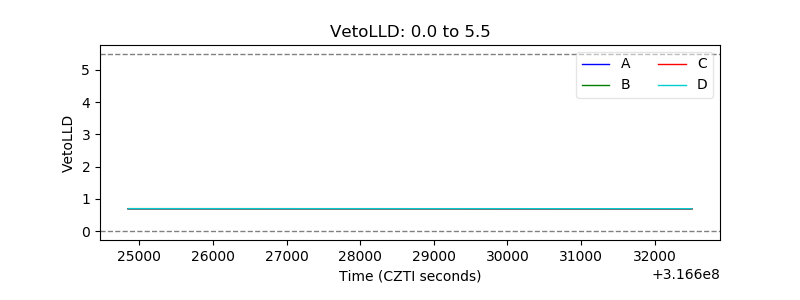 |
| Alpha Counter | 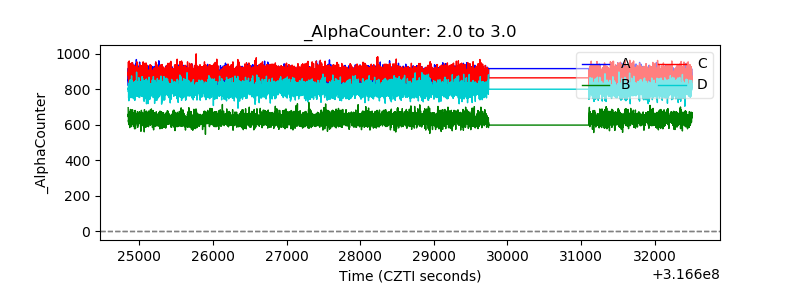 |
| _CPM_Rate | 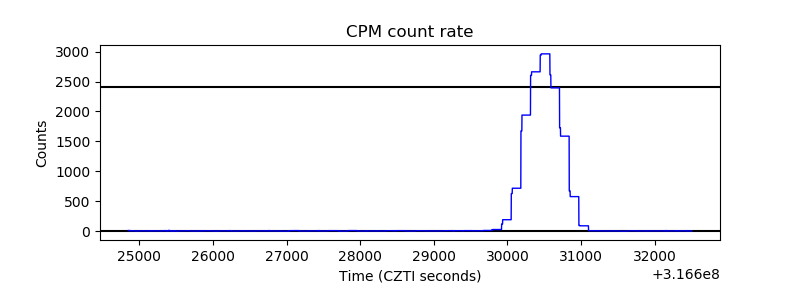 |
| CZT Counter | 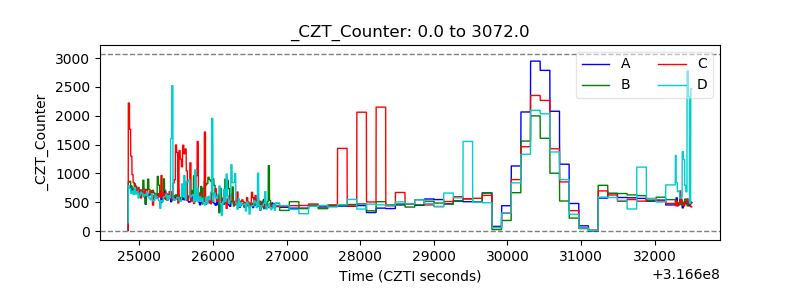 |
| +2.5 Volts monitor |  |
| +5 Volts monitor |  |
| _ROLL_ROT | 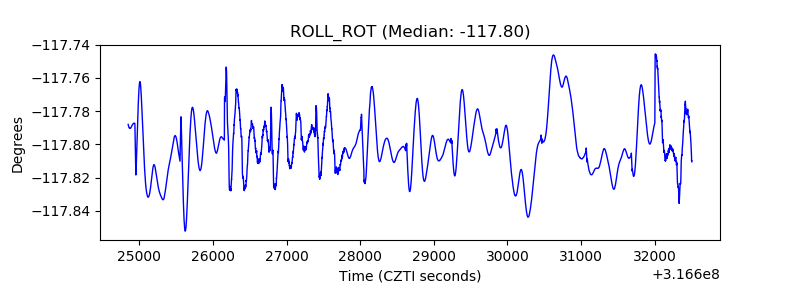 |
| _Roll_DEC | 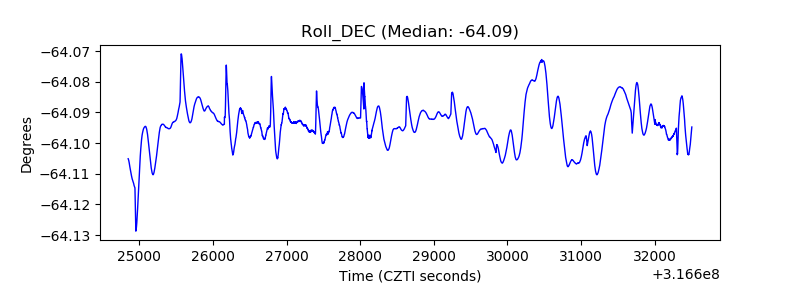 |
| _Roll_RA | 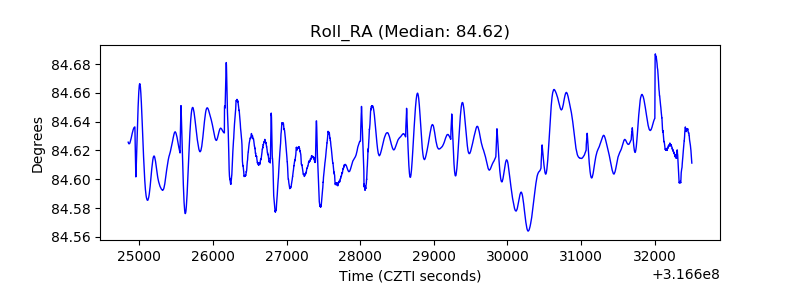 |
| Veto Counter | 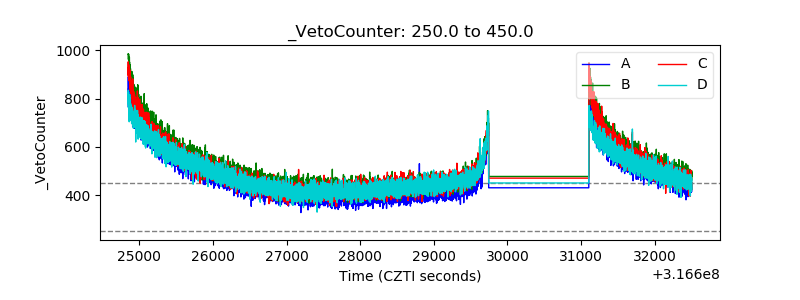 |