| Param | Original file | Final file |
|---|---|---|
| Filename | modeM0/AS1A08_008T02_9000003430_23219cztM0_level2.evt | modeM0/AS1A08_008T02_9000003430_23219cztM0_level2_quad_clean.evt |
| Size (bytes) | 628,418,880 | 114,050,880 |
| Size | 599.3 MB | 108.8 MB |
| Events in quadrant A | 2,983,774 | 814,720 |
| Events in quadrant B | 3,114,798 | 835,501 |
| Events in quadrant C | 4,794,931 | 723,648 |
| Events in quadrant D | 7,712,496 | 641,129 |
| Mode M9 | |||
|---|---|---|---|
| Quadrant | BADHDUFLAG | Total packets | Discarded packets |
| A | 0 | 14 | 0 |
| B | 0 | 15 | 0 |
| C | 0 | 15 | 0 |
| D | 0 | 15 | 0 |
| Mode M0 | |||
|---|---|---|---|
| Quadrant | BADHDUFLAG | Total packets | Discarded packets |
| A | 0 | 13043 | 2 |
| B | 0 | 13309 | 2 |
| C | 0 | 18342 | 2 |
| D | 0 | 27286 | 2 |
| Mode SS | |||
|---|---|---|---|
| Quadrant | BADHDUFLAG | Total packets | Discarded packets |
| A | 0 | 128 | 0 |
| B | 0 | 128 | 0 |
| C | 0 | 128 | 0 |
| D | 0 | 128 | 0 |
| Quadrant | Total seconds | Saturated seconds | Saturation percentage |
|---|---|---|---|
| A | 6278 | 28 | 0.446002% |
| B | 6278 | 39 | 0.621217% |
| C | 6278 | 635 | 10.114686% |
| D | 6277 | 1967 | 31.336626% |
Noise dominated data is calculated using 1-second bins in cleaned event files. If a bin has >2000 counts, and if more than 50% of those come from <1% of pixels, then it is considered to be noise-dominated and hence unusable.
| Quadrant | # 1 sec bins | Bins with >0 counts | Bins with >2000 counts | High rate bins dominated by noise | Noise dominated (total time) | Noise dominated (detector-on time) | Marked lightcurve |
|---|---|---|---|---|---|---|---|
| A | 7473 | 6279 | 0 | 0 | 0.00% | 0.00% | 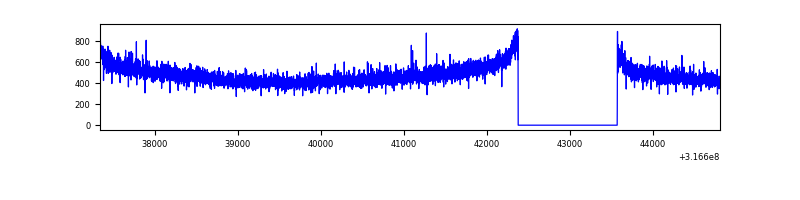 |
| B | 7473 | 6279 | 1 | 1 | 0.01% | 0.02% | 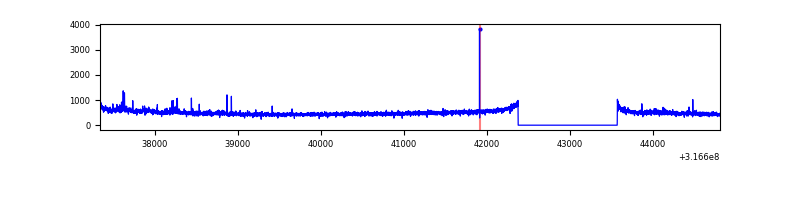 |
| C | 7473 | 6279 | 463 | 463 | 6.20% | 7.37% | 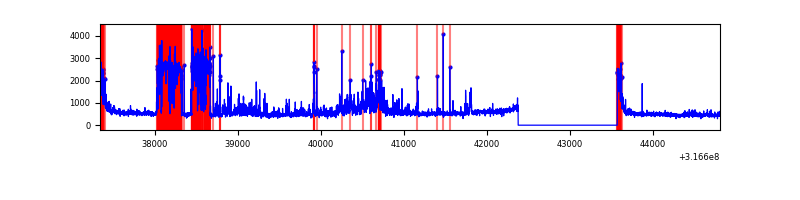 |
| D | 7471 | 6277 | 1815 | 1815 | 24.29% | 28.92% | 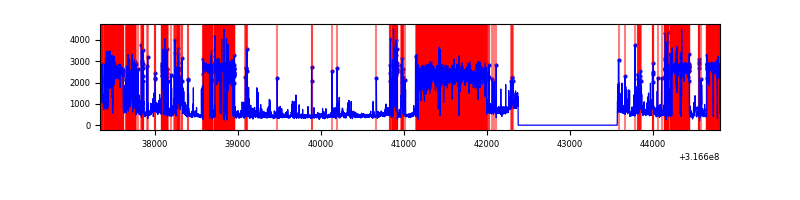 |
Top three noisy pixels from each quadrant. If the there are fewer than three noisy pixels in the level2.evt file, extra rows are filled as -1
| Pixel properties | Quadrant properties | ||||||
|---|---|---|---|---|---|---|---|
| Quadrant | DetID | PixID | Counts | Sigma | Mean | Median | Sigma |
| A | 13 | 254 | 9933 | 59.18 | 773 | 759 | 155.0 |
| A | 0 | 226 | 6669 | 38.12 | 773 | 759 | 155.0 |
| A | 3 | 137 | 6622 | 37.82 | 773 | 759 | 155.0 |
| B | 0 | 190 | 33416 | 224.29 | 779 | 761 | 145.6 |
| B | 3 | 209 | 24261 | 161.41 | 779 | 761 | 145.6 |
| B | 12 | 111 | 16774 | 109.98 | 779 | 761 | 145.6 |
| C | 2 | 16 | 1641543 | 10147.49 | 699 | 703 | 161.7 |
| C | 0 | 10 | 265157 | 1635.47 | 699 | 703 | 161.7 |
| C | 14 | 238 | 113755 | 699.15 | 699 | 703 | 161.7 |
| D | 1 | 52 | 4007403 | 25570.39 | 645 | 625 | 156.7 |
| D | 7 | 238 | 317745 | 2023.79 | 645 | 625 | 156.7 |
| D | 1 | 239 | 252433 | 1606.98 | 645 | 625 | 156.7 |
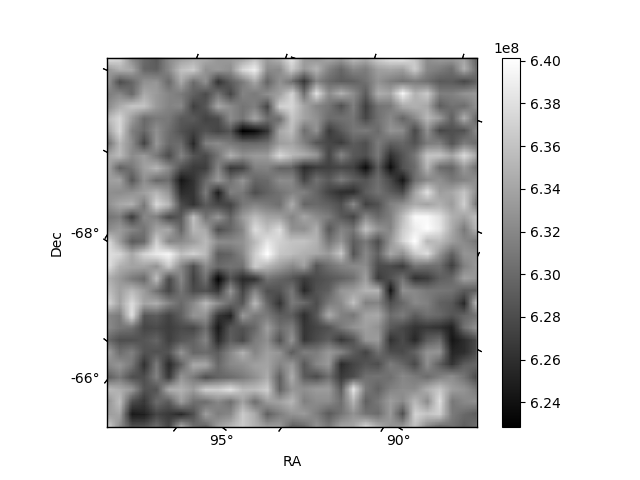
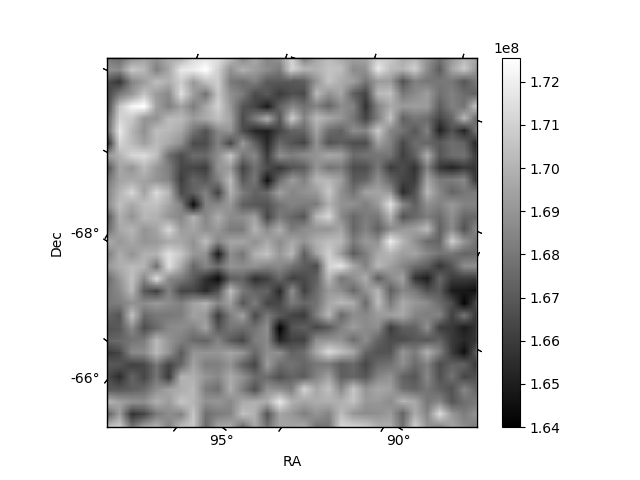
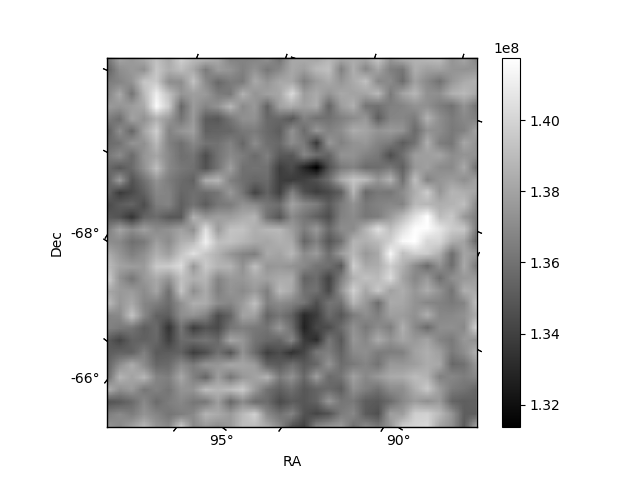
Histogram calculated using DETX and DETY for each event in the final _common_clean file
| Quadrant A | 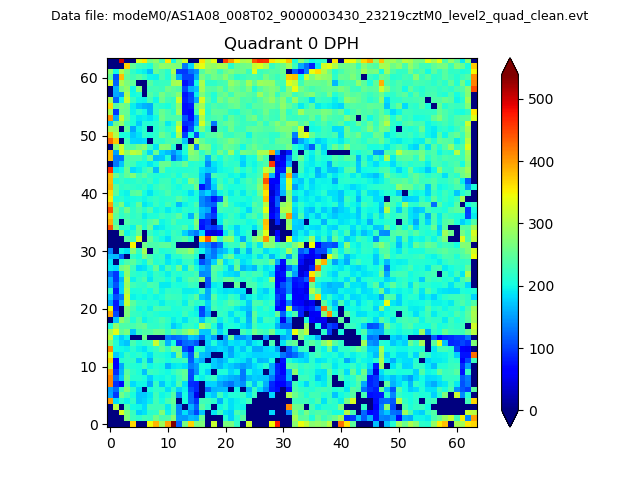 |
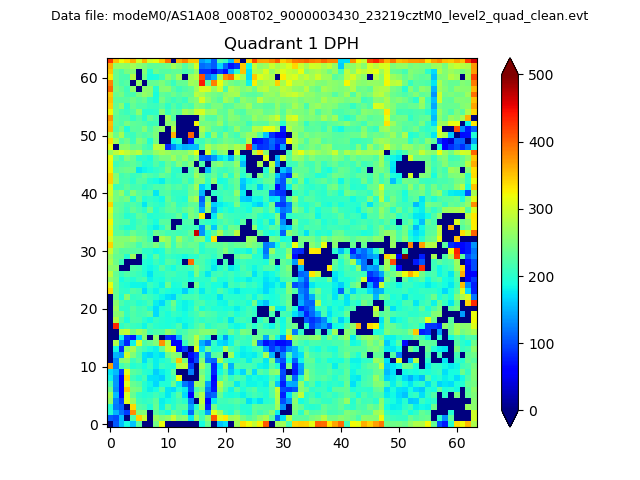 |
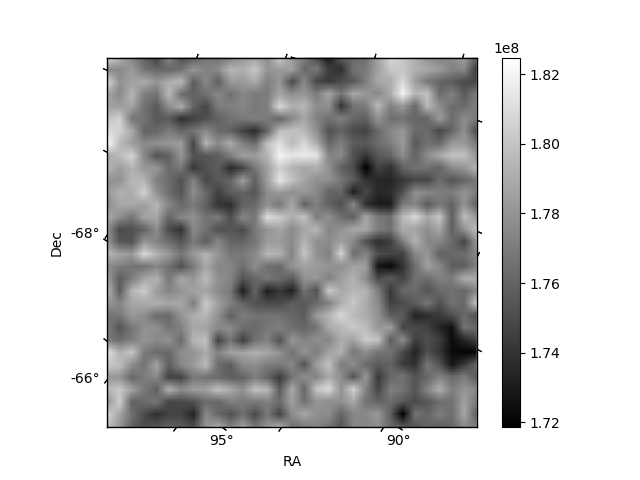
Quadrant B |
|---|---|---|---|
| Quadrant D | 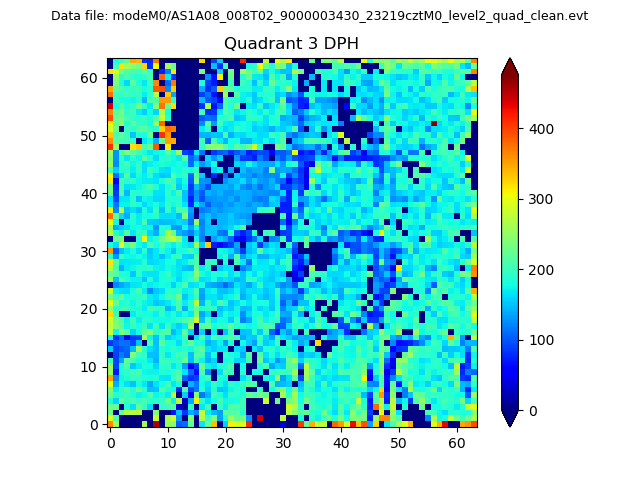 |
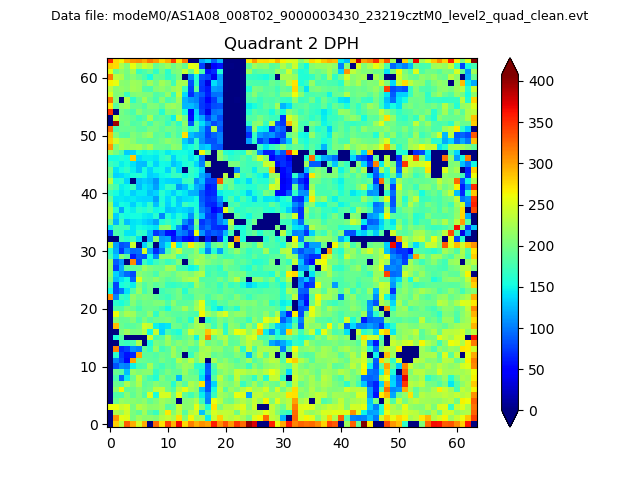 |
Quadrant C |
| Plot type | Count rate plots | Images |
|---|---|---|
| Comparison with Poisson distribution Blue bars denote a histogram of data divided into 1 sec bins. Red curve is a Poisson curve with rate = median count rate of data. |
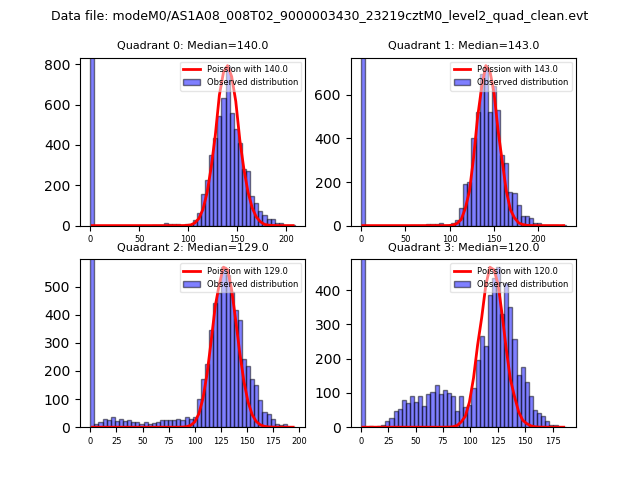 |
 |
| Quadrant-wise count rates Data is divided into 100 sec bins |
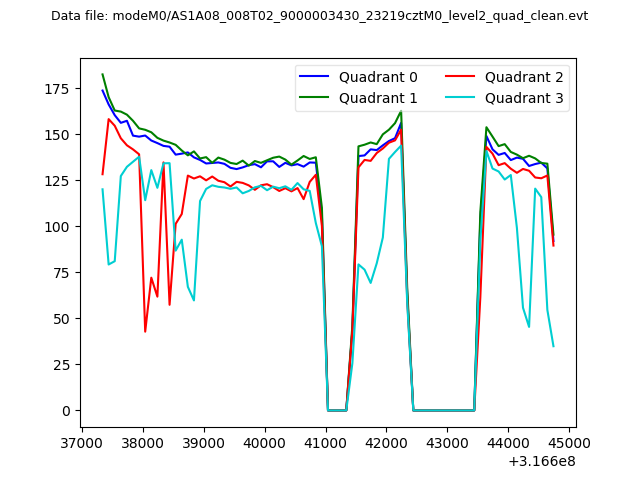 |
|
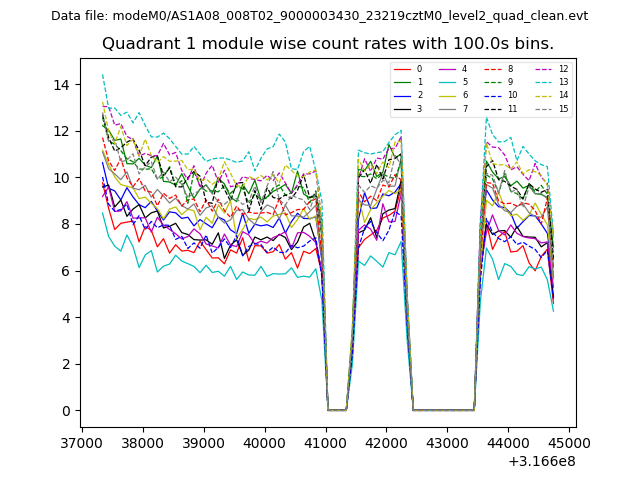
| Module-wise count rates for Quadrant A Data is divided into 100 sec bins |
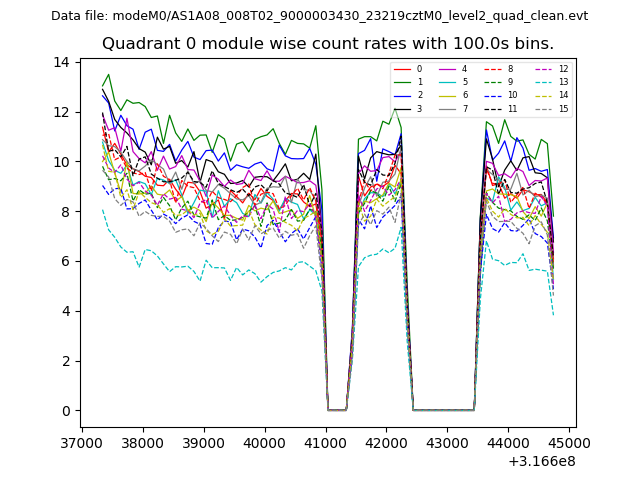 |
 |
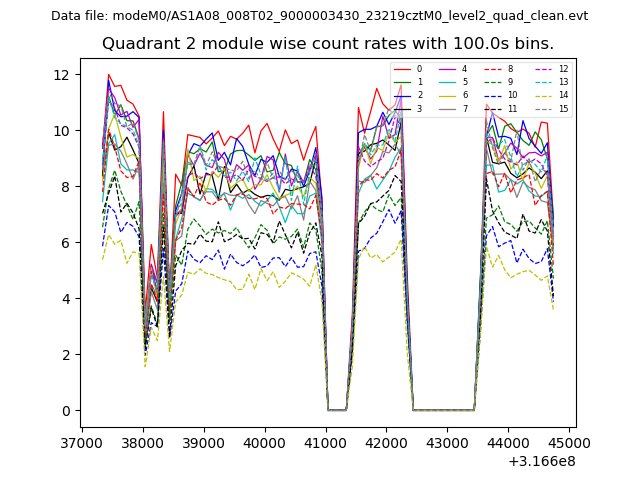
| Module-wise count rates for Quadrant B Data is divided into 100 sec bins |
 |
 |
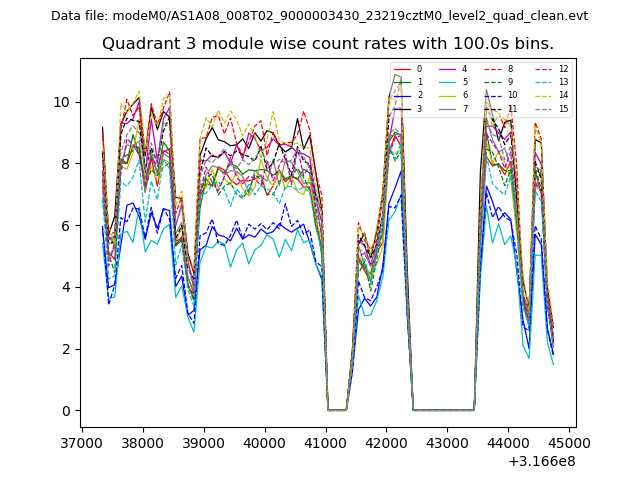
| Module-wise count rates for Quadrant C Data is divided into 100 sec bins |
 |
 |
| Module-wise count rates for Quadrant D Data is divided into 100 sec bins |
 |
 |
| Parameter | Plot |
|---|---|
| CZT HV Monitor | 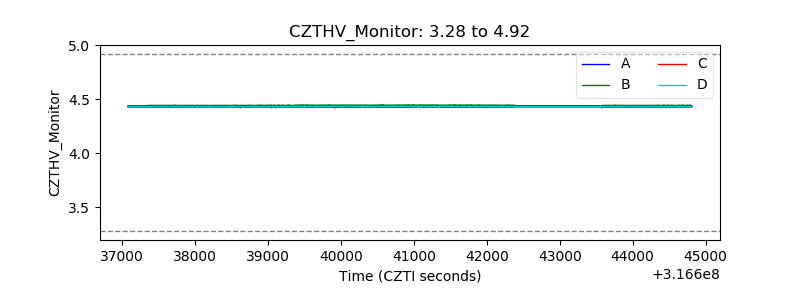 |
| D_VDD |  |
| Temperature 1 | 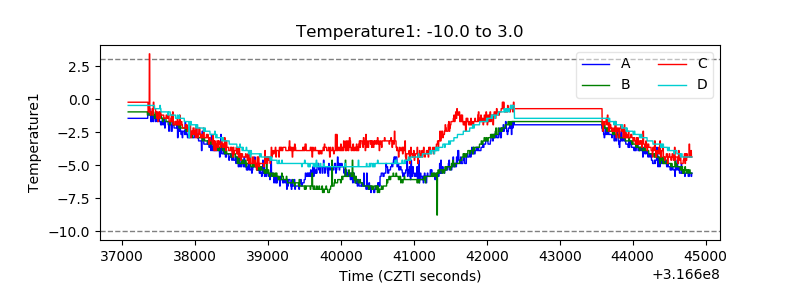 |
| Veto HV Monitor |  |
| Veto LLD | 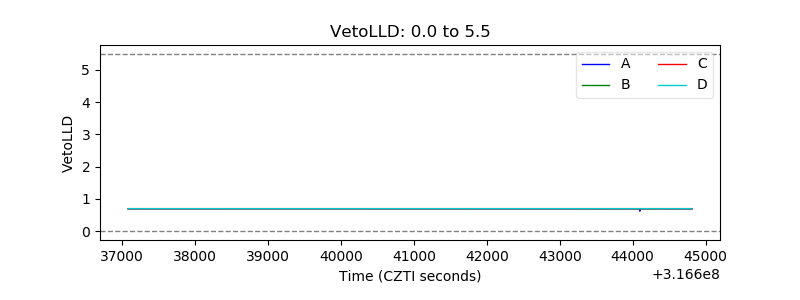 |
| Alpha Counter | 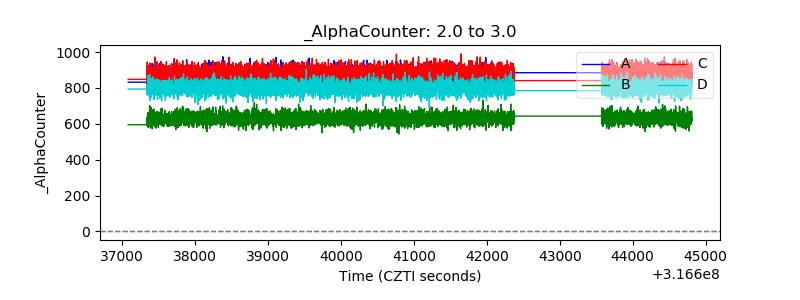 |
| _CPM_Rate | 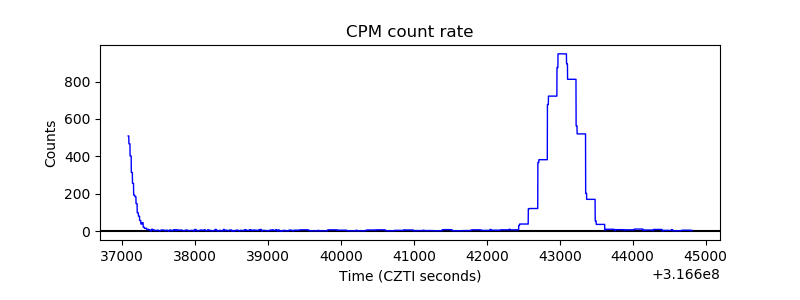 |
| CZT Counter | 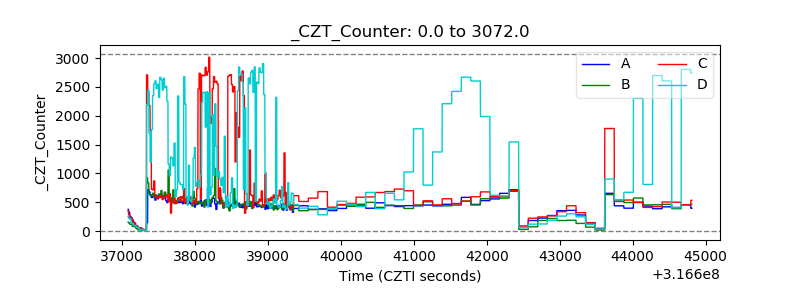 |
| +2.5 Volts monitor |  |
| +5 Volts monitor |  |
| _ROLL_ROT | 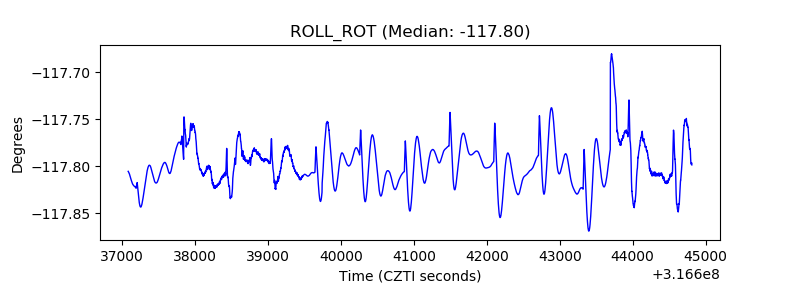 |
| _Roll_DEC | 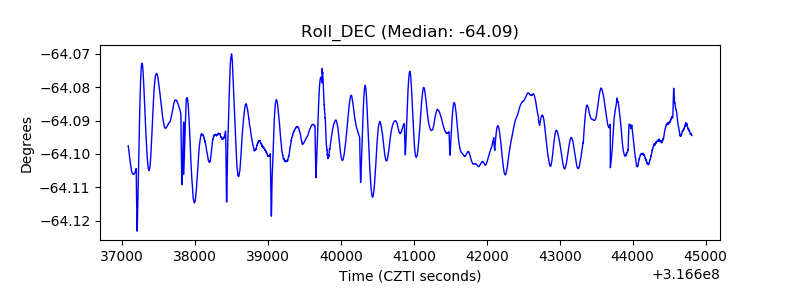 |
| _Roll_RA |  |
| Veto Counter | 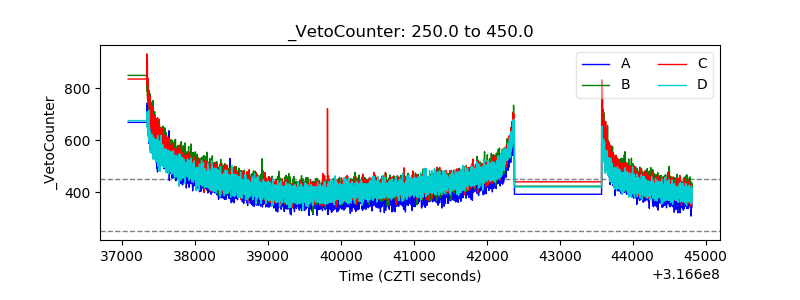 |