| Param | Original file | Final file |
|---|---|---|
| Filename | modeM0/AS1A08_008T02_9000003430_23222cztM0_level2.evt | modeM0/AS1A08_008T02_9000003430_23222cztM0_level2_quad_clean.evt |
| Size (bytes) | 150,494,400 | 30,988,800 |
| Size | 143.5 MB | 29.6 MB |
| Events in quadrant A | 726,850 | 220,130 |
| Events in quadrant B | 756,272 | 225,293 |
| Events in quadrant C | 763,829 | 209,750 |
| Events in quadrant D | 2,196,498 | 161,757 |
| Mode M0 | |||
|---|---|---|---|
| Quadrant | BADHDUFLAG | Total packets | Discarded packets |
| A | 0 | 3297 | 0 |
| B | 0 | 3317 | 0 |
| C | 0 | 3347 | 0 |
| D | 0 | 7624 | 0 |
| Mode SS | |||
|---|---|---|---|
| Quadrant | BADHDUFLAG | Total packets | Discarded packets |
| A | 0 | 32 | 0 |
| B | 0 | 32 | 0 |
| C | 0 | 32 | 0 |
| D | 0 | 32 | 0 |
| Quadrant | Total seconds | Saturated seconds | Saturation percentage |
|---|---|---|---|
| A | 1643 | 0 | 0.000000% |
| B | 1644 | 1 | 0.060827% |
| C | 1644 | 2 | 0.121655% |
| D | 1644 | 554 | 33.698297% |
Noise dominated data is calculated using 1-second bins in cleaned event files. If a bin has >2000 counts, and if more than 50% of those come from <1% of pixels, then it is considered to be noise-dominated and hence unusable.
| Quadrant | # 1 sec bins | Bins with >0 counts | Bins with >2000 counts | High rate bins dominated by noise | Noise dominated (total time) | Noise dominated (detector-on time) | Marked lightcurve |
|---|---|---|---|---|---|---|---|
| A | 1643 | 1643 | 0 | 0 | 0.00% | 0.00% | 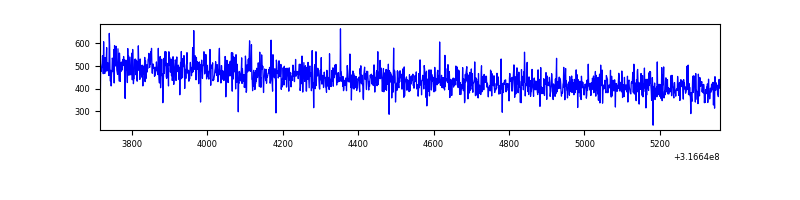 |
| B | 1644 | 1644 | 0 | 0 | 0.00% | 0.00% | 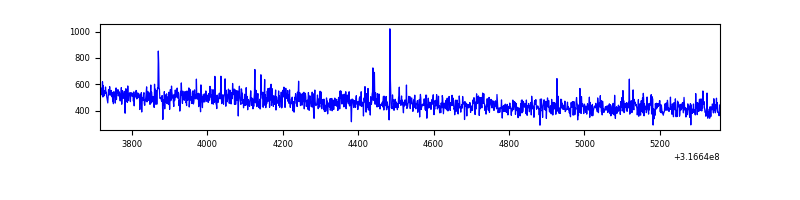 |
| C | 1644 | 1644 | 0 | 0 | 0.00% | 0.00% | 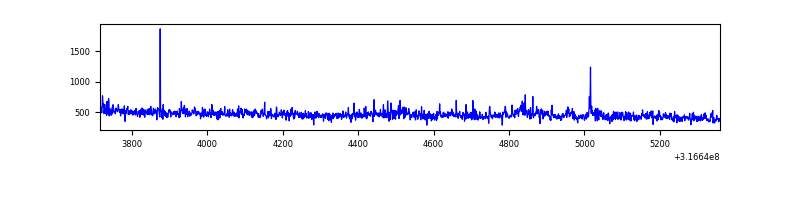 |
| D | 1644 | 1644 | 544 | 544 | 33.09% | 33.09% | 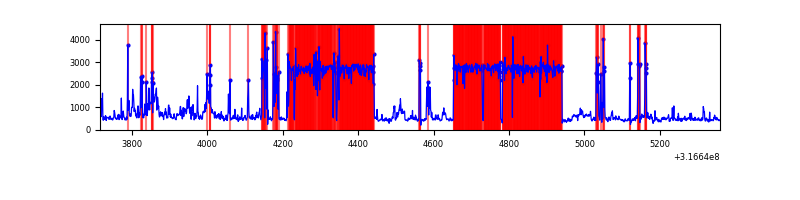 |
Top three noisy pixels from each quadrant. If the there are fewer than three noisy pixels in the level2.evt file, extra rows are filled as -1
| Pixel properties | Quadrant properties | ||||||
|---|---|---|---|---|---|---|---|
| Quadrant | DetID | PixID | Counts | Sigma | Mean | Median | Sigma |
| A | 13 | 254 | 2880 | 67.65 | 188 | 184 | 39.9 |
| A | 3 | 137 | 1604 | 35.63 | 188 | 184 | 39.9 |
| A | 0 | 226 | 1598 | 35.48 | 188 | 184 | 39.9 |
| B | 0 | 190 | 4350 | 109.71 | 191 | 187 | 37.9 |
| B | 12 | 111 | 4193 | 105.57 | 191 | 187 | 37.9 |
| B | 3 | 209 | 4023 | 101.09 | 191 | 187 | 37.9 |
| C | 0 | 10 | 34541 | 805.44 | 177 | 178 | 42.7 |
| C | 14 | 238 | 29043 | 676.57 | 177 | 178 | 42.7 |
| C | 0 | 239 | 5330 | 120.76 | 177 | 178 | 42.7 |
| D | 1 | 52 | 1358284 | 35687.41 | 147 | 143 | 38.1 |
| D | 7 | 238 | 92496 | 2426.73 | 147 | 143 | 38.1 |
| D | 12 | 233 | 53219 | 1394.66 | 147 | 143 | 38.1 |
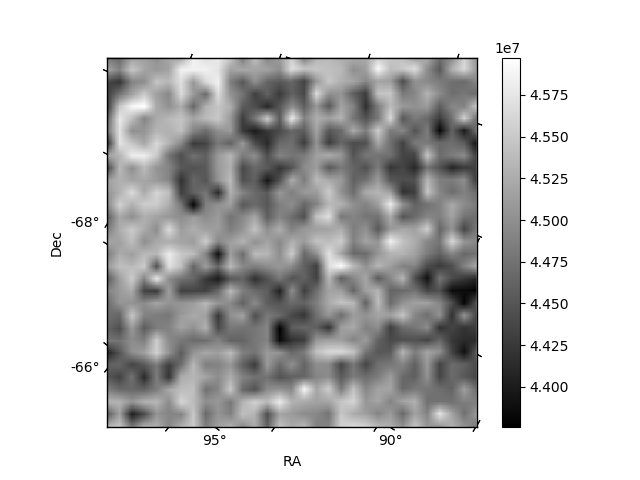
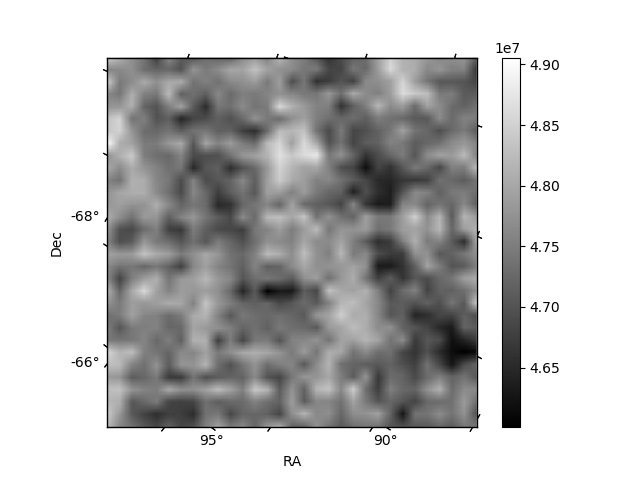
Histogram calculated using DETX and DETY for each event in the final _common_clean file
| Quadrant A |  |
 |
Quadrant B |
|---|---|---|---|
| Quadrant D |  |
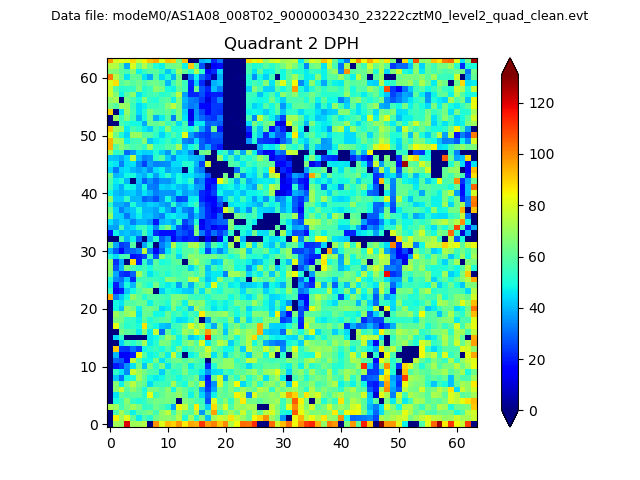 |
Quadrant C |
| Plot type | Count rate plots | Images |
|---|---|---|
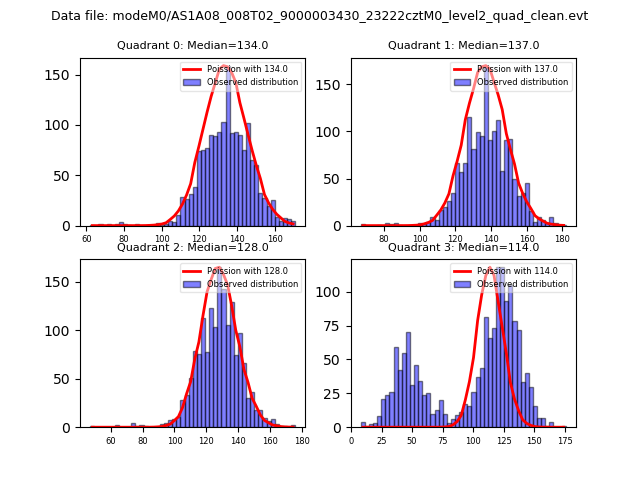
| Comparison with Poisson distribution Blue bars denote a histogram of data divided into 1 sec bins. Red curve is a Poisson curve with rate = median count rate of data. |
 |
 |
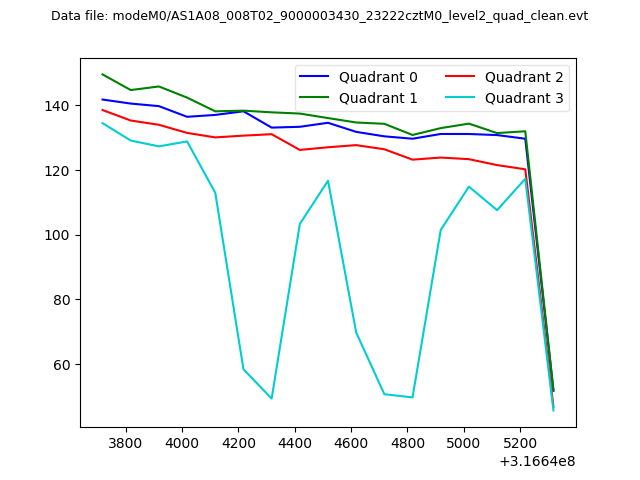
| Quadrant-wise count rates Data is divided into 100 sec bins |
 |
|
| Module-wise count rates for Quadrant A Data is divided into 100 sec bins |
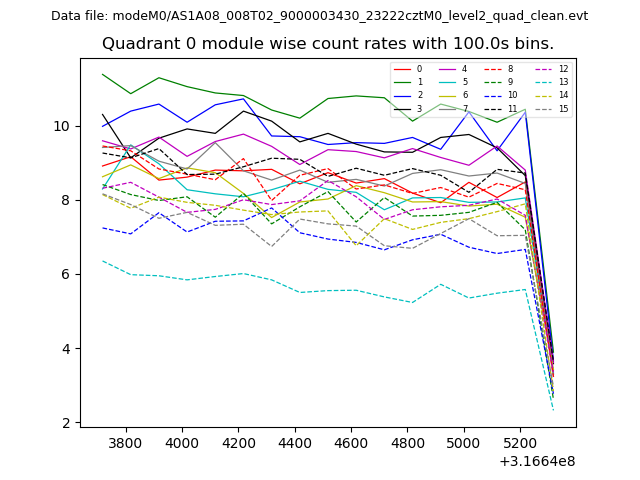 |
 |
| Module-wise count rates for Quadrant B Data is divided into 100 sec bins |
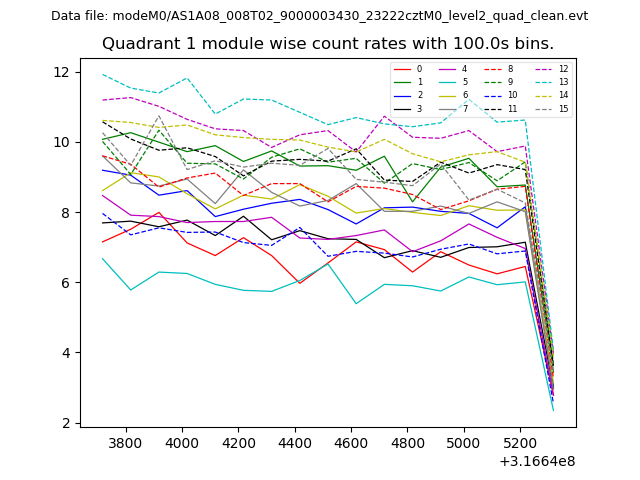 |
 |
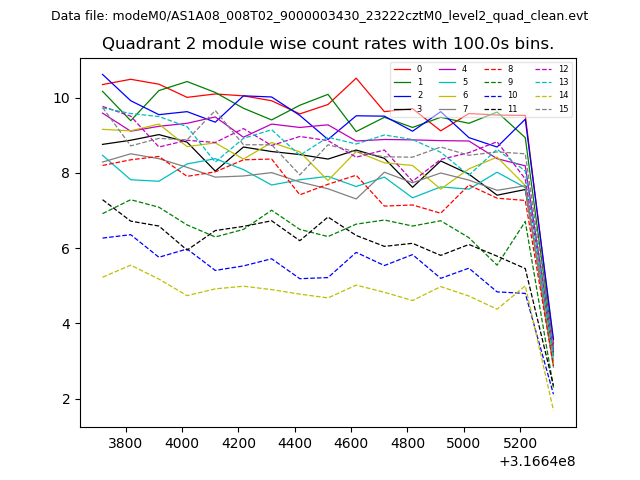
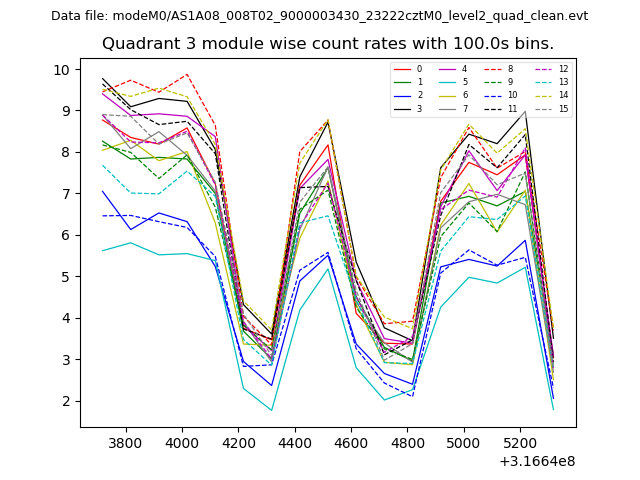
| Module-wise count rates for Quadrant C Data is divided into 100 sec bins |
 |
 |
| Module-wise count rates for Quadrant D Data is divided into 100 sec bins |
 |
 |
| Parameter | Plot |
|---|---|
| CZT HV Monitor | 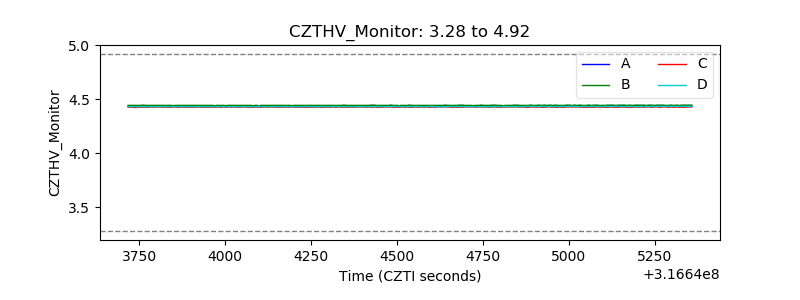 |
| D_VDD | 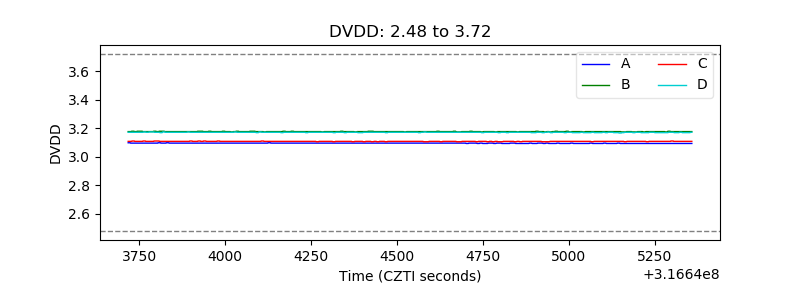 |
| Temperature 1 | 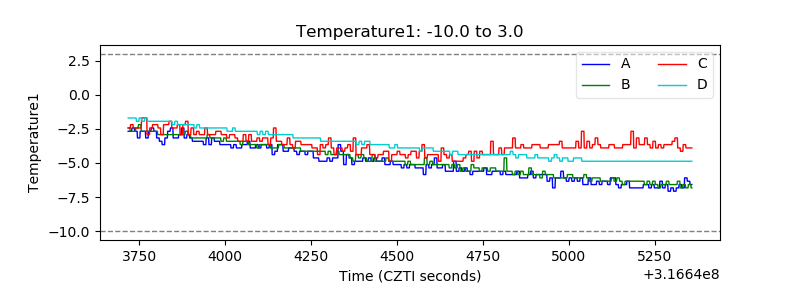 |
| Veto HV Monitor | 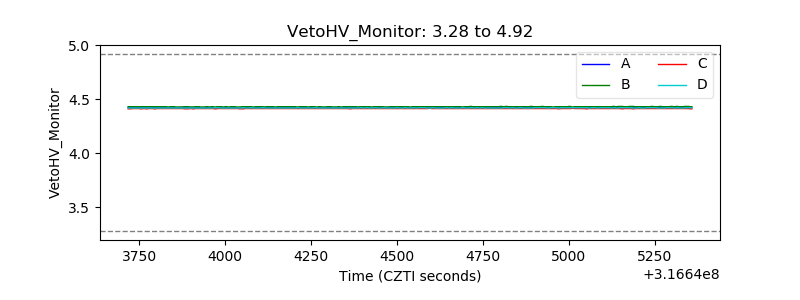 |
| Veto LLD |  |
| Alpha Counter | 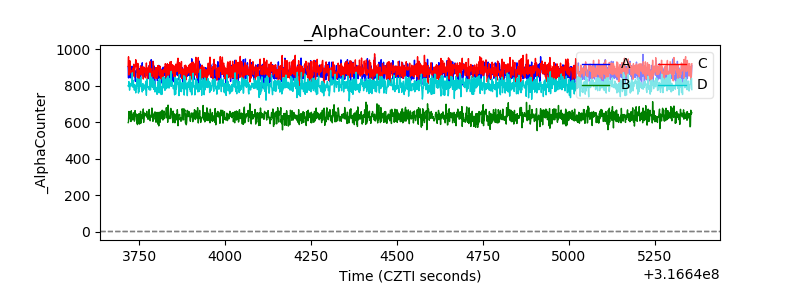 |
| _CPM_Rate | 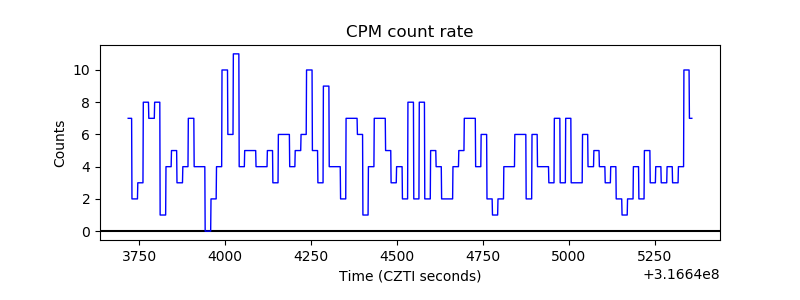 |
| CZT Counter | 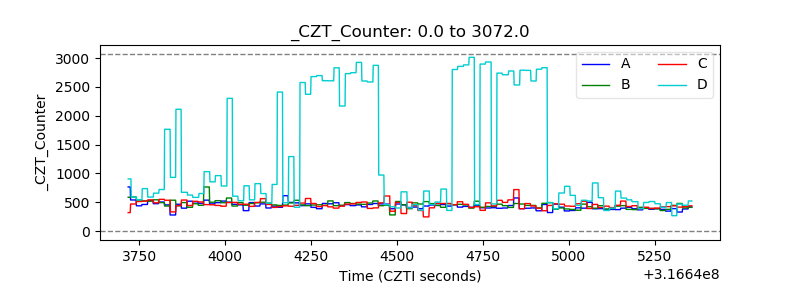 |
| +2.5 Volts monitor |  |
| +5 Volts monitor | 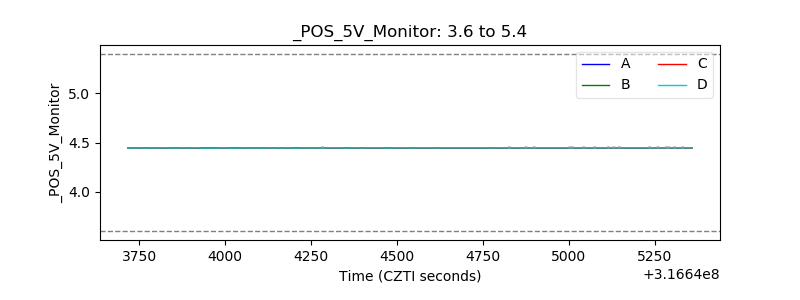 |
| _ROLL_ROT | 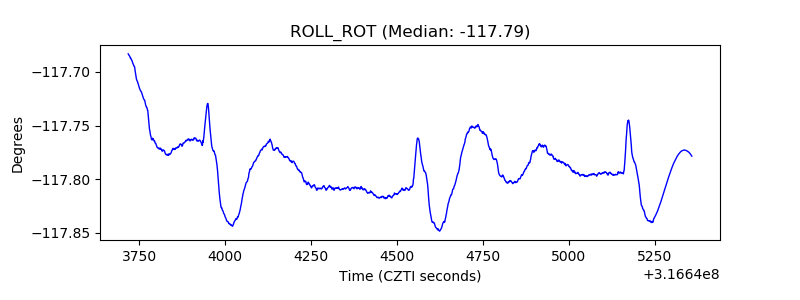 |
| _Roll_DEC | 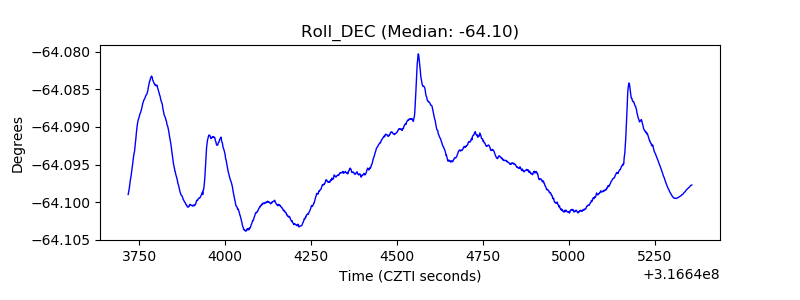 |
| _Roll_RA | 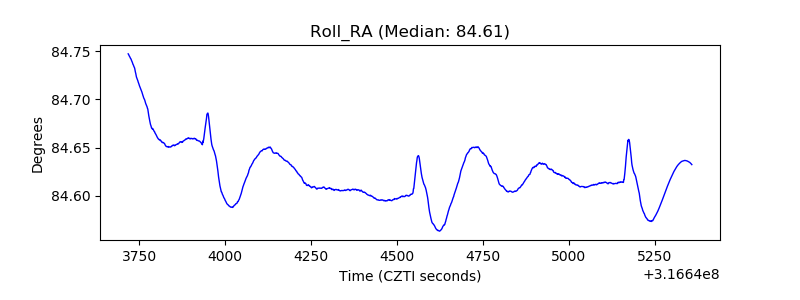 |
| Veto Counter | 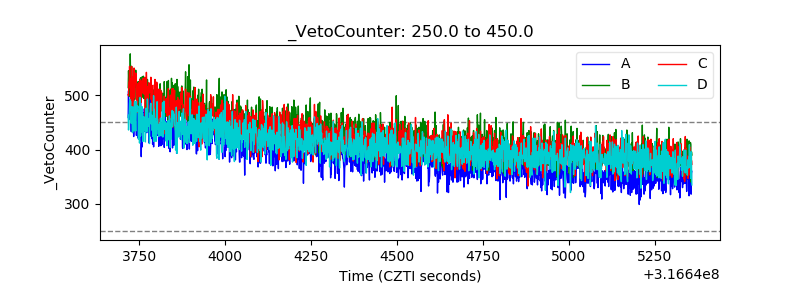 |