| Param | Original file | Final file |
|---|---|---|
| Filename | modeM0/AS1C05_002T02_9000003432cztM0_level2.fits | modeM0/AS1C05_002T02_9000003432cztM0_level2_quad_clean.evt |
| Size (bytes) | 90,587,520 | 81,547,200 |
| Size | 86.4 MB | 77.8 MB |
| Events in quadrant A | 557,066 | 472,702 |
| Events in quadrant B | 541,170 | 481,592 |
| Events in quadrant C | 521,596 | 429,470 |
| Events in quadrant D | 445,322 | 407,164 |
| Mode M9 | |||
|---|---|---|---|
| Quadrant | BADHDUFLAG | Total packets | Discarded packets |
| A | 0 | 13 | 0 |
| B | 0 | 13 | 0 |
| C | 0 | 13 | 0 |
| D | 0 | 13 | 0 |
| Mode SS | |||
|---|---|---|---|
| Quadrant | BADHDUFLAG | Total packets | Discarded packets |
| A | 0 | 202 | 0 |
| B | 0 | 200 | 0 |
| C | 0 | 202 | 0 |
| D | 0 | 204 | 0 |
| Mode M0 | |||
|---|---|---|---|
| Quadrant | BADHDUFLAG | Total packets | Discarded packets |
| A | 0 | 20002 | 0 |
| B | 0 | 20348 | 0 |
| C | 0 | 30501 | 0 |
| D | 0 | 29622 | 0 |
| Quadrant | Total seconds | Saturated seconds | Saturation percentage |
|---|---|---|---|
| A | 9782 | 37 | 0.378246% |
| B | 9788 | 84 | 0.858194% |
| C | 9765 | 745 | 7.629288% |
| D | 9738 | 996 | 10.227973% |
Noise dominated data is calculated using 1-second bins in cleaned event files. If a bin has >2000 counts, and if more than 50% of those come from <1% of pixels, then it is considered to be noise-dominated and hence unusable.
| Quadrant | # 1 sec bins | Bins with >0 counts | Bins with >2000 counts | High rate bins dominated by noise | Noise dominated (total time) | Noise dominated (detector-on time) | Marked lightcurve |
|---|---|---|---|---|---|---|---|
| A | 12958 | 9844 | 0 | 0 | 0.00% | 0.00% | 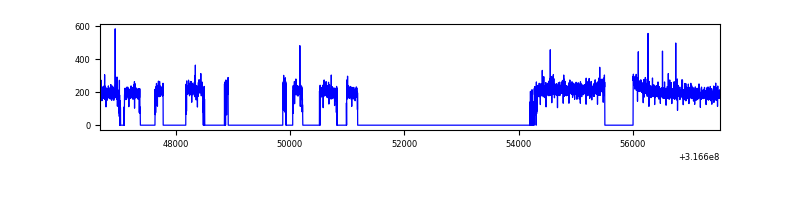 |
| B | 12958 | 9847 | 0 | 0 | 0.00% | 0.00% |  |
| C | 12958 | 9826 | 0 | 0 | 0.00% | 0.00% | 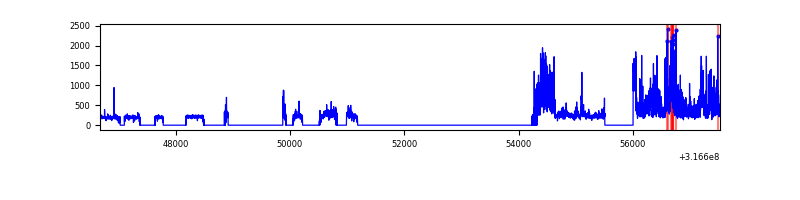 |
| D | 12958 | 9775 | 0 | 0 | 0.00% | 0.00% | 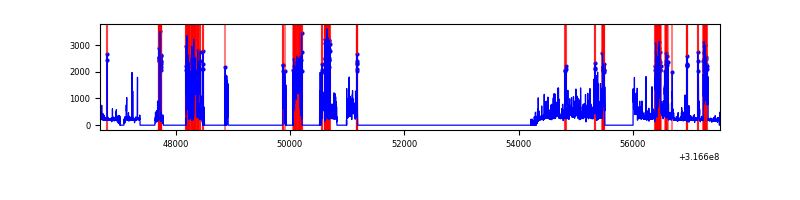 |
Top three noisy pixels from each quadrant. If the there are fewer than three noisy pixels in the level2.evt file, extra rows are filled as -1
| Pixel properties | Quadrant properties | ||||||
|---|---|---|---|---|---|---|---|
| Quadrant | DetID | PixID | Counts | Sigma | Mean | Median | Sigma |
| A | 0 | 29 | 566 | 11.37 | 144 | 136 | 37.8 |
| A | 9 | 19 | 440 | 8.04 | 144 | 136 | 37.8 |
| A | 0 | 30 | 428 | 7.72 | 144 | 136 | 37.8 |
| B | 2 | 9 | 435 | 9.9 | 142 | 135 | 30.3 |
| B | 5 | 128 | 375 | 7.92 | 142 | 135 | 30.3 |
| B | 3 | 17 | 373 | 7.85 | 142 | 135 | 30.3 |
| C | 12 | 241 | 392 | 7.1 | 137 | 128 | 37.2 |
| C | 9 | 209 | 365 | 6.37 | 137 | 128 | 37.2 |
| C | 3 | 187 | 361 | 6.27 | 137 | 128 | 37.2 |
| D | 15 | 46 | 362 | 6.79 | 127 | 115 | 36.4 |
| D | 3 | 31 | 352 | 6.51 | 127 | 115 | 36.4 |
| D | 6 | 231 | 328 | 5.85 | 127 | 115 | 36.4 |
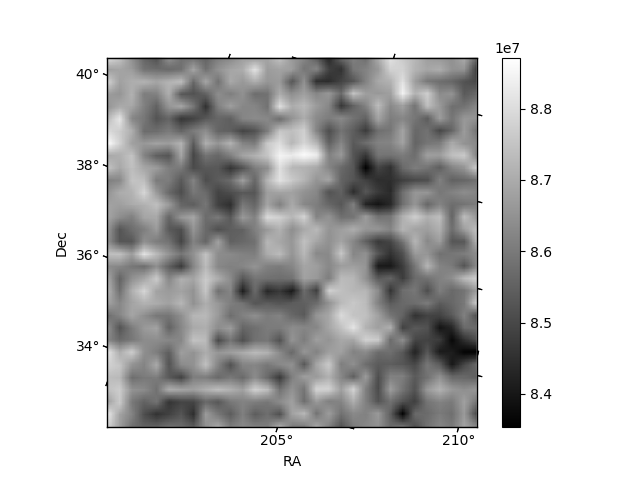
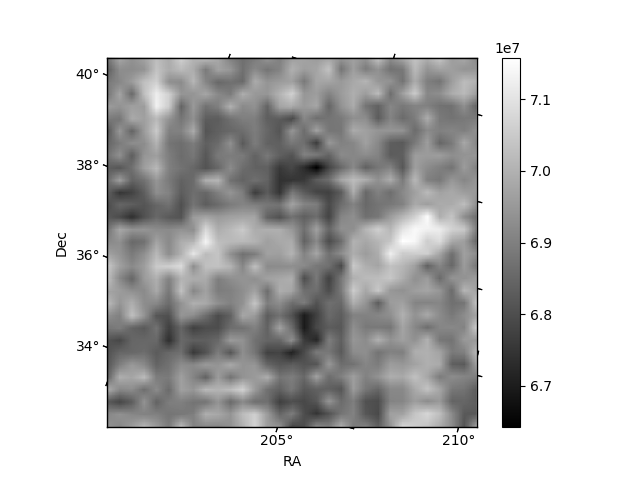
Histogram calculated using DETX and DETY for each event in the final _common_clean file
| Quadrant A | 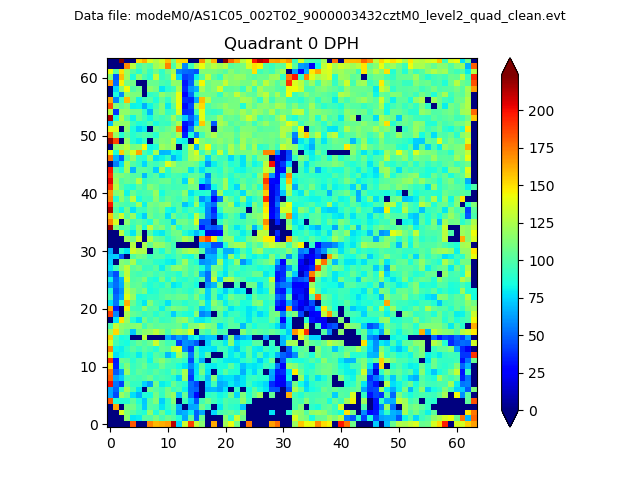 |
 |
Quadrant B |
|---|---|---|---|
| Quadrant D |  |
 |
Quadrant C |
| Plot type | Count rate plots | Images |
|---|---|---|
| Comparison with Poisson distribution Blue bars denote a histogram of data divided into 1 sec bins. Red curve is a Poisson curve with rate = median count rate of data. |
 |
 |
| Quadrant-wise count rates Data is divided into 100 sec bins |
 |
|
| Module-wise count rates for Quadrant A Data is divided into 100 sec bins |
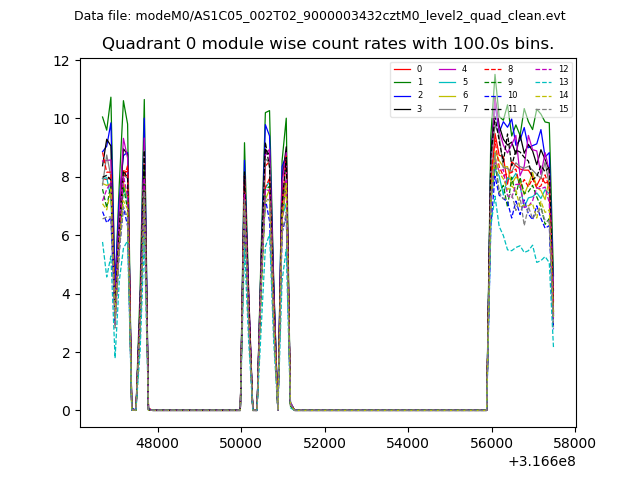 |
 |
| Module-wise count rates for Quadrant B Data is divided into 100 sec bins |
 |
 |
| Module-wise count rates for Quadrant C Data is divided into 100 sec bins |
 |
 |
| Module-wise count rates for Quadrant D Data is divided into 100 sec bins |
 |
 |
| Parameter | Plot |
|---|---|
| CZT HV Monitor |  |
| D_VDD | 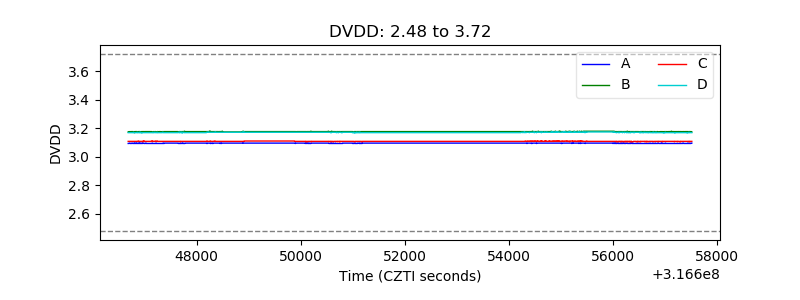 |
| Temperature 1 | 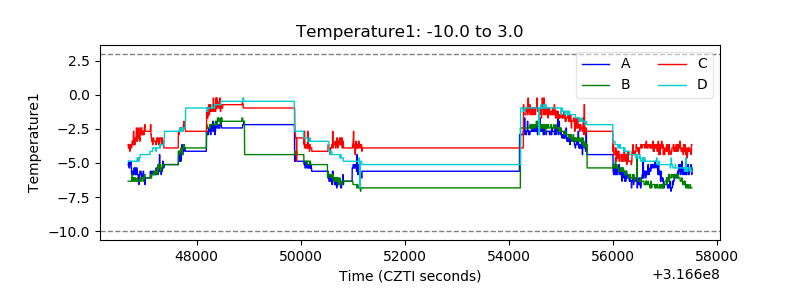 |
| Veto HV Monitor |  |
| Veto LLD |  |
| Alpha Counter | 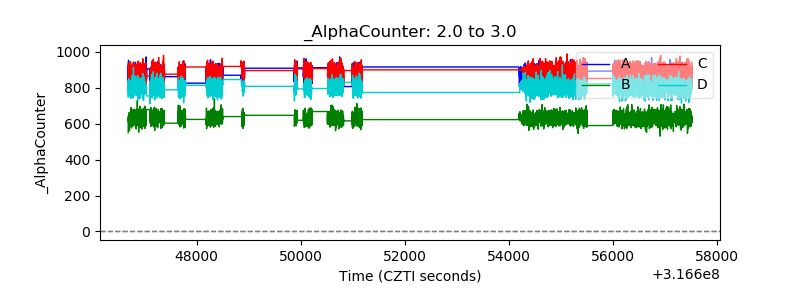 |
| _CPM_Rate |  |
| CZT Counter |  |
| +2.5 Volts monitor |  |
| +5 Volts monitor |  |
| _ROLL_ROT |  |
| _Roll_DEC |  |
| _Roll_RA |  |
| Veto Counter |  |