| Param | Original file | Final file |
|---|---|---|
| Filename | modeM0/AS1C05_002T02_9000003432_23220cztM0_level2.evt | modeM0/AS1C05_002T02_9000003432_23220cztM0_level2_quad_clean.evt |
| Size (bytes) | 160,295,040 | 26,760,960 |
| Size | 152.9 MB | 25.5 MB |
| Events in quadrant A | 860,452 | 176,251 |
| Events in quadrant B | 883,289 | 179,988 |
| Events in quadrant C | 922,121 | 171,809 |
| Events in quadrant D | 2,062,061 | 148,303 |
| Mode M9 | |||
|---|---|---|---|
| Quadrant | BADHDUFLAG | Total packets | Discarded packets |
| A | 0 | 4 | 0 |
| B | 0 | 5 | 1 |
| C | 0 | 5 | 1 |
| D | 0 | 6 | 2 |
| Mode SS | |||
|---|---|---|---|
| Quadrant | BADHDUFLAG | Total packets | Discarded packets |
| A | 0 | 58 | 16 |
| B | 0 | 57 | 17 |
| C | 0 | 60 | 18 |
| D | 0 | 56 | 12 |
| Mode M0 | |||
|---|---|---|---|
| Quadrant | BADHDUFLAG | Total packets | Discarded packets |
| A | 0 | 5142 | 1393 |
| B | 0 | 5204 | 1412 |
| C | 0 | 5422 | 1545 |
| D | 0 | 10803 | 3448 |
| Quadrant | Total seconds | Saturated seconds | Saturation percentage |
|---|---|---|---|
| A | 1826 | 12 | 0.657174% |
| B | 1832 | 20 | 1.091703% |
| C | 1809 | 36 | 1.990050% |
| D | 1781 | 505 | 28.354857% |
Noise dominated data is calculated using 1-second bins in cleaned event files. If a bin has >2000 counts, and if more than 50% of those come from <1% of pixels, then it is considered to be noise-dominated and hence unusable.
| Quadrant | # 1 sec bins | Bins with >0 counts | Bins with >2000 counts | High rate bins dominated by noise | Noise dominated (total time) | Noise dominated (detector-on time) | Marked lightcurve |
|---|---|---|---|---|---|---|---|
| A | 4507 | 1888 | 0 | 0 | 0.00% | 0.00% | 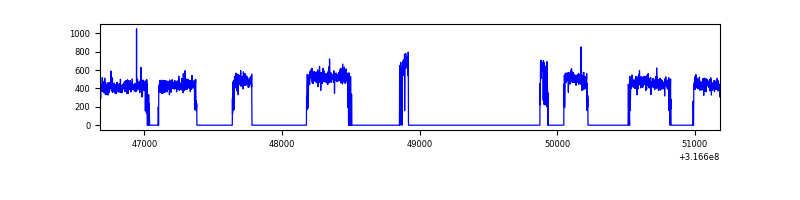 |
| B | 4507 | 1891 | 0 | 0 | 0.00% | 0.00% | 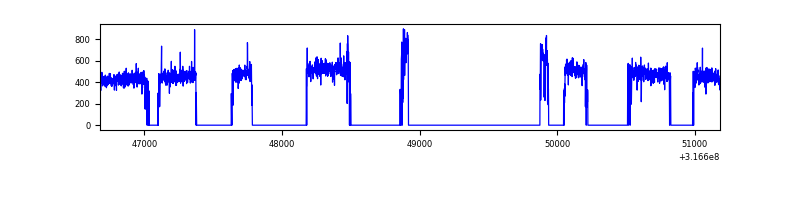 |
| C | 4507 | 1870 | 0 | 0 | 0.00% | 0.00% | 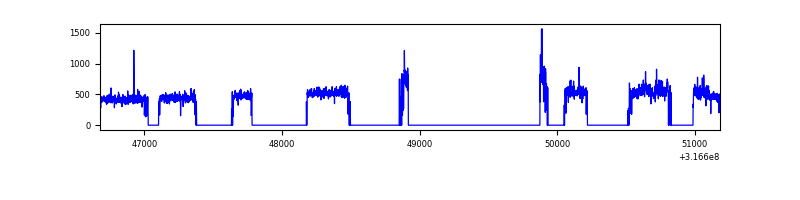 |
| D | 4506 | 1825 | 401 | 401 | 8.90% | 21.97% | 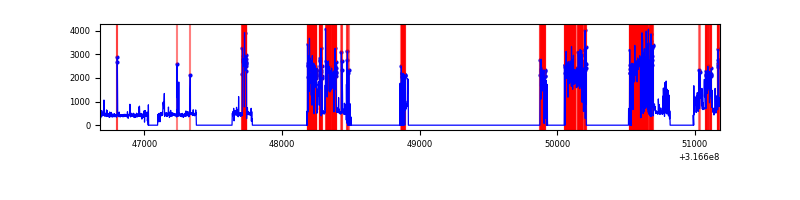 |
Top three noisy pixels from each quadrant. If the there are fewer than three noisy pixels in the level2.evt file, extra rows are filled as -1
| Pixel properties | Quadrant properties | ||||||
|---|---|---|---|---|---|---|---|
| Quadrant | DetID | PixID | Counts | Sigma | Mean | Median | Sigma |
| A | 13 | 254 | 2596 | 50.95 | 223 | 217 | 46.7 |
| A | 3 | 137 | 1962 | 37.37 | 223 | 217 | 46.7 |
| A | 0 | 226 | 1899 | 36.02 | 223 | 217 | 46.7 |
| B | 12 | 111 | 5202 | 112.85 | 223 | 218 | 44.2 |
| B | 3 | 64 | 4975 | 107.71 | 223 | 218 | 44.2 |
| B | 11 | 111 | 4645 | 100.24 | 223 | 218 | 44.2 |
| C | 2 | 16 | 33845 | 657.15 | 212 | 212 | 51.2 |
| C | 14 | 238 | 33307 | 646.64 | 212 | 212 | 51.2 |
| C | 0 | 10 | 23895 | 462.74 | 212 | 212 | 51.2 |
| D | 1 | 52 | 830858 | 17792.74 | 186 | 181 | 46.7 |
| D | 7 | 238 | 297896 | 6376.92 | 186 | 181 | 46.7 |
| D | 13 | 153 | 165043 | 3531.27 | 186 | 181 | 46.7 |
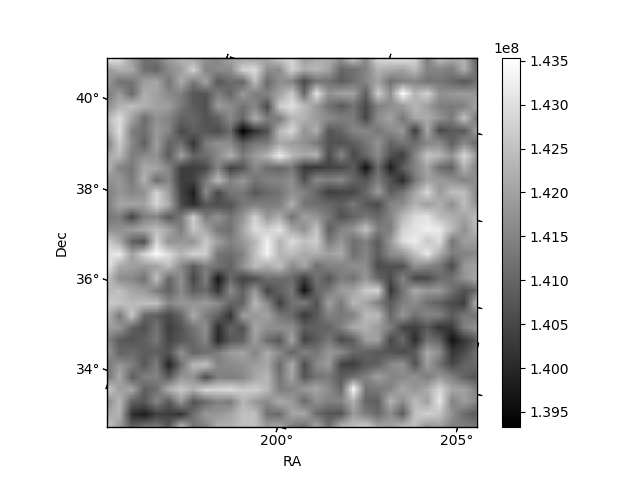
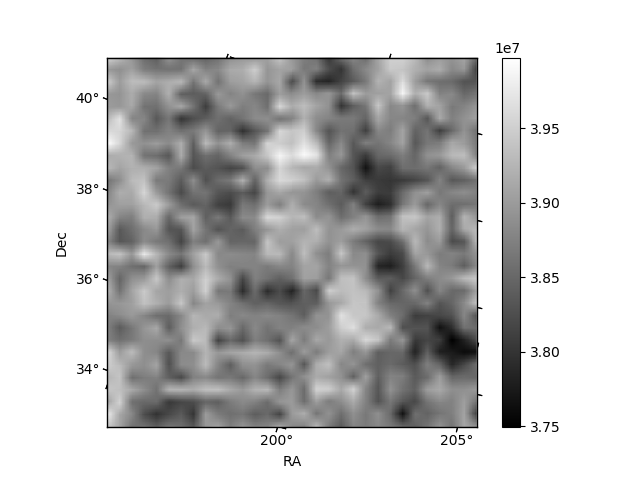
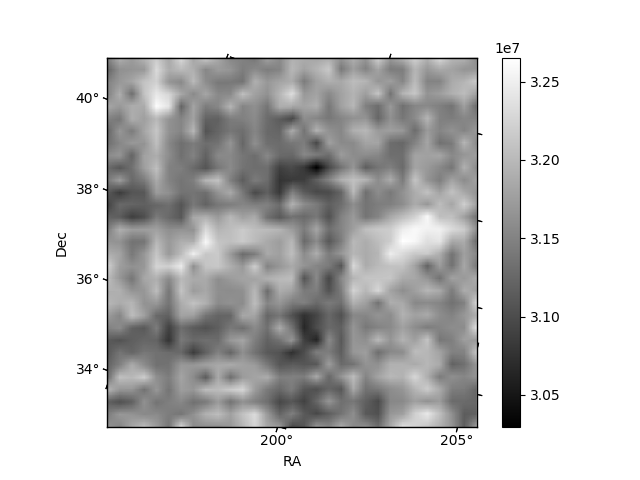
Histogram calculated using DETX and DETY for each event in the final _common_clean file
| Quadrant A | 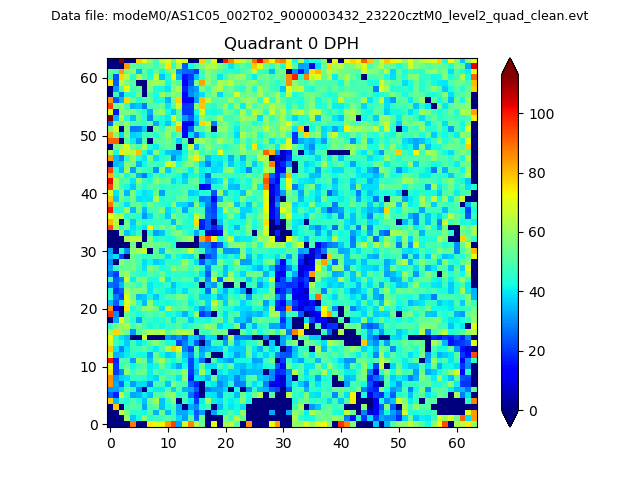 |
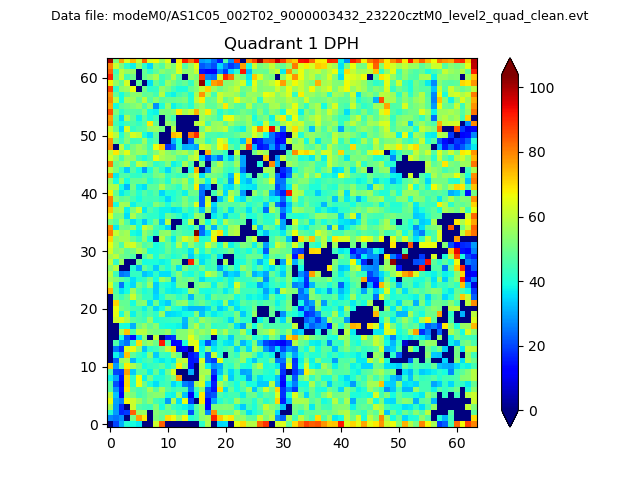 |
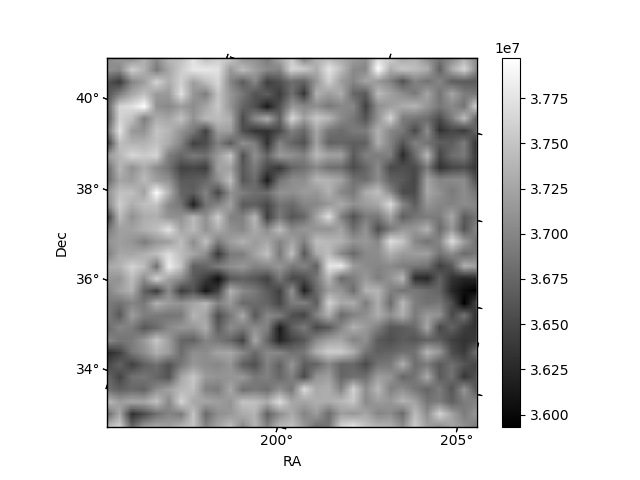
Quadrant B |
|---|---|---|---|
| Quadrant D |  |
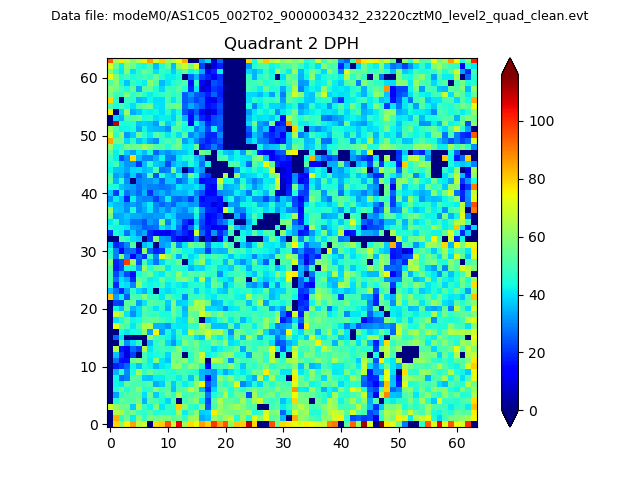 |
Quadrant C |
| Plot type | Count rate plots | Images |
|---|---|---|
| Comparison with Poisson distribution Blue bars denote a histogram of data divided into 1 sec bins. Red curve is a Poisson curve with rate = median count rate of data. |
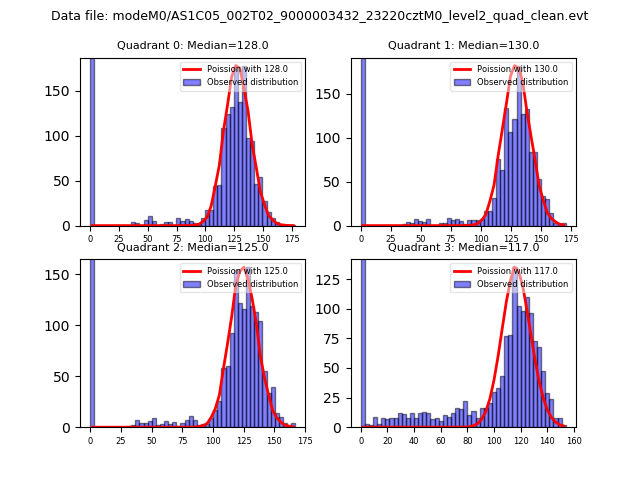 |
 |
| Quadrant-wise count rates Data is divided into 100 sec bins |
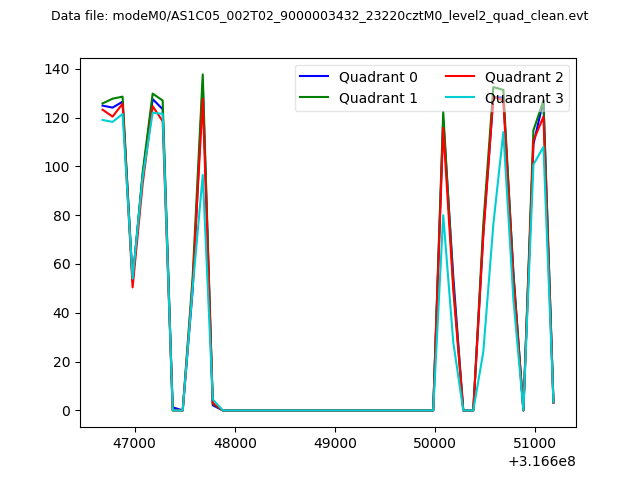 |
|
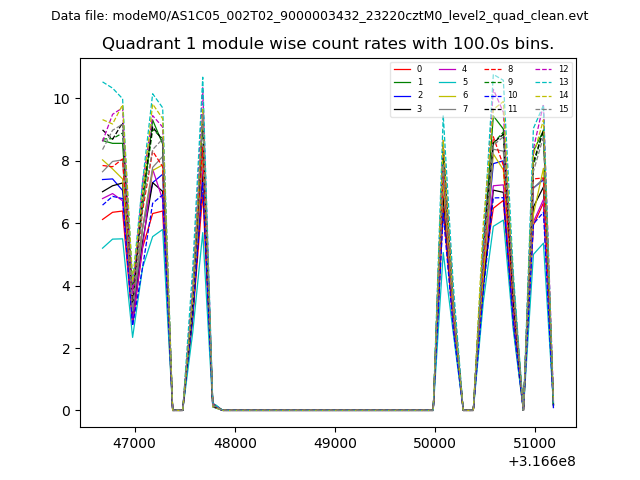
| Module-wise count rates for Quadrant A Data is divided into 100 sec bins |
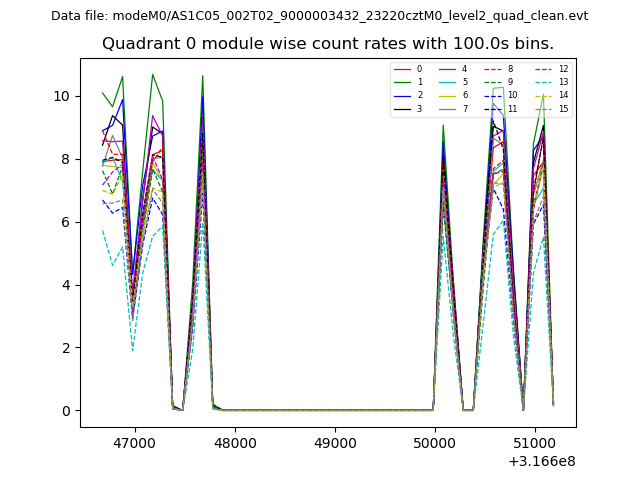 |
 |
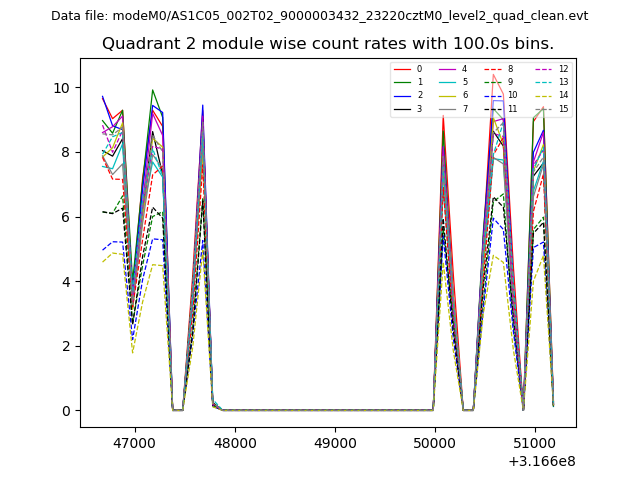
| Module-wise count rates for Quadrant B Data is divided into 100 sec bins |
 |
 |
| Module-wise count rates for Quadrant C Data is divided into 100 sec bins |
 |
 |
| Module-wise count rates for Quadrant D Data is divided into 100 sec bins |
 |
 |
| Parameter | Plot |
|---|---|
| CZT HV Monitor | 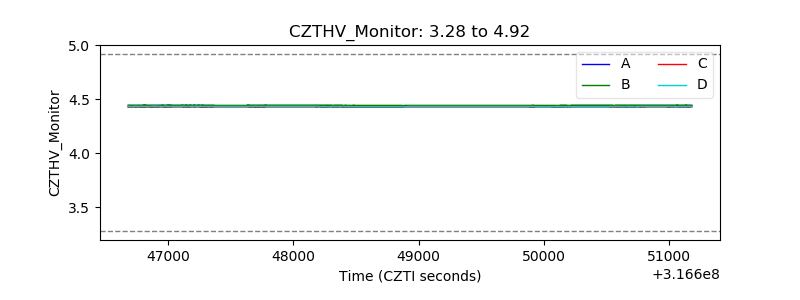 |
| D_VDD | 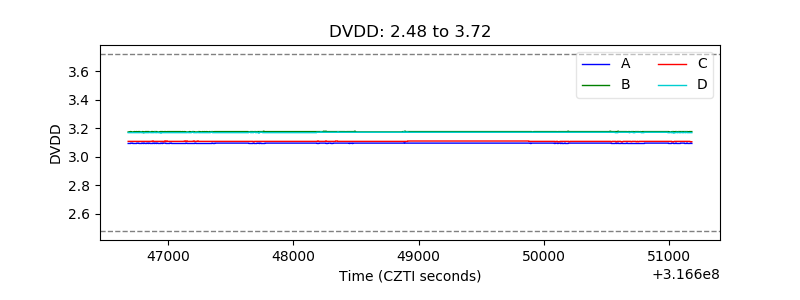 |
| Temperature 1 | 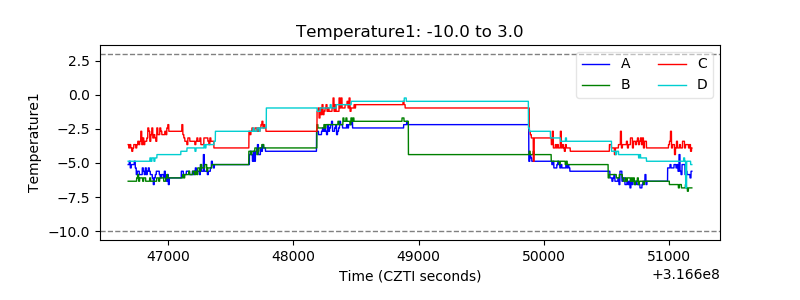 |
| Veto HV Monitor | 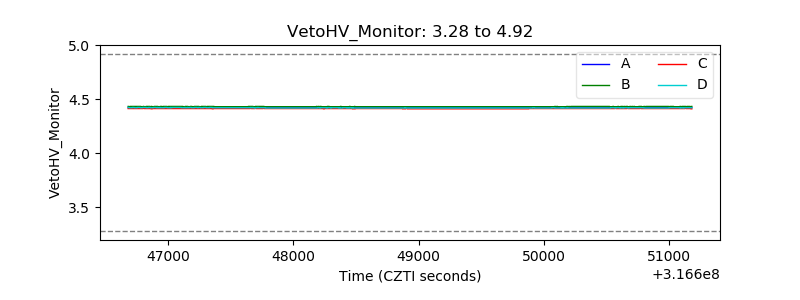 |
| Veto LLD | 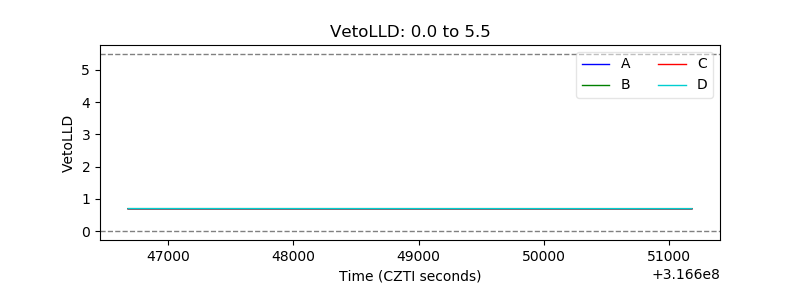 |
| Alpha Counter | 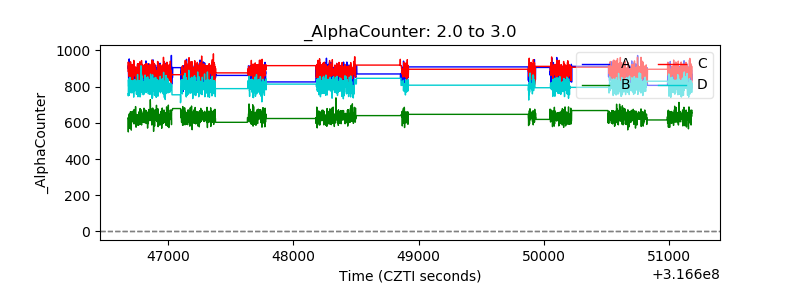 |
| _CPM_Rate | 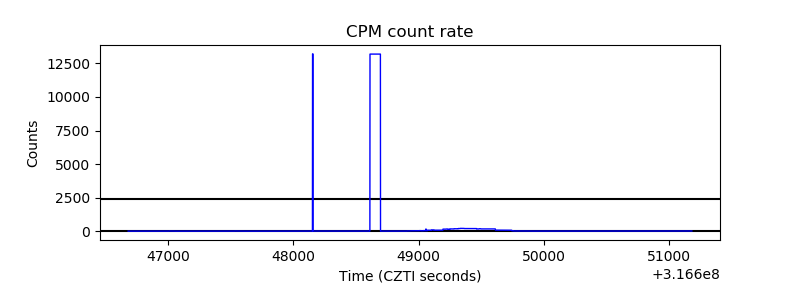 |
| CZT Counter | 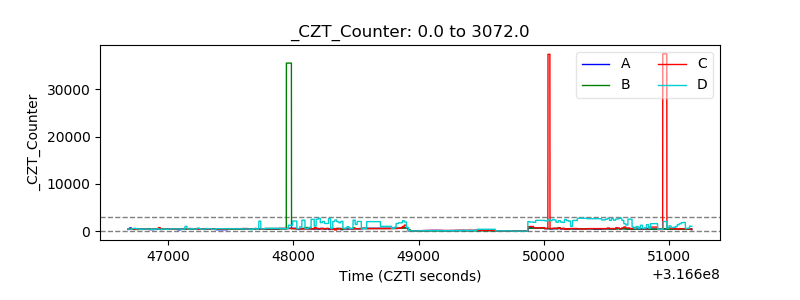 |
| +2.5 Volts monitor | 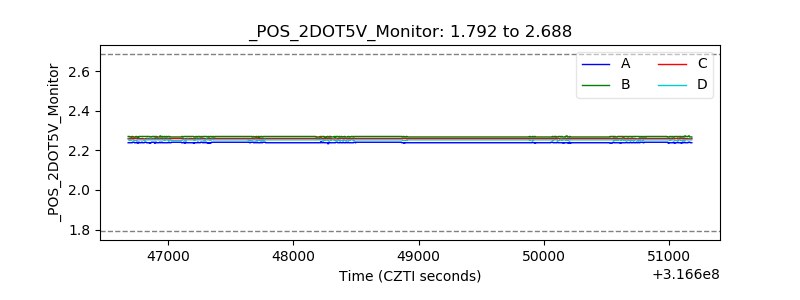 |
| +5 Volts monitor | 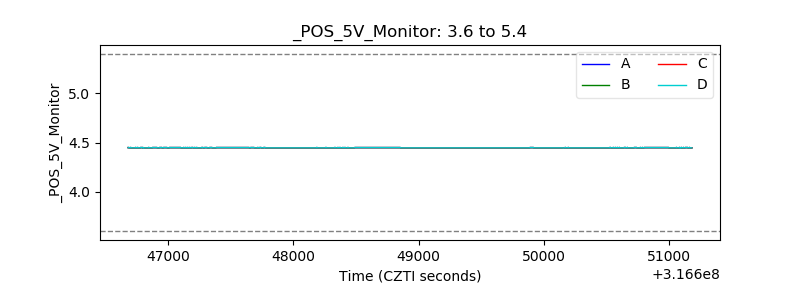 |
| _ROLL_ROT | 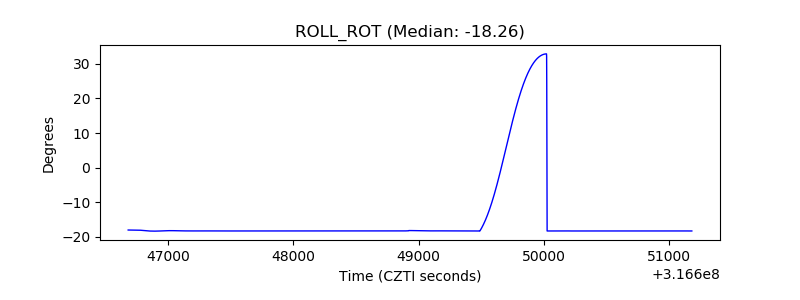 |
| _Roll_DEC | 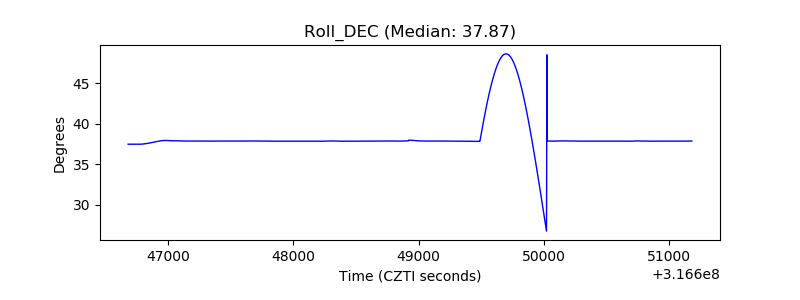 |
| _Roll_RA | 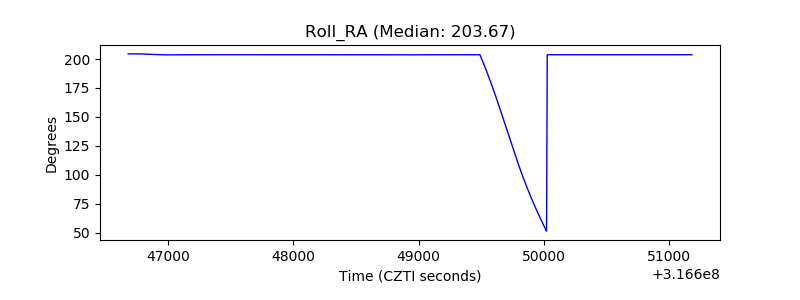 |
| Veto Counter | 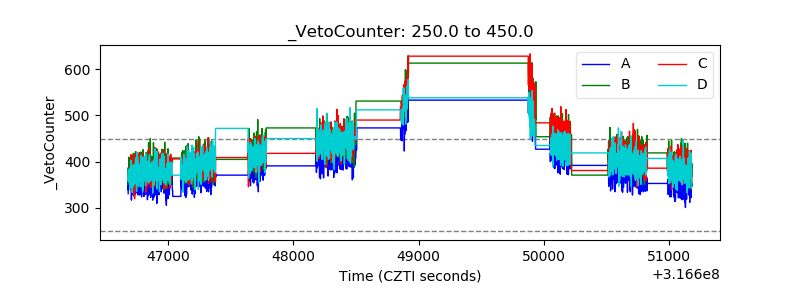 |