| Param | Original file | Final file |
|---|---|---|
| Filename | modeM0/AS1C05_002T02_9000003432_23221cztM0_level2.evt | modeM0/AS1C05_002T02_9000003432_23221cztM0_level2_quad_clean.evt |
| Size (bytes) | 252,011,520 | 31,682,880 |
| Size | 240.3 MB | 30.2 MB |
| Events in quadrant A | 1,401,342 | 197,372 |
| Events in quadrant B | 1,466,188 | 201,289 |
| Events in quadrant C | 2,289,544 | 182,145 |
| Events in quadrant D | 2,286,562 | 181,200 |
| Mode M9 | |||
|---|---|---|---|
| Quadrant | BADHDUFLAG | Total packets | Discarded packets |
| A | 0 | 5 | 0 |
| B | 0 | 5 | 0 |
| C | 0 | 5 | 0 |
| D | 0 | 5 | 0 |
| Mode SS | |||
|---|---|---|---|
| Quadrant | BADHDUFLAG | Total packets | Discarded packets |
| A | 0 | 60 | 2 |
| B | 0 | 60 | 2 |
| C | 0 | 60 | 4 |
| D | 0 | 60 | 4 |
| Mode M0 | |||
|---|---|---|---|
| Quadrant | BADHDUFLAG | Total packets | Discarded packets |
| A | 0 | 6144 | 286 |
| B | 0 | 6299 | 293 |
| C | 0 | 9470 | 776 |
| D | 0 | 9159 | 396 |
| Quadrant | Total seconds | Saturated seconds | Saturation percentage |
|---|---|---|---|
| A | 2763 | 21 | 0.760043% |
| B | 2762 | 55 | 1.991311% |
| C | 2729 | 271 | 9.930377% |
| D | 2751 | 242 | 8.796801% |
Noise dominated data is calculated using 1-second bins in cleaned event files. If a bin has >2000 counts, and if more than 50% of those come from <1% of pixels, then it is considered to be noise-dominated and hence unusable.
| Quadrant | # 1 sec bins | Bins with >0 counts | Bins with >2000 counts | High rate bins dominated by noise | Noise dominated (total time) | Noise dominated (detector-on time) | Marked lightcurve |
|---|---|---|---|---|---|---|---|
| A | 3328 | 2787 | 0 | 0 | 0.00% | 0.00% |  |
| B | 3328 | 2782 | 6 | 6 | 0.18% | 0.22% |  |
| C | 3292 | 2751 | 84 | 84 | 2.55% | 3.05% |  |
| D | 3309 | 2780 | 194 | 194 | 5.86% | 6.98% |  |
Top three noisy pixels from each quadrant. If the there are fewer than three noisy pixels in the level2.evt file, extra rows are filled as -1
| Pixel properties | Quadrant properties | ||||||
|---|---|---|---|---|---|---|---|
| Quadrant | DetID | PixID | Counts | Sigma | Mean | Median | Sigma |
| A | 13 | 254 | 4265 | 52.2 | 362 | 354 | 74.9 |
| A | 3 | 137 | 3427 | 41.02 | 362 | 354 | 74.9 |
| A | 0 | 226 | 3123 | 36.96 | 362 | 354 | 74.9 |
| B | 10 | 247 | 14190 | 191.17 | 364 | 354 | 72.4 |
| B | 0 | 190 | 13938 | 187.69 | 364 | 354 | 72.4 |
| B | 3 | 64 | 11122 | 148.78 | 364 | 354 | 72.4 |
| C | 2 | 16 | 789074 | 9754.94 | 336 | 338 | 80.9 |
| C | 0 | 10 | 128445 | 1584.4 | 336 | 338 | 80.9 |
| C | 14 | 238 | 53590 | 658.61 | 336 | 338 | 80.9 |
| D | 2 | 82 | 381671 | 4522.2 | 341 | 330 | 84.3 |
| D | 1 | 52 | 313749 | 3716.73 | 341 | 330 | 84.3 |
| D | 13 | 172 | 151925 | 1797.71 | 341 | 330 | 84.3 |
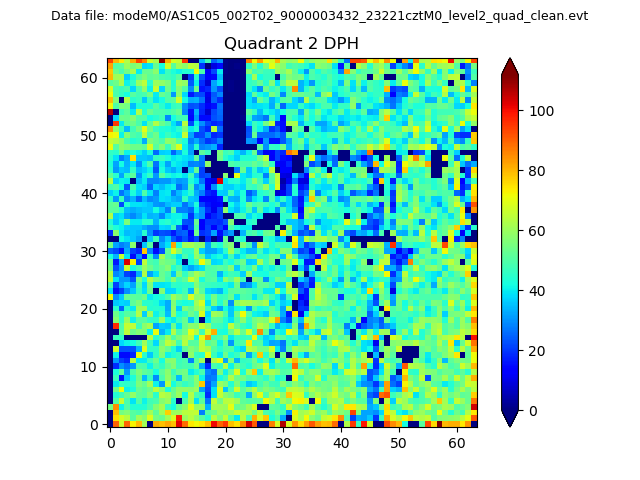
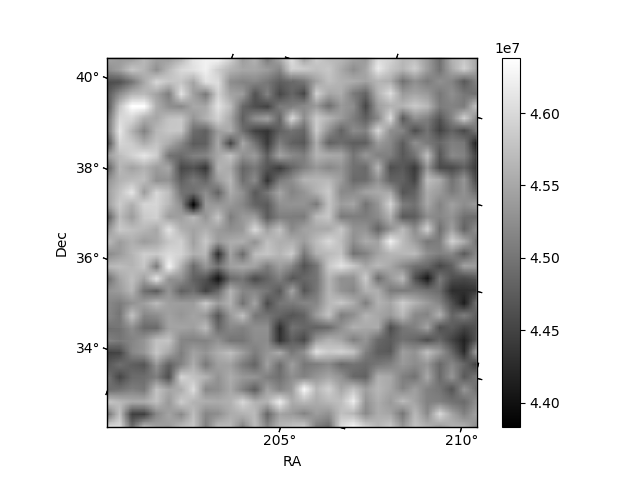
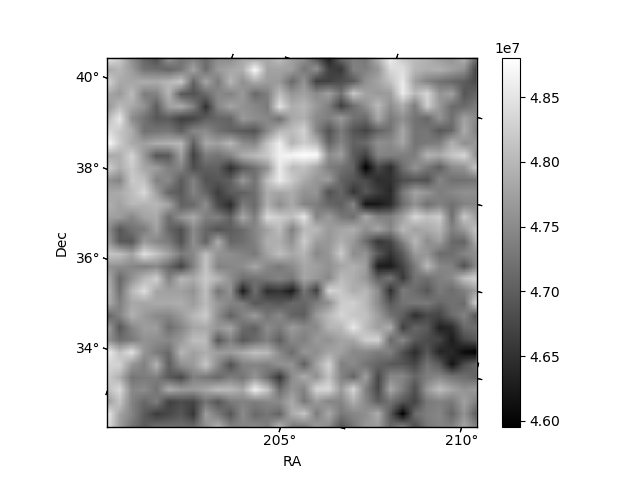
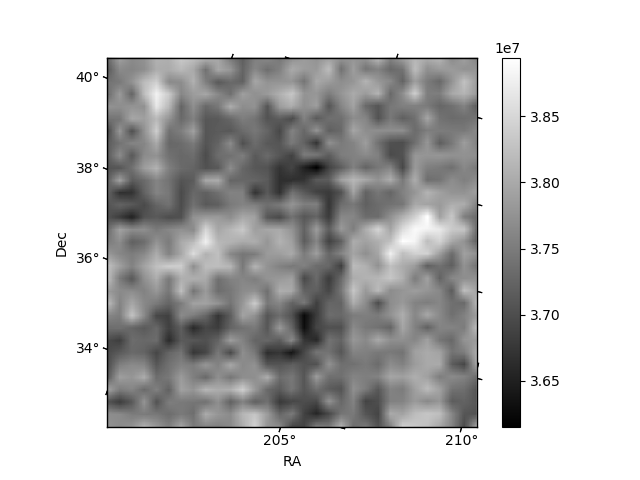
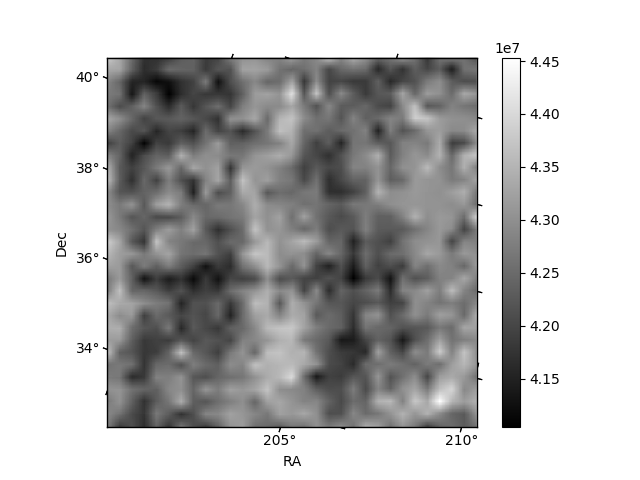
Histogram calculated using DETX and DETY for each event in the final _common_clean file
| Quadrant A | 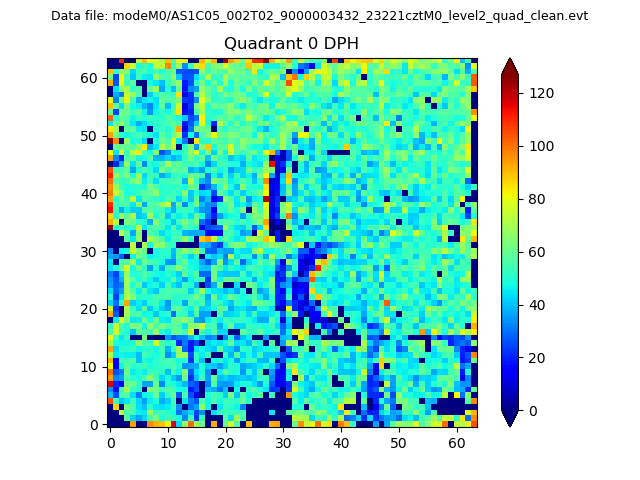 |
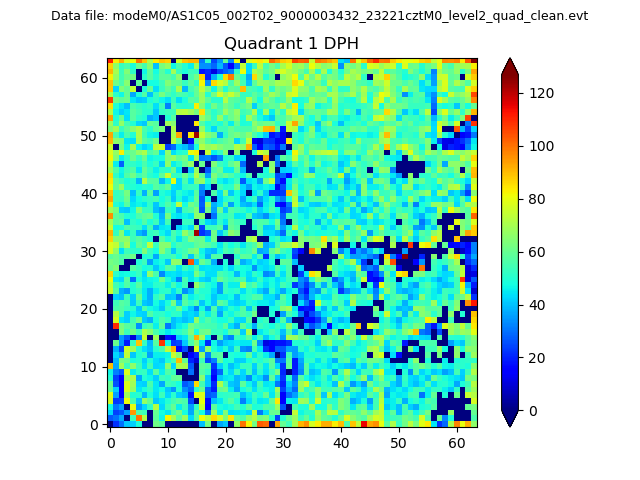 |
Quadrant B |
|---|---|---|---|
| Quadrant D | 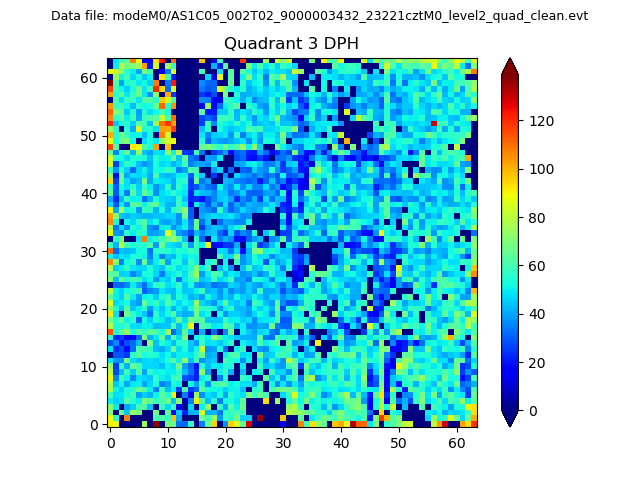 |
 |
Quadrant C |
| Plot type | Count rate plots | Images |
|---|---|---|
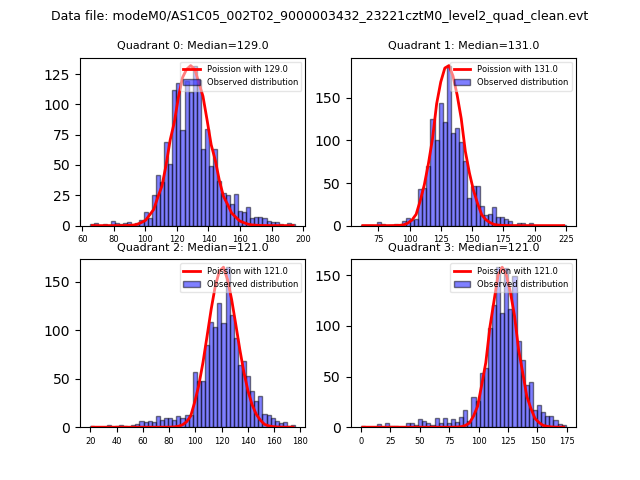
| Comparison with Poisson distribution Blue bars denote a histogram of data divided into 1 sec bins. Red curve is a Poisson curve with rate = median count rate of data. |
 |
 |
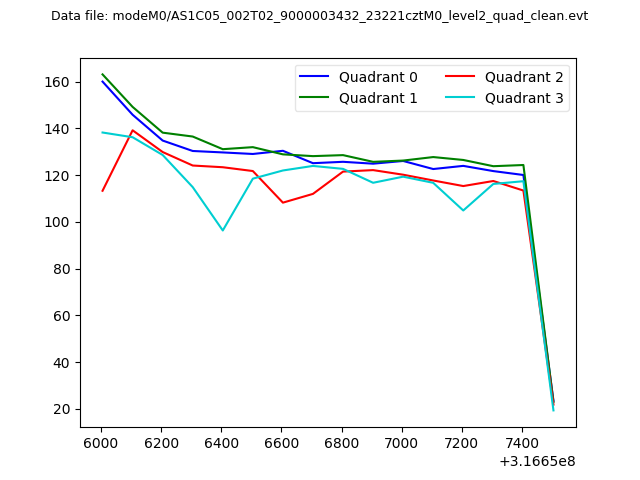
| Quadrant-wise count rates Data is divided into 100 sec bins |
 |
|
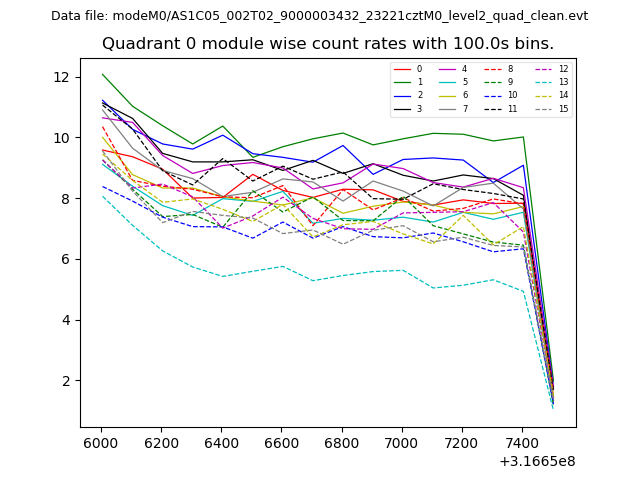
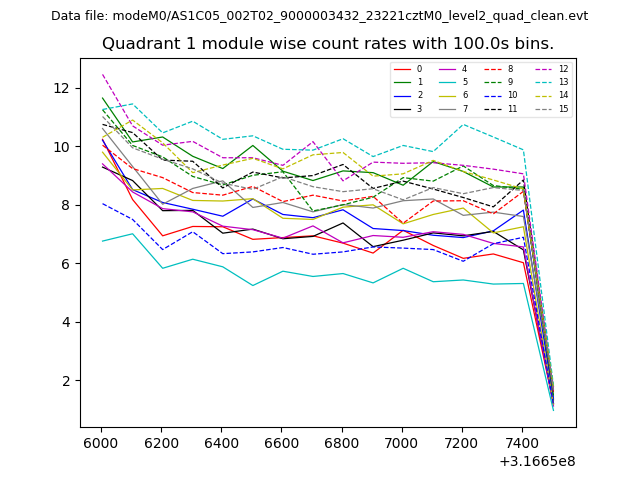
| Module-wise count rates for Quadrant A Data is divided into 100 sec bins |
 |
 |
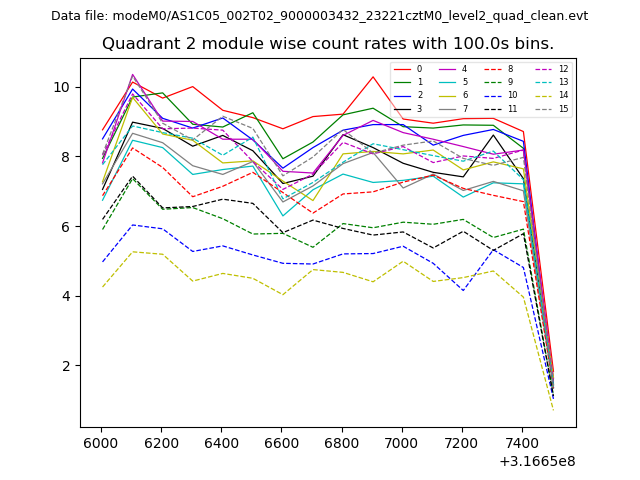
| Module-wise count rates for Quadrant B Data is divided into 100 sec bins |
 |
 |
| Module-wise count rates for Quadrant C Data is divided into 100 sec bins |
 |
 |
| Module-wise count rates for Quadrant D Data is divided into 100 sec bins |
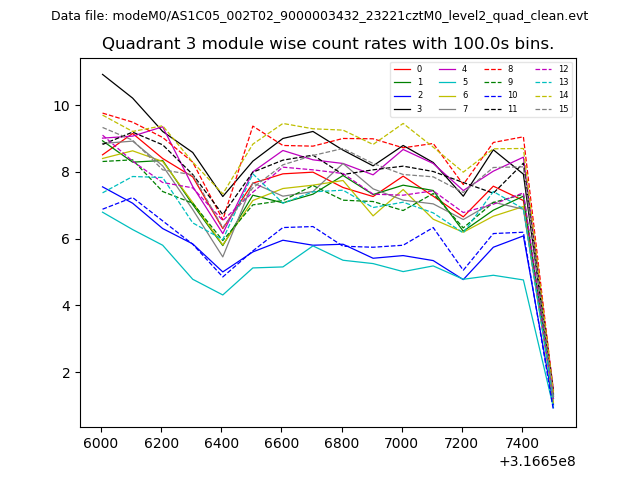 |
 |
| Parameter | Plot |
|---|---|
| CZT HV Monitor | 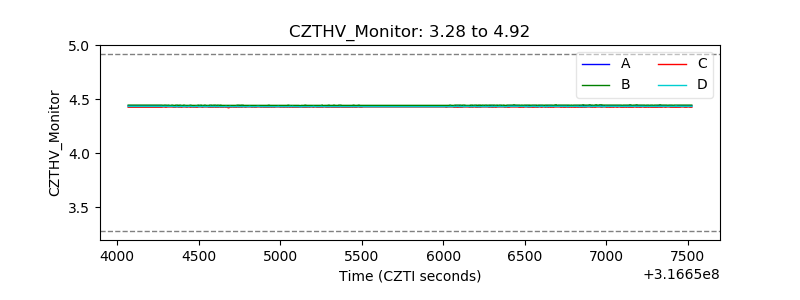 |
| D_VDD | 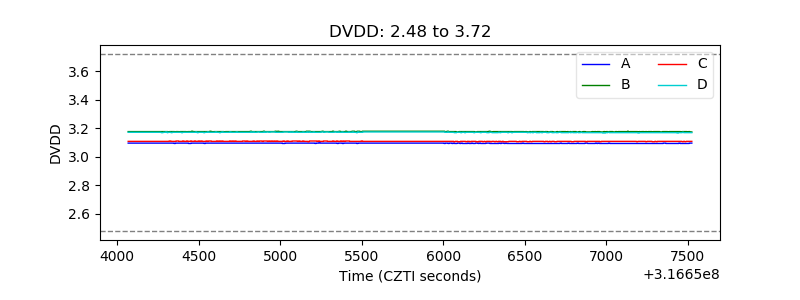 |
| Temperature 1 | 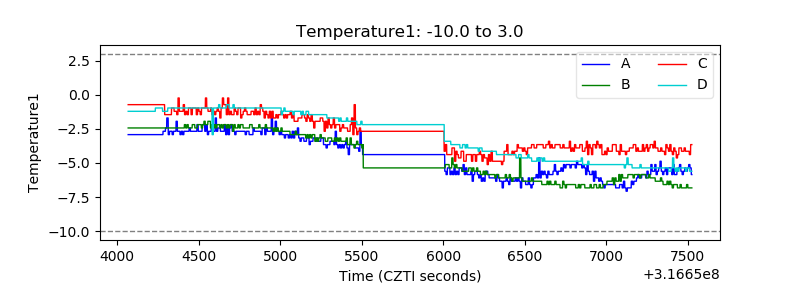 |
| Veto HV Monitor | 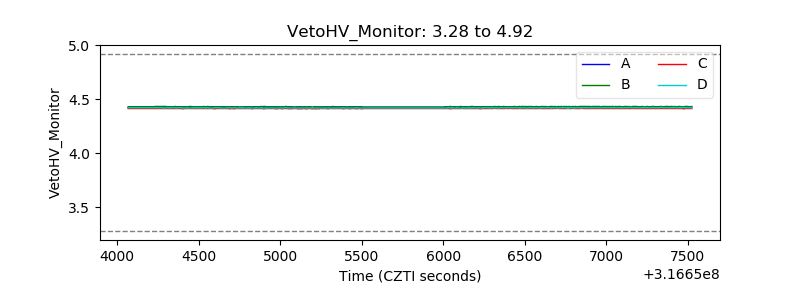 |
| Veto LLD | 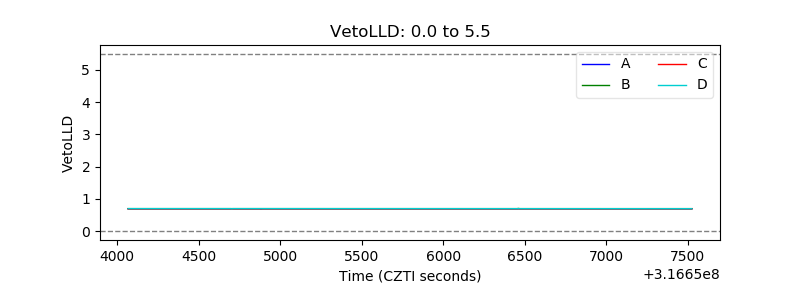 |
| Alpha Counter | 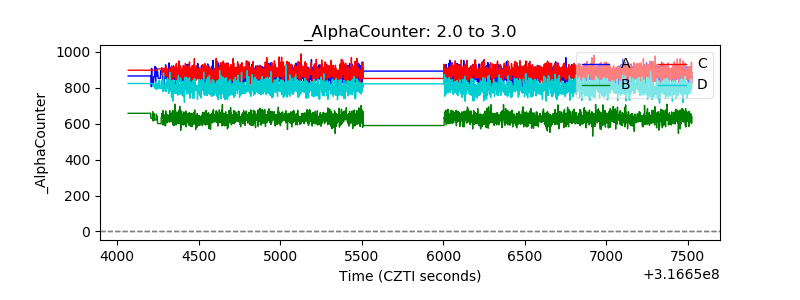 |
| _CPM_Rate | 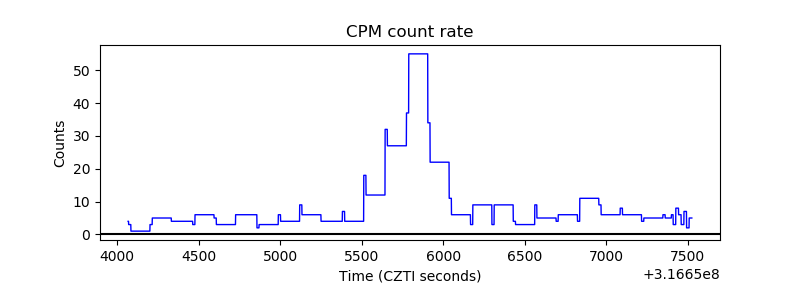 |
| CZT Counter | 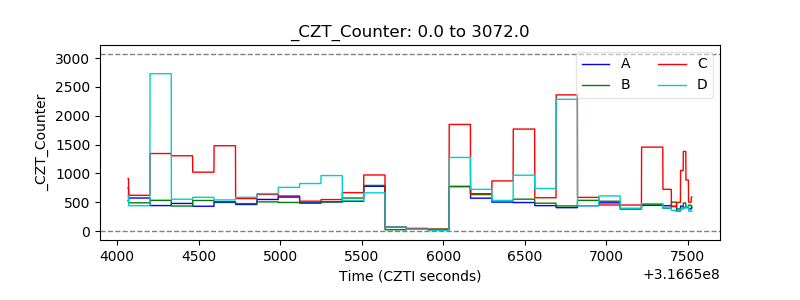 |
| +2.5 Volts monitor |  |
| +5 Volts monitor |  |
| _ROLL_ROT | 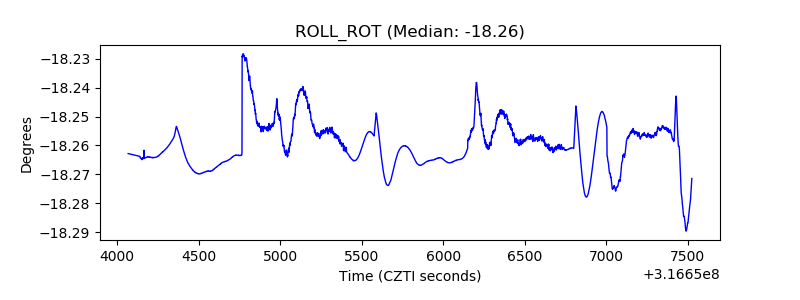 |
| _Roll_DEC | 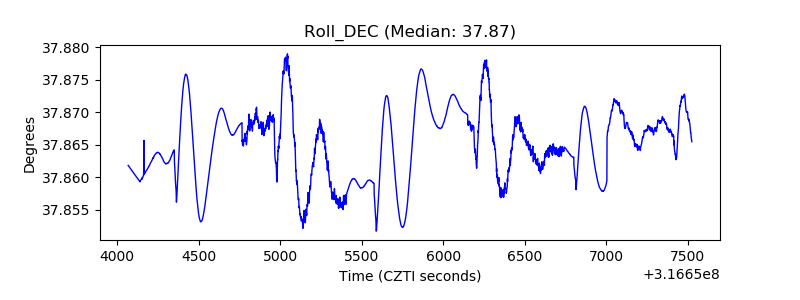 |
| _Roll_RA | 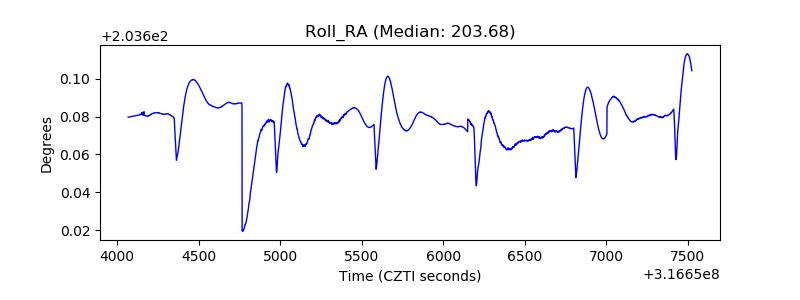 |
| Veto Counter | 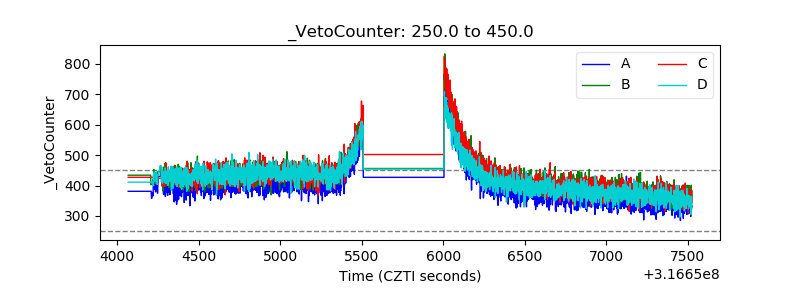 |