| Param | Original file | Final file |
|---|---|---|
| Filename | modeM0/AS1A08_009T01_9000003434cztM0_level2.fits | modeM0/AS1A08_009T01_9000003434cztM0_level2_quad_clean.evt |
| Size (bytes) | 717,765,120 | 726,168,960 |
| Size | 684.5 MB | 692.5 MB |
| Events in quadrant A | 4,447,868 | 4,435,877 |
| Events in quadrant B | 4,250,982 | 4,462,556 |
| Events in quadrant C | 4,330,544 | 4,262,191 |
| Events in quadrant D | 3,728,430 | 3,853,772 |
| Mode M0 | |||
|---|---|---|---|
| Quadrant | BADHDUFLAG | Total packets | Discarded packets |
| A | 0 | 152817 | 0 |
| B | 0 | 152606 | 0 |
| C | 0 | 166716 | 0 |
| D | 0 | 196748 | 0 |
| Mode M9 | |||
|---|---|---|---|
| Quadrant | BADHDUFLAG | Total packets | Discarded packets |
| A | 0 | 119 | 0 |
| B | 0 | 120 | 0 |
| C | 0 | 120 | 0 |
| D | 0 | 120 | 0 |
| Mode SS | |||
|---|---|---|---|
| Quadrant | BADHDUFLAG | Total packets | Discarded packets |
| A | 0 | 1486 | 0 |
| B | 0 | 1482 | 0 |
| C | 0 | 1487 | 0 |
| D | 0 | 1486 | 0 |
| Quadrant | Total seconds | Saturated seconds | Saturation percentage |
|---|---|---|---|
| A | 72598 | 730 | 1.005537% |
| B | 72594 | 876 | 1.206711% |
| C | 72581 | 2473 | 3.407228% |
| D | 72590 | 3553 | 4.894614% |
Noise dominated data is calculated using 1-second bins in cleaned event files. If a bin has >2000 counts, and if more than 50% of those come from <1% of pixels, then it is considered to be noise-dominated and hence unusable.
| Quadrant | # 1 sec bins | Bins with >0 counts | Bins with >2000 counts | High rate bins dominated by noise | Noise dominated (total time) | Noise dominated (detector-on time) | Marked lightcurve |
|---|---|---|---|---|---|---|---|
| A | 90853 | 72645 | 0 | 0 | 0.00% | 0.00% | 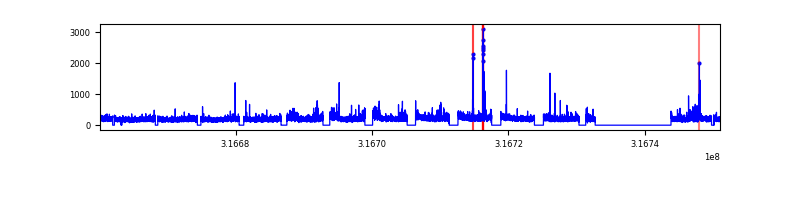 |
| B | 90853 | 72649 | 0 | 0 | 0.00% | 0.00% | 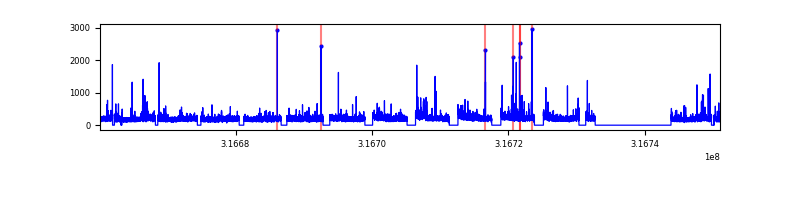 |
| C | 90853 | 72630 | 0 | 0 | 0.00% | 0.00% | 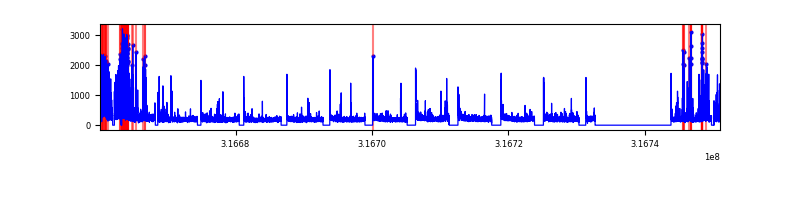 |
| D | 90853 | 72419 | 0 | 0 | 0.00% | 0.00% | 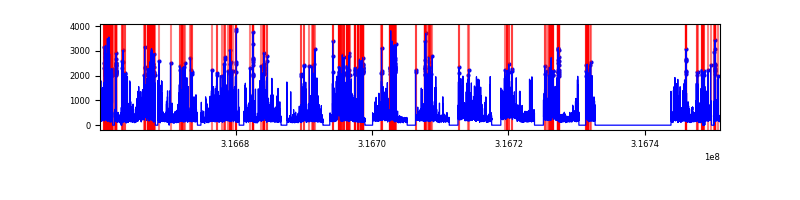 |
Top three noisy pixels from each quadrant. If the there are fewer than three noisy pixels in the level2.evt file, extra rows are filled as -1
| Pixel properties | Quadrant properties | ||||||
|---|---|---|---|---|---|---|---|
| Quadrant | DetID | PixID | Counts | Sigma | Mean | Median | Sigma |
| A | 0 | 29 | 4117 | 10.67 | 1156 | 1087 | 284.1 |
| A | 7 | 110 | 3630 | 8.95 | 1156 | 1087 | 284.1 |
| A | 0 | 30 | 3293 | 7.77 | 1156 | 1087 | 284.1 |
| B | 2 | 9 | 3396 | 10.5 | 1126 | 1078 | 220.8 |
| B | 3 | 17 | 2791 | 7.76 | 1126 | 1078 | 220.8 |
| B | 5 | 128 | 2784 | 7.73 | 1126 | 1078 | 220.8 |
| C | 1 | 80 | 3325 | 7.76 | 1144 | 1074 | 290.0 |
| C | 1 | 81 | 3318 | 7.74 | 1144 | 1074 | 290.0 |
| C | 12 | 241 | 2918 | 6.36 | 1144 | 1074 | 290.0 |
| D | 6 | 231 | 2672 | 5.97 | 1068 | 974 | 284.5 |
| D | 10 | 189 | 2636 | 5.84 | 1068 | 974 | 284.5 |
| D | 15 | 46 | 2630 | 5.82 | 1068 | 974 | 284.5 |
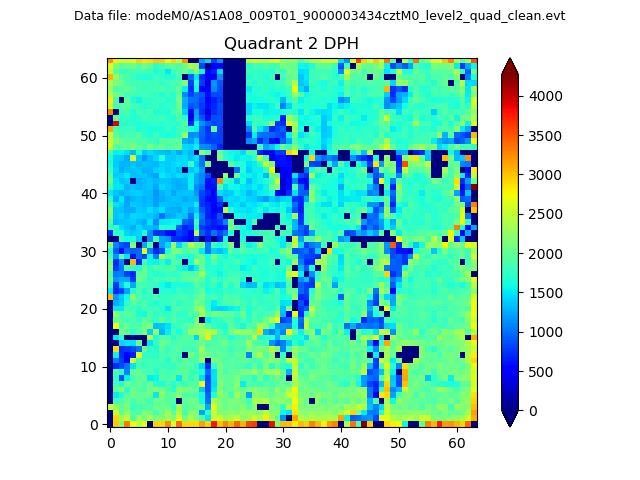
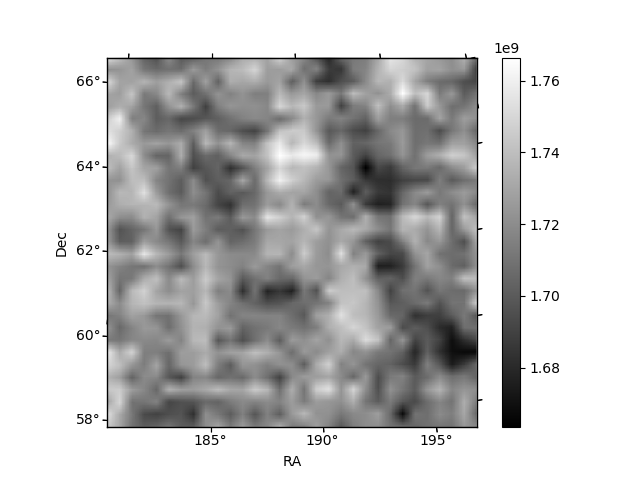
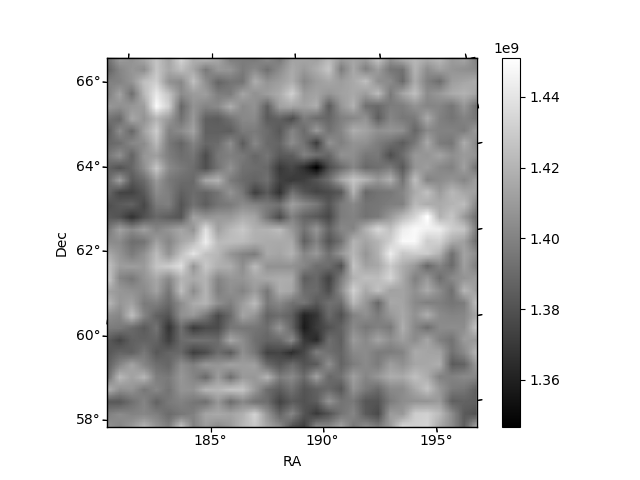
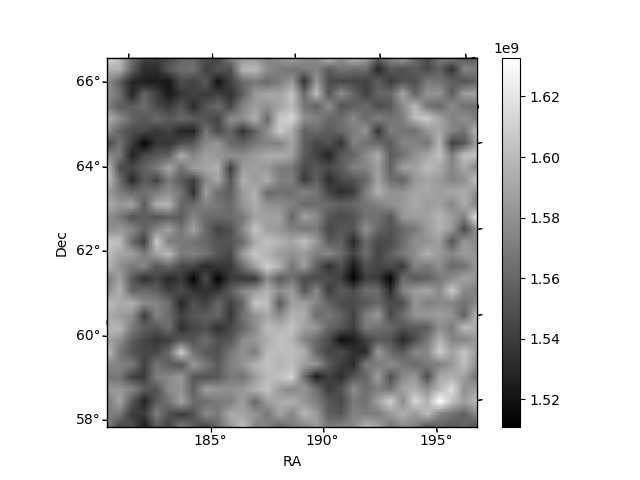
Histogram calculated using DETX and DETY for each event in the final _common_clean file
| Quadrant A | 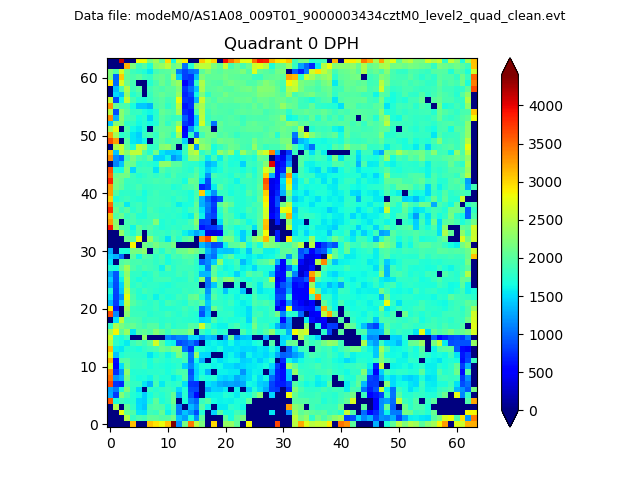 |
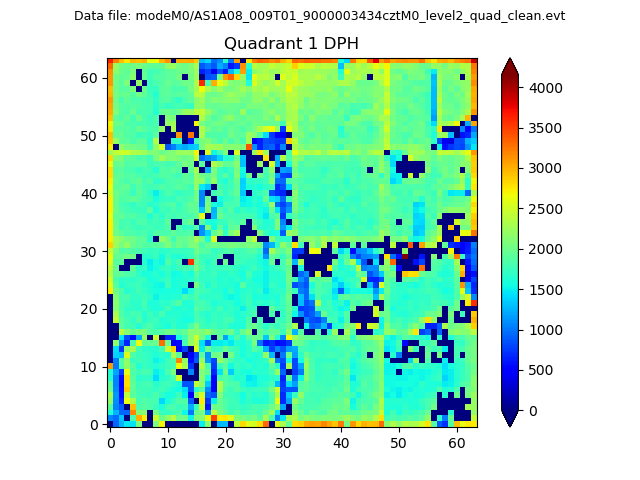 |
Quadrant B |
|---|---|---|---|
| Quadrant D | 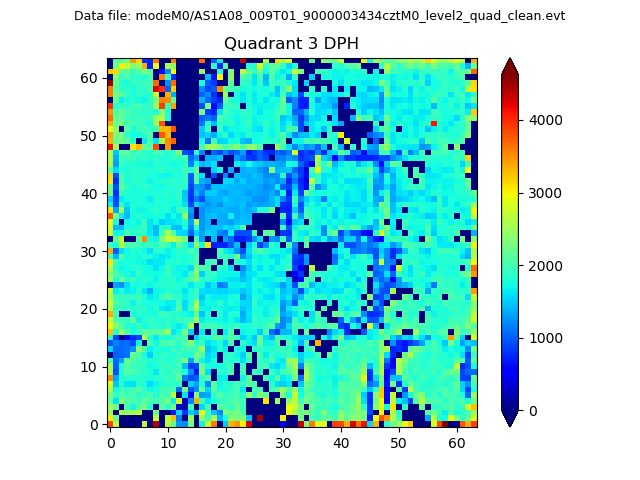 |
 |
Quadrant C |
| Plot type | Count rate plots | Images |
|---|---|---|
| Comparison with Poisson distribution Blue bars denote a histogram of data divided into 1 sec bins. Red curve is a Poisson curve with rate = median count rate of data. |
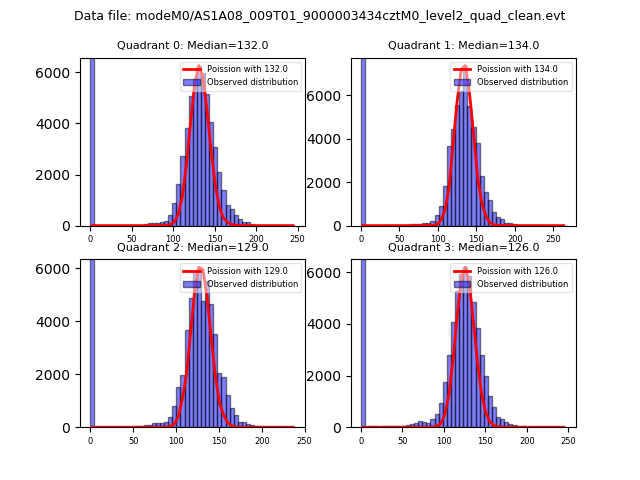 |
 |
| Quadrant-wise count rates Data is divided into 100 sec bins |
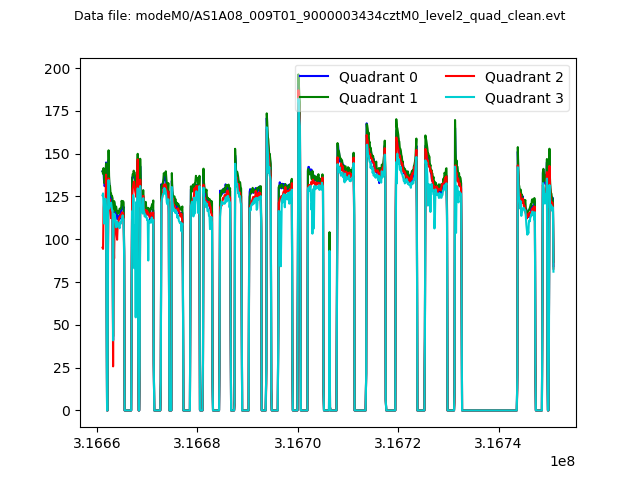 |
|
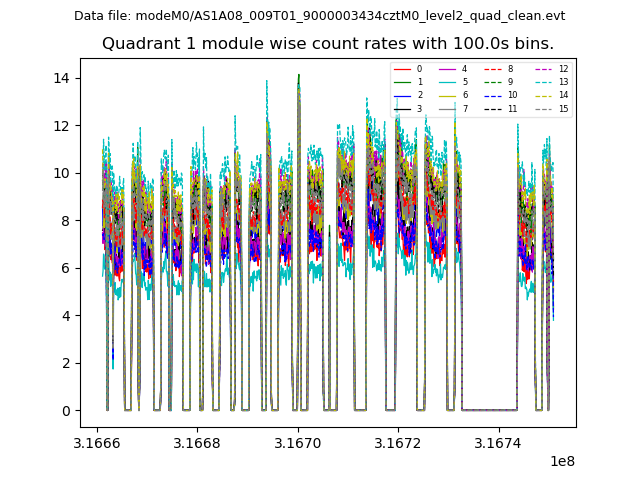
| Module-wise count rates for Quadrant A Data is divided into 100 sec bins |
 |
 |
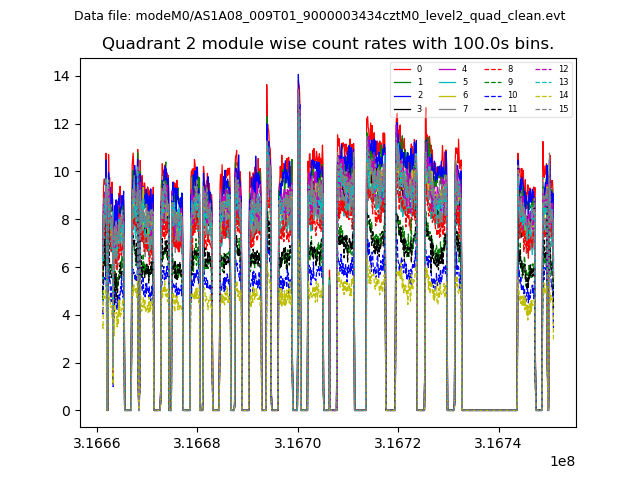
| Module-wise count rates for Quadrant B Data is divided into 100 sec bins |
 |
 |
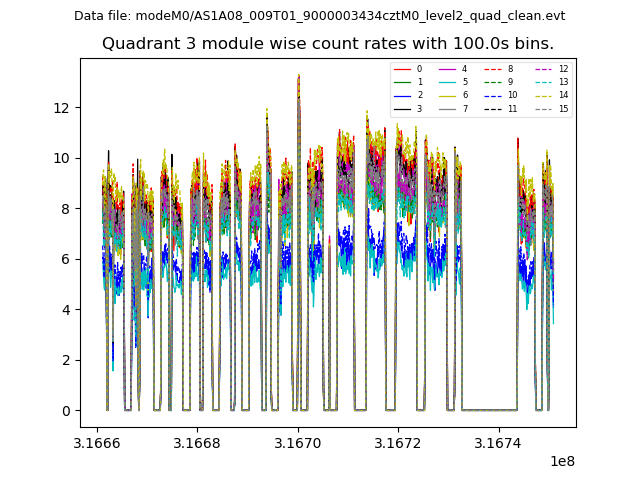
| Module-wise count rates for Quadrant C Data is divided into 100 sec bins |
 |
 |
| Module-wise count rates for Quadrant D Data is divided into 100 sec bins |
 |
 |
| Parameter | Plot |
|---|---|
| CZT HV Monitor |  |
| D_VDD | 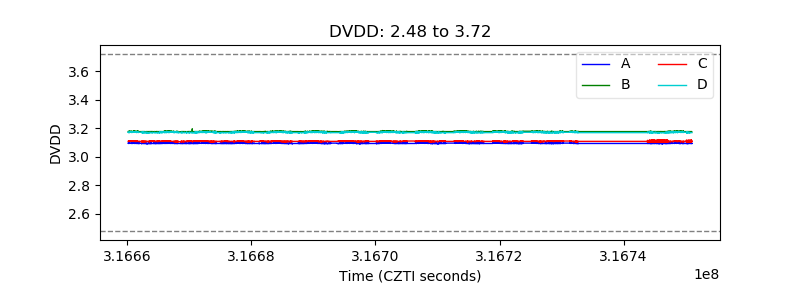 |
| Temperature 1 | 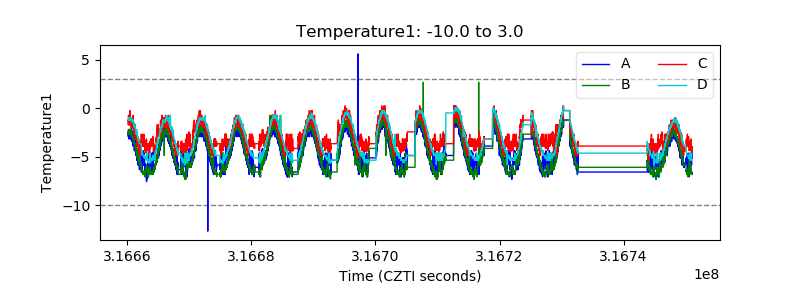 |
| Veto HV Monitor | 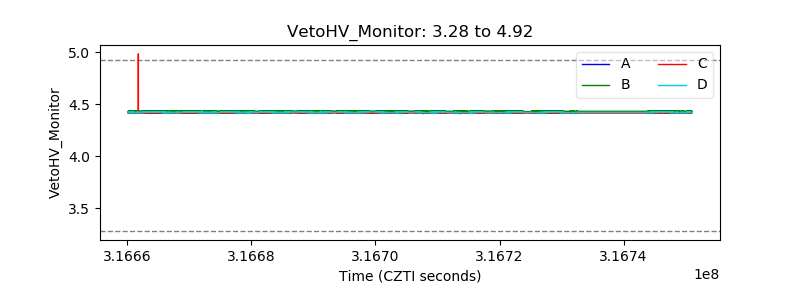 |
| Veto LLD | 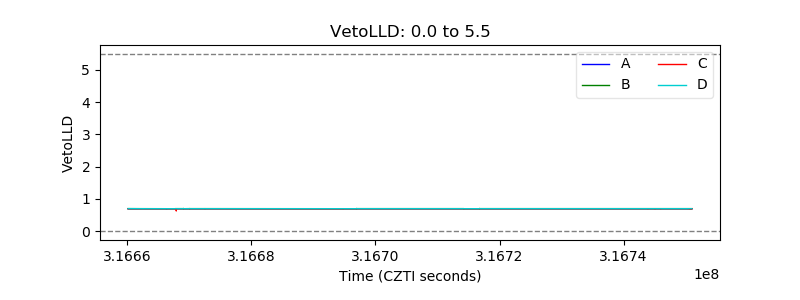 |
| Alpha Counter | 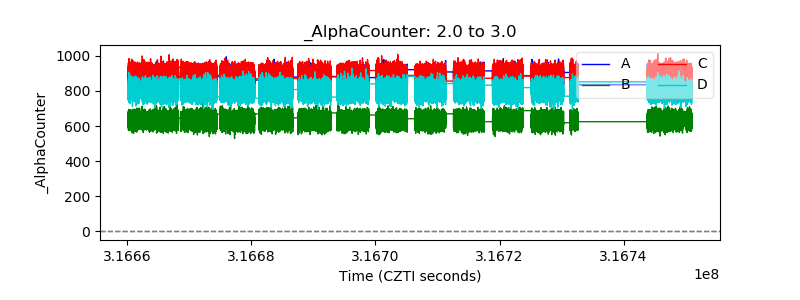 |
| _CPM_Rate | 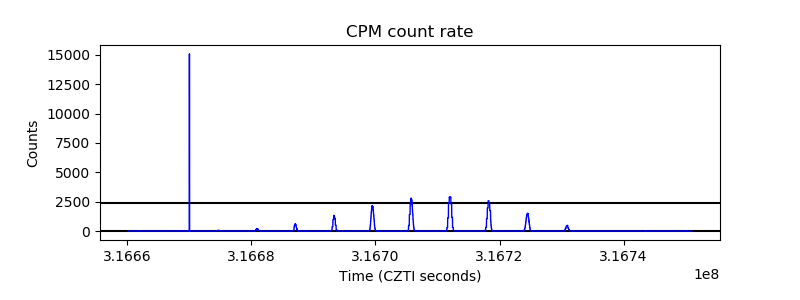 |
| CZT Counter |  |
| +2.5 Volts monitor |  |
| +5 Volts monitor | 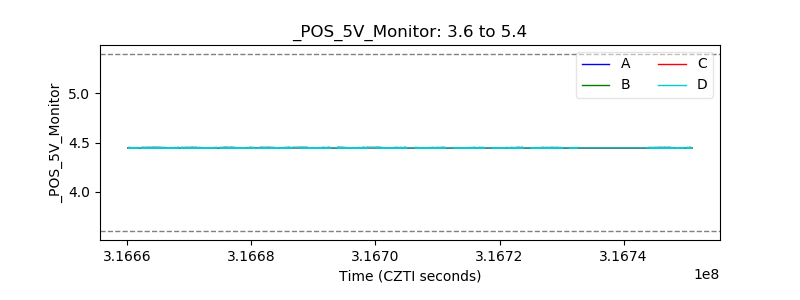 |
| _ROLL_ROT | 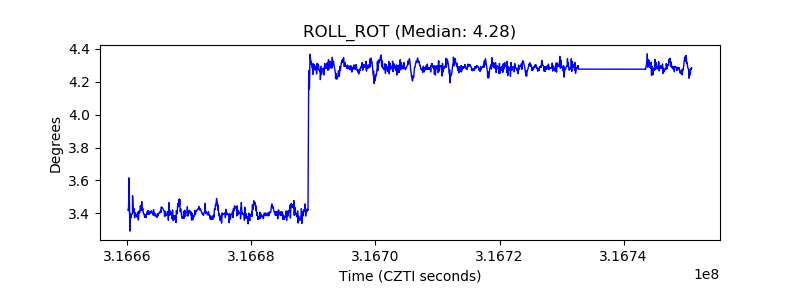 |
| _Roll_DEC | 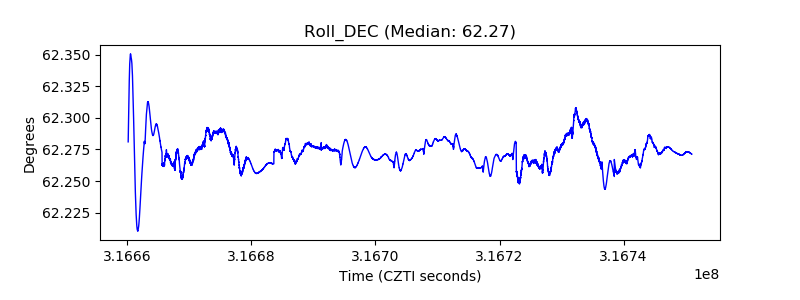 |
| _Roll_RA | 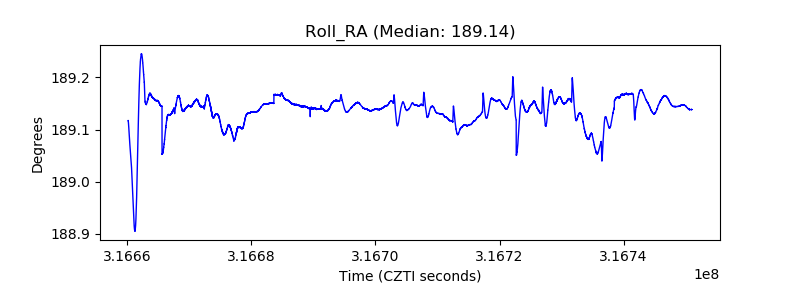 |
| Veto Counter | 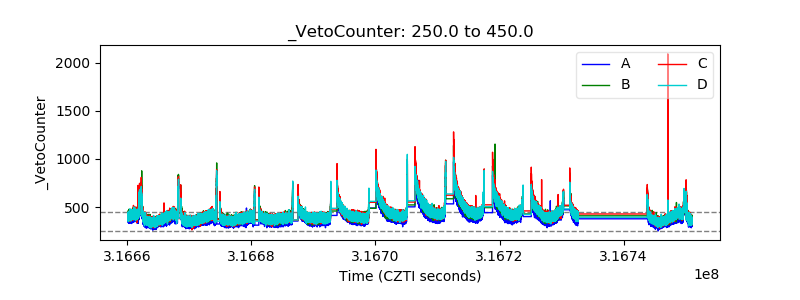 |