| Param | Original file | Final file |
|---|---|---|
| Filename | modeM0/AS1A08_009T01_9000003434_23222cztM0_level2.evt | modeM0/AS1A08_009T01_9000003434_23222cztM0_level2_quad_clean.evt |
| Size (bytes) | 359,449,920 | 50,526,720 |
| Size | 342.8 MB | 48.2 MB |
| Events in quadrant A | 1,730,493 | 334,120 |
| Events in quadrant B | 1,783,508 | 340,028 |
| Events in quadrant C | 4,368,297 | 296,123 |
| Events in quadrant D | 2,760,538 | 306,673 |
| Mode M0 | |||
|---|---|---|---|
| Quadrant | BADHDUFLAG | Total packets | Discarded packets |
| A | 0 | 7580 | 137 |
| B | 0 | 7695 | 138 |
| C | 0 | 15907 | 383 |
| D | 0 | 10795 | 156 |
| Mode M9 | |||
|---|---|---|---|
| Quadrant | BADHDUFLAG | Total packets | Discarded packets |
| A | 0 | 2 | 0 |
| B | 0 | 2 | 0 |
| C | 0 | 2 | 0 |
| D | 0 | 2 | 0 |
| Mode SS | |||
|---|---|---|---|
| Quadrant | BADHDUFLAG | Total packets | Discarded packets |
| A | 0 | 76 | 2 |
| B | 0 | 76 | 2 |
| C | 0 | 76 | 0 |
| D | 0 | 76 | 2 |
| Quadrant | Total seconds | Saturated seconds | Saturation percentage |
|---|---|---|---|
| A | 3564 | 30 | 0.841751% |
| B | 3564 | 72 | 2.020202% |
| C | 3547 | 909 | 25.627291% |
| D | 3565 | 349 | 9.789621% |
Noise dominated data is calculated using 1-second bins in cleaned event files. If a bin has >2000 counts, and if more than 50% of those come from <1% of pixels, then it is considered to be noise-dominated and hence unusable.
| Quadrant | # 1 sec bins | Bins with >0 counts | Bins with >2000 counts | High rate bins dominated by noise | Noise dominated (total time) | Noise dominated (detector-on time) | Marked lightcurve |
|---|---|---|---|---|---|---|---|
| A | 3897 | 3575 | 0 | 0 | 0.00% | 0.00% | 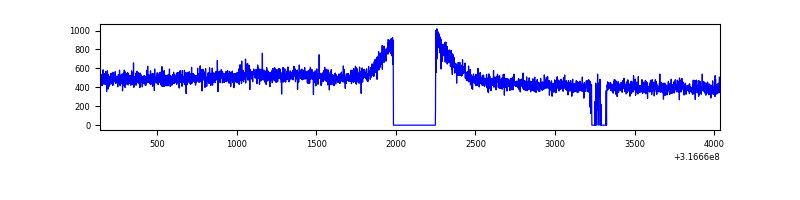 |
| B | 3897 | 3578 | 1 | 1 | 0.03% | 0.03% | 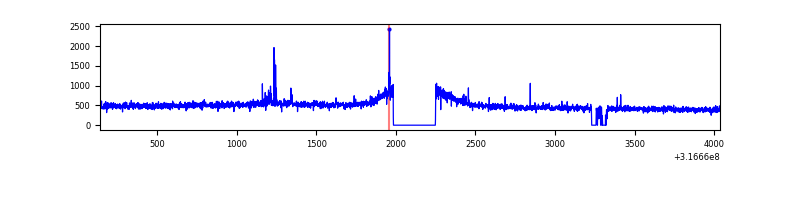 |
| C | 3897 | 3563 | 483 | 483 | 12.39% | 13.56% | 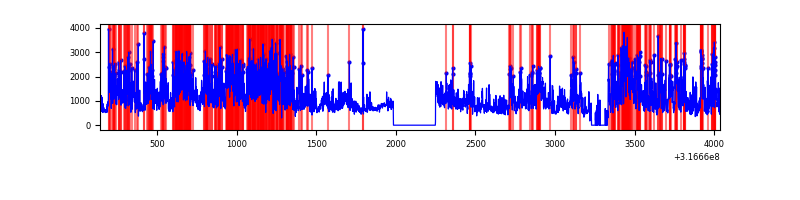 |
| D | 3897 | 3579 | 227 | 227 | 5.82% | 6.34% | 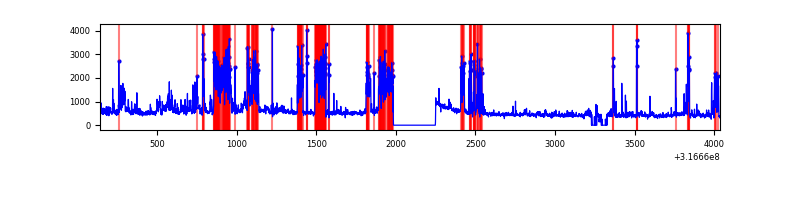 |
Top three noisy pixels from each quadrant. If the there are fewer than three noisy pixels in the level2.evt file, extra rows are filled as -1
| Pixel properties | Quadrant properties | ||||||
|---|---|---|---|---|---|---|---|
| Quadrant | DetID | PixID | Counts | Sigma | Mean | Median | Sigma |
| A | 13 | 254 | 5324 | 53.01 | 448 | 438 | 92.2 |
| A | 3 | 137 | 4148 | 40.25 | 448 | 438 | 92.2 |
| A | 0 | 226 | 3770 | 36.15 | 448 | 438 | 92.2 |
| B | 0 | 190 | 17598 | 196.16 | 449 | 437 | 87.5 |
| B | 12 | 111 | 10701 | 117.32 | 449 | 437 | 87.5 |
| B | 11 | 111 | 9522 | 103.85 | 449 | 437 | 87.5 |
| C | 2 | 16 | 1702947 | 17947.81 | 403 | 404 | 94.9 |
| C | 3 | 233 | 988906 | 10420.56 | 403 | 404 | 94.9 |
| C | 14 | 238 | 61679 | 645.95 | 403 | 404 | 94.9 |
| D | 1 | 239 | 554676 | 5312.52 | 424 | 411 | 104.3 |
| D | 2 | 82 | 238629 | 2283.27 | 424 | 411 | 104.3 |
| D | 2 | 152 | 149036 | 1424.54 | 424 | 411 | 104.3 |
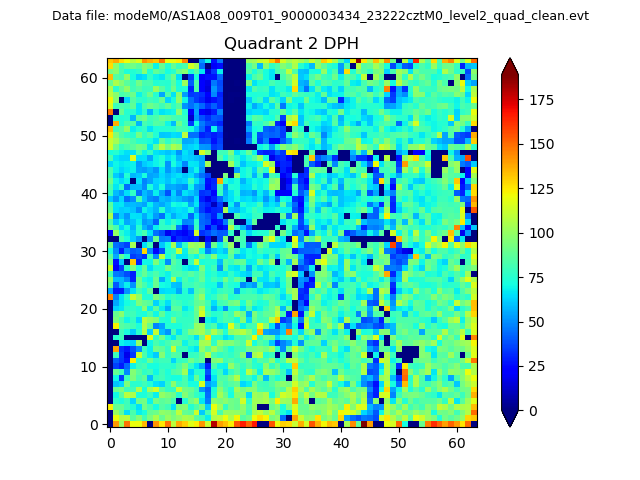
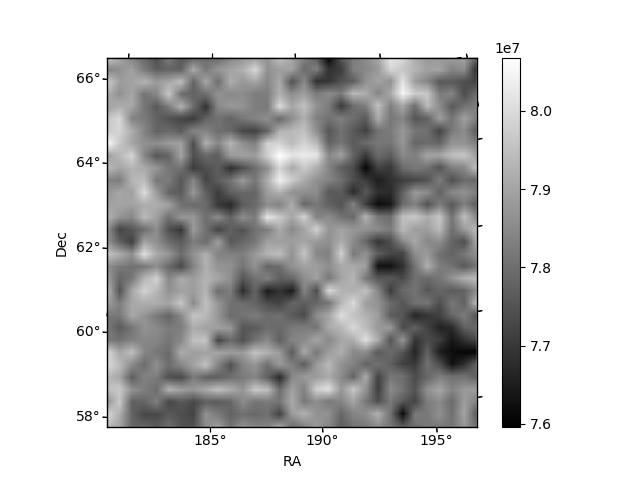
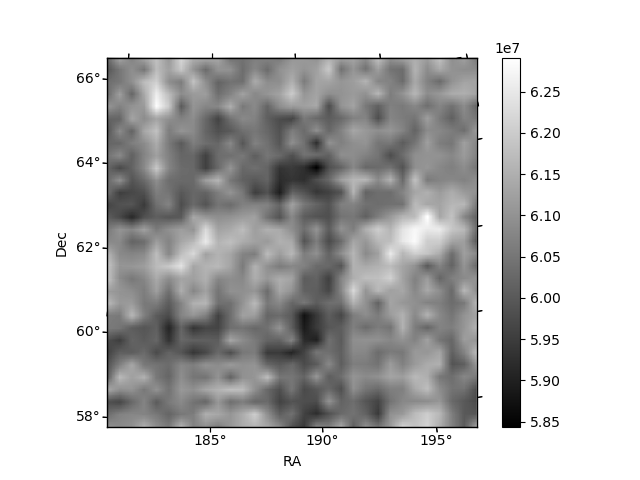
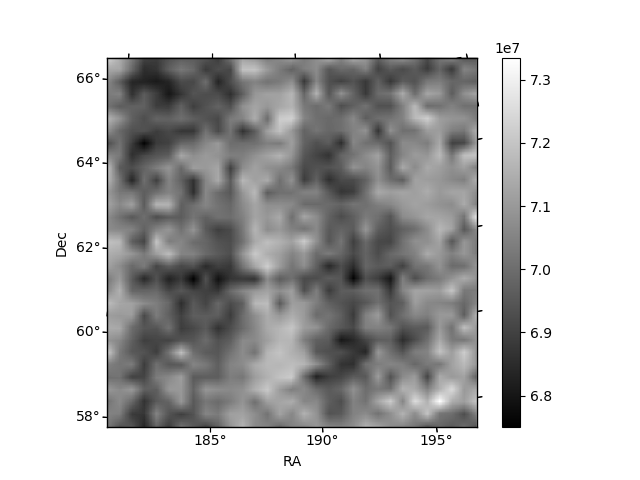
Histogram calculated using DETX and DETY for each event in the final _common_clean file
| Quadrant A | 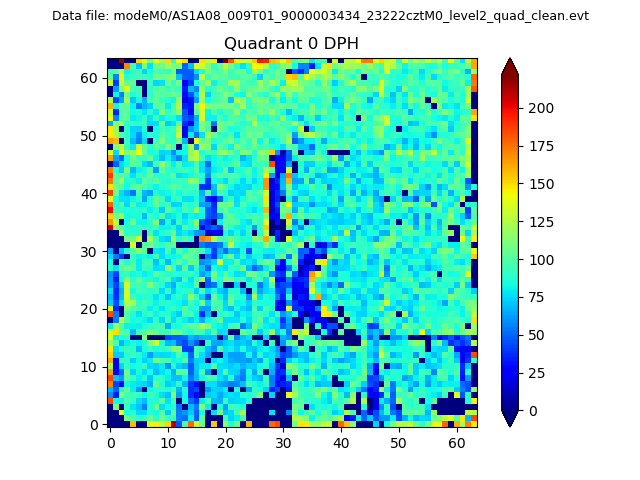 |
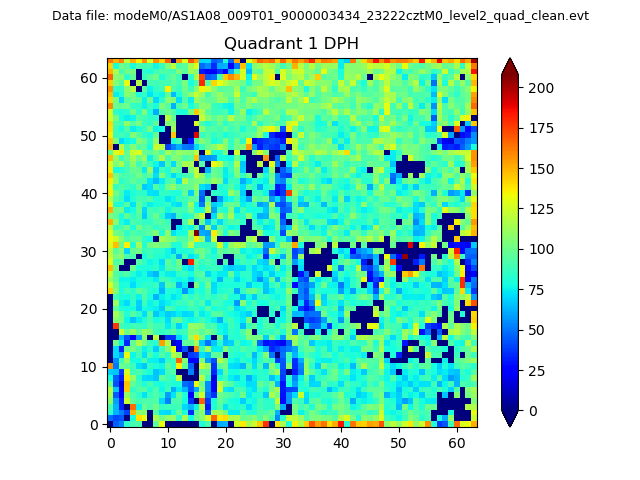 |
Quadrant B |
|---|---|---|---|
| Quadrant D | 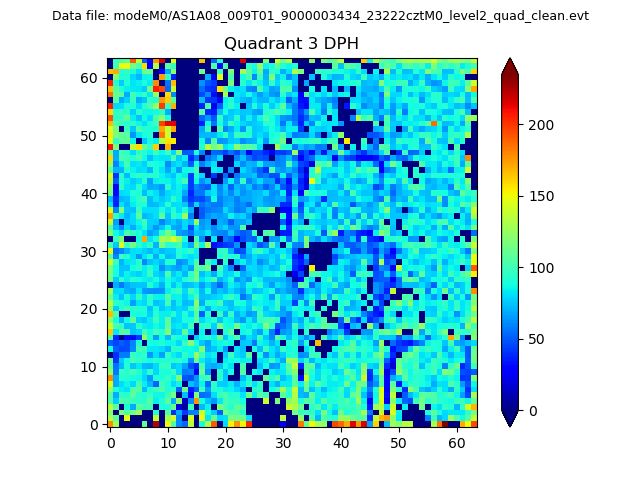 |
 |
Quadrant C |
| Plot type | Count rate plots | Images |
|---|---|---|
| Comparison with Poisson distribution Blue bars denote a histogram of data divided into 1 sec bins. Red curve is a Poisson curve with rate = median count rate of data. |
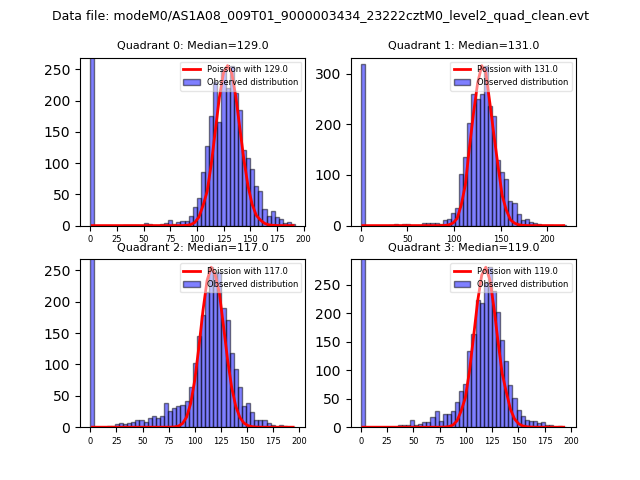 |
 |
| Quadrant-wise count rates Data is divided into 100 sec bins |
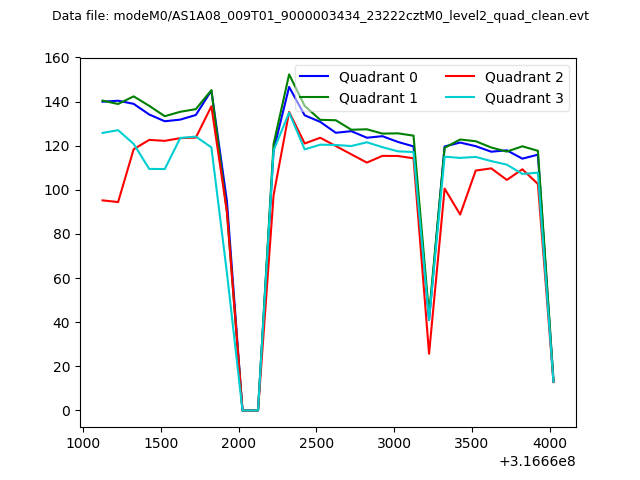 |
|
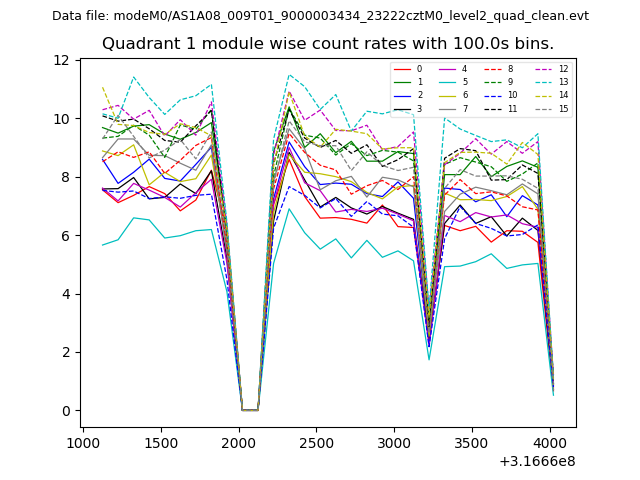
| Module-wise count rates for Quadrant A Data is divided into 100 sec bins |
 |
 |
| Module-wise count rates for Quadrant B Data is divided into 100 sec bins |
 |
 |
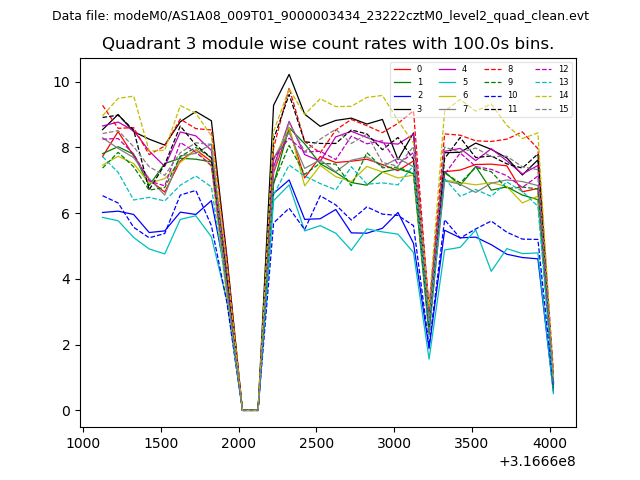
| Module-wise count rates for Quadrant C Data is divided into 100 sec bins |
 |
 |
| Module-wise count rates for Quadrant D Data is divided into 100 sec bins |
 |
 |
| Parameter | Plot |
|---|---|
| CZT HV Monitor | 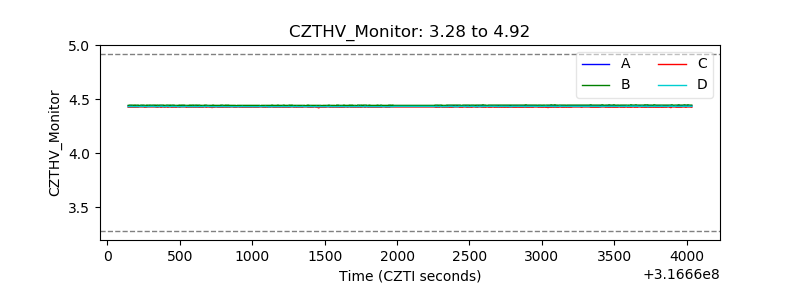 |
| D_VDD | 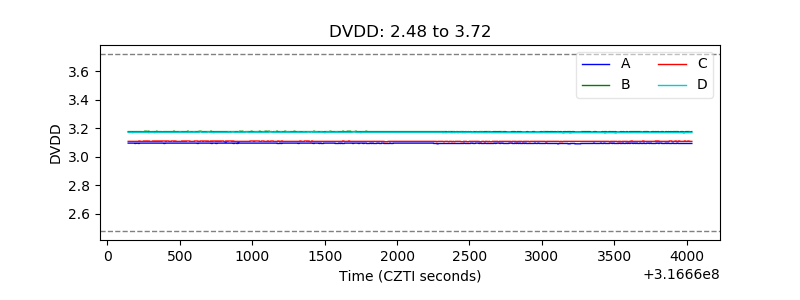 |
| Temperature 1 | 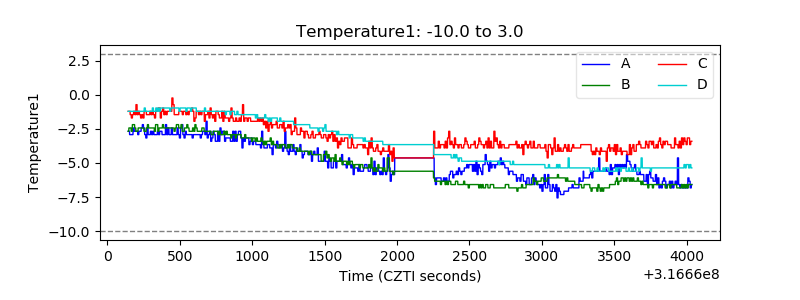 |
| Veto HV Monitor | 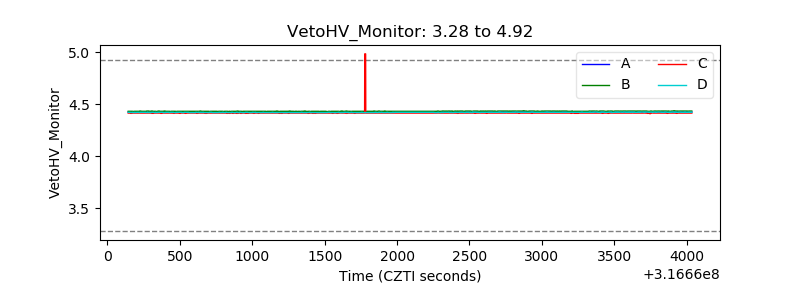 |
| Veto LLD | 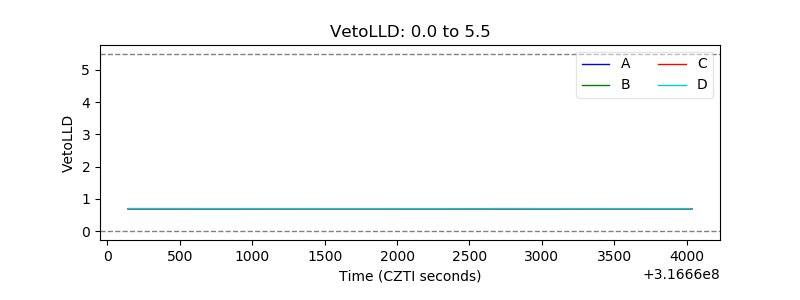 |
| Alpha Counter | 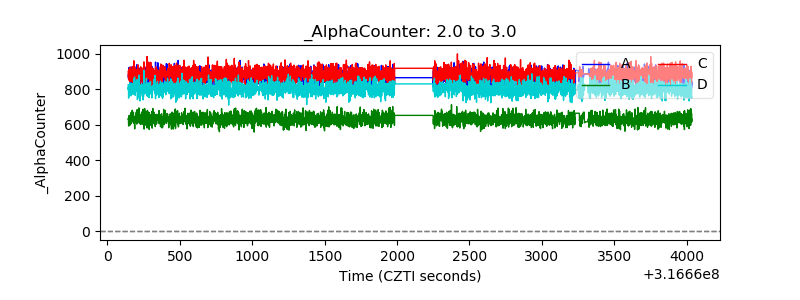 |
| _CPM_Rate | 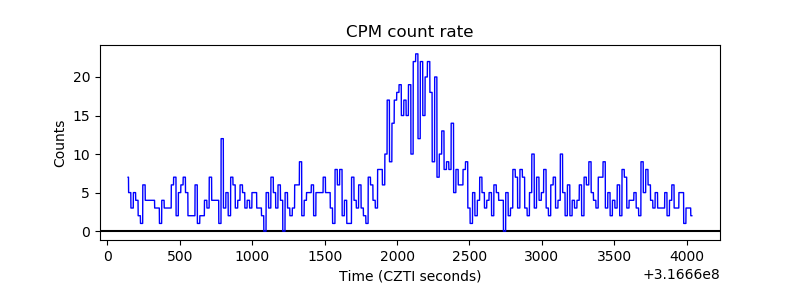 |
| CZT Counter | 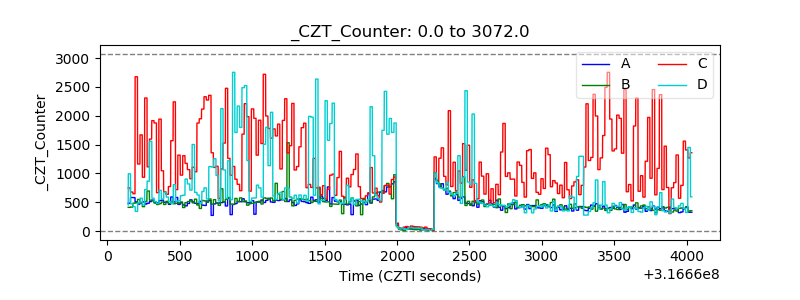 |
| +2.5 Volts monitor |  |
| +5 Volts monitor |  |
| _ROLL_ROT |  |
| _Roll_DEC | 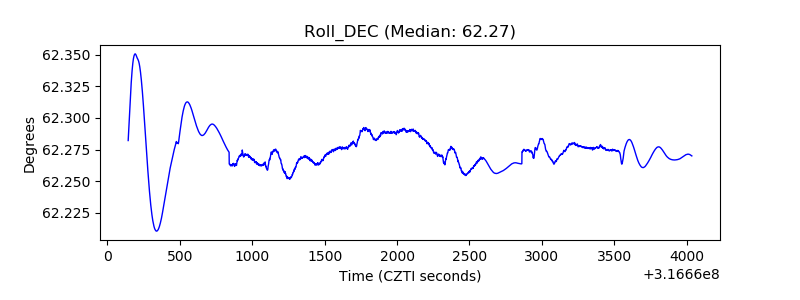 |
| _Roll_RA | 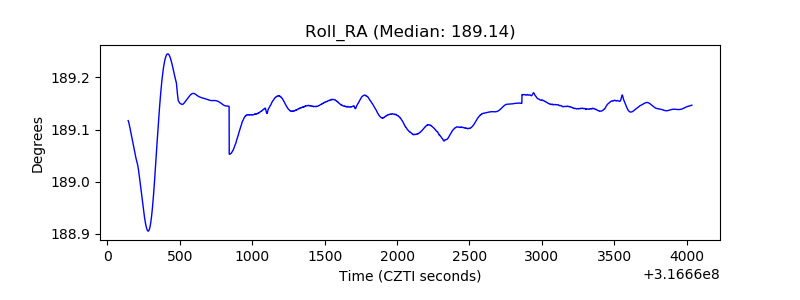 |
| Veto Counter |  |