| Param | Original file | Final file |
|---|---|---|
| Filename | modeM0/AS1A08_009T01_9000003434_23223cztM0_level2.evt | modeM0/AS1A08_009T01_9000003434_23223cztM0_level2_quad_clean.evt |
| Size (bytes) | 586,031,040 | 108,420,480 |
| Size | 558.9 MB | 103.4 MB |
| Events in quadrant A | 3,247,281 | 712,752 |
| Events in quadrant B | 3,362,100 | 728,080 |
| Events in quadrant C | 5,260,708 | 682,774 |
| Events in quadrant D | 5,385,044 | 653,514 |
| Mode M0 | |||
|---|---|---|---|
| Quadrant | BADHDUFLAG | Total packets | Discarded packets |
| A | 0 | 14792 | 1 |
| B | 0 | 15002 | 1 |
| C | 0 | 20431 | 1 |
| D | 0 | 21179 | 1 |
| Mode M9 | |||
|---|---|---|---|
| Quadrant | BADHDUFLAG | Total packets | Discarded packets |
| A | 0 | 4 | 0 |
| B | 0 | 4 | 0 |
| C | 0 | 4 | 0 |
| D | 0 | 4 | 0 |
| Mode SS | |||
|---|---|---|---|
| Quadrant | BADHDUFLAG | Total packets | Discarded packets |
| A | 0 | 148 | 0 |
| B | 0 | 148 | 0 |
| C | 0 | 148 | 0 |
| D | 0 | 148 | 0 |
| Quadrant | Total seconds | Saturated seconds | Saturation percentage |
|---|---|---|---|
| A | 7266 | 41 | 0.564272% |
| B | 7267 | 78 | 1.073345% |
| C | 7267 | 407 | 5.600661% |
| D | 7267 | 529 | 7.279483% |
Noise dominated data is calculated using 1-second bins in cleaned event files. If a bin has >2000 counts, and if more than 50% of those come from <1% of pixels, then it is considered to be noise-dominated and hence unusable.
| Quadrant | # 1 sec bins | Bins with >0 counts | Bins with >2000 counts | High rate bins dominated by noise | Noise dominated (total time) | Noise dominated (detector-on time) | Marked lightcurve |
|---|---|---|---|---|---|---|---|
| A | 7621 | 7267 | 0 | 0 | 0.00% | 0.00% |  |
| B | 7622 | 7268 | 3 | 3 | 0.04% | 0.04% |  |
| C | 7622 | 7268 | 232 | 232 | 3.04% | 3.19% |  |
| D | 7622 | 7267 | 368 | 368 | 4.83% | 5.06% |  |
Top three noisy pixels from each quadrant. If the there are fewer than three noisy pixels in the level2.evt file, extra rows are filled as -1
| Pixel properties | Quadrant properties | ||||||
|---|---|---|---|---|---|---|---|
| Quadrant | DetID | PixID | Counts | Sigma | Mean | Median | Sigma |
| A | 13 | 254 | 10371 | 55.99 | 841 | 823 | 170.5 |
| A | 3 | 137 | 7655 | 40.06 | 841 | 823 | 170.5 |
| A | 0 | 226 | 7134 | 37.01 | 841 | 823 | 170.5 |
| B | 0 | 190 | 29505 | 177.97 | 842 | 819 | 161.2 |
| B | 3 | 64 | 28032 | 168.83 | 842 | 819 | 161.2 |
| B | 12 | 111 | 20234 | 120.45 | 842 | 819 | 161.2 |
| C | 3 | 233 | 1701445 | 9017.66 | 801 | 803 | 188.6 |
| C | 2 | 16 | 264057 | 1395.91 | 801 | 803 | 188.6 |
| C | 14 | 238 | 125991 | 663.81 | 801 | 803 | 188.6 |
| D | 1 | 52 | 1517382 | 7884.07 | 791 | 768 | 192.4 |
| D | 2 | 152 | 274545 | 1423.22 | 791 | 768 | 192.4 |
| D | 1 | 239 | 272963 | 1415.0 | 791 | 768 | 192.4 |
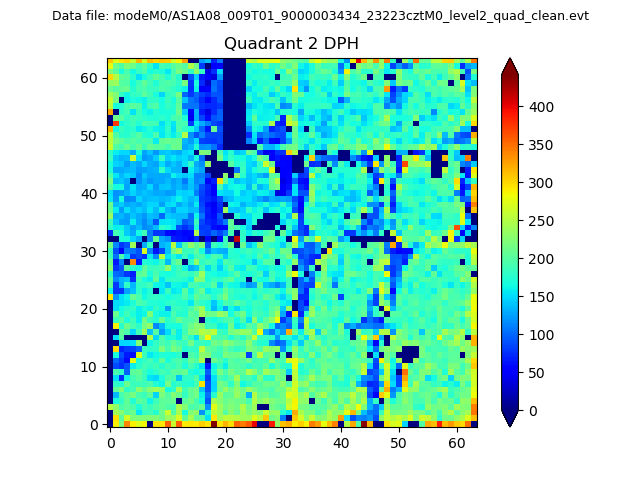
Histogram calculated using DETX and DETY for each event in the final _common_clean file
| Quadrant A | 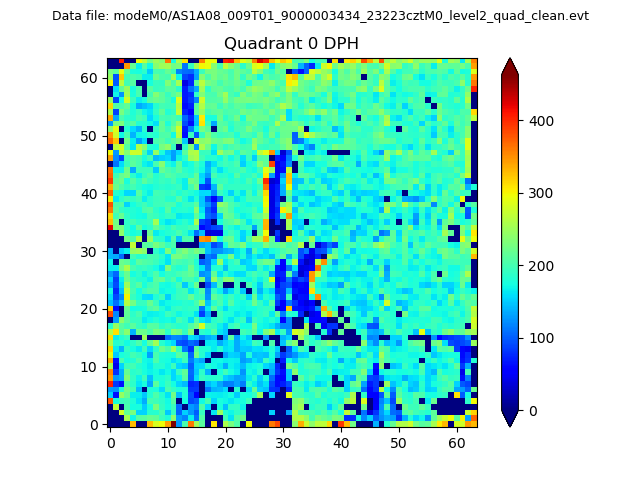 |
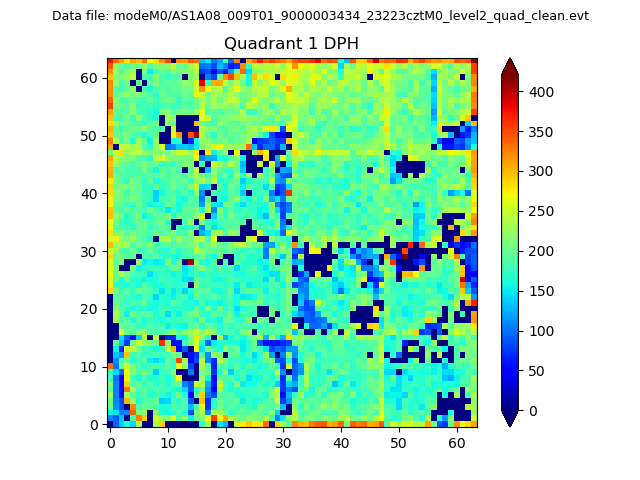 |
Quadrant B |
|---|---|---|---|
| Quadrant D | 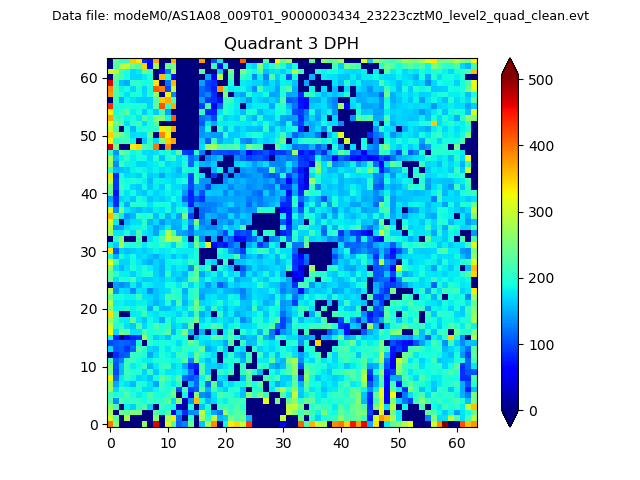 |
 |
Quadrant C |
| Plot type | Count rate plots | Images |
|---|---|---|
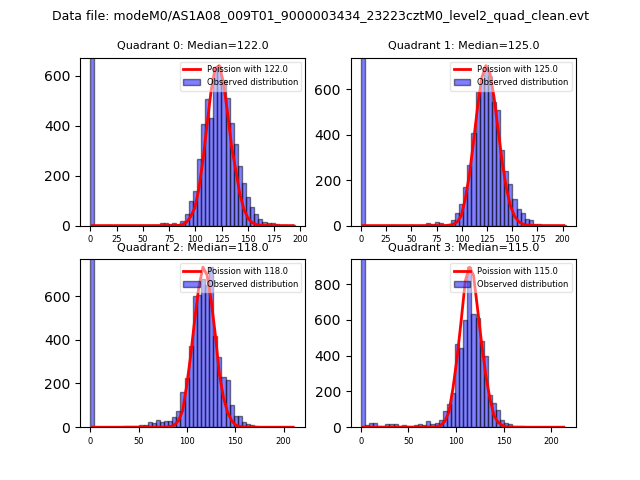
| Comparison with Poisson distribution Blue bars denote a histogram of data divided into 1 sec bins. Red curve is a Poisson curve with rate = median count rate of data. |
 |
 |
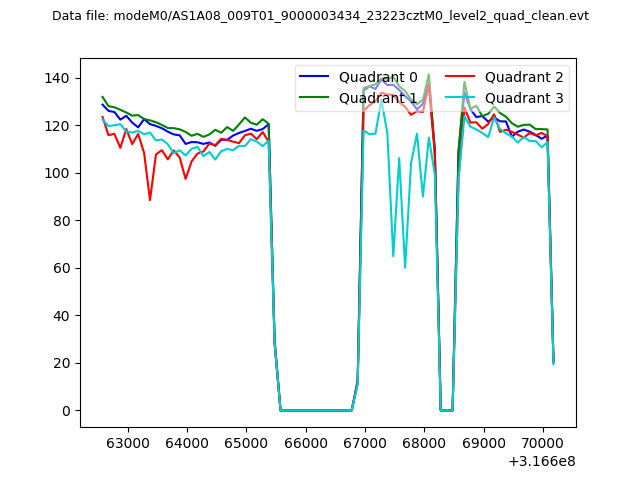
| Quadrant-wise count rates Data is divided into 100 sec bins |
 |
|
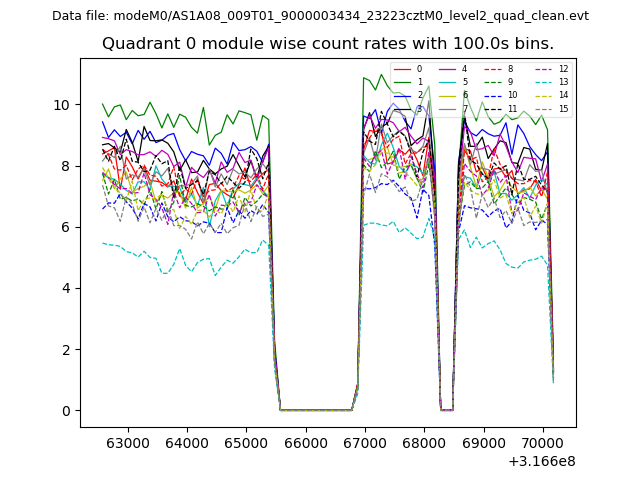
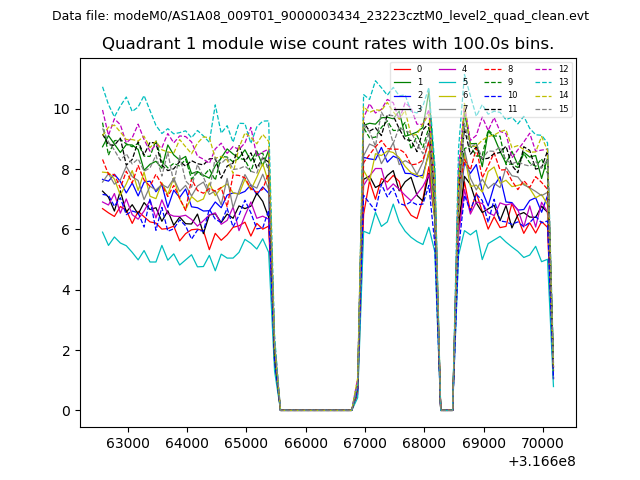
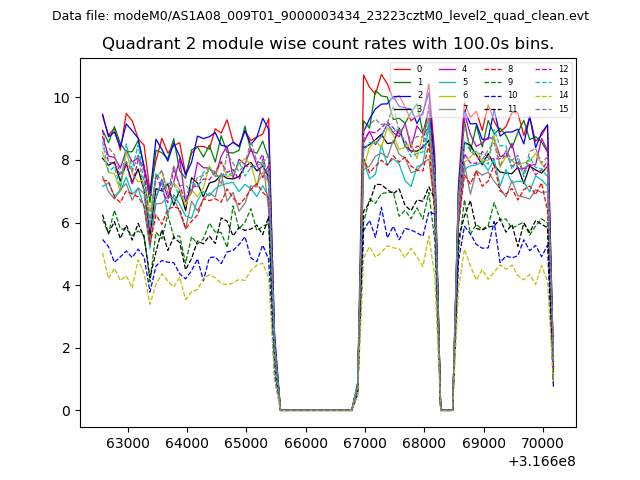
| Module-wise count rates for Quadrant A Data is divided into 100 sec bins |
 |
 |
| Module-wise count rates for Quadrant B Data is divided into 100 sec bins |
 |
 |
| Module-wise count rates for Quadrant C Data is divided into 100 sec bins |
 |
 |
| Module-wise count rates for Quadrant D Data is divided into 100 sec bins |
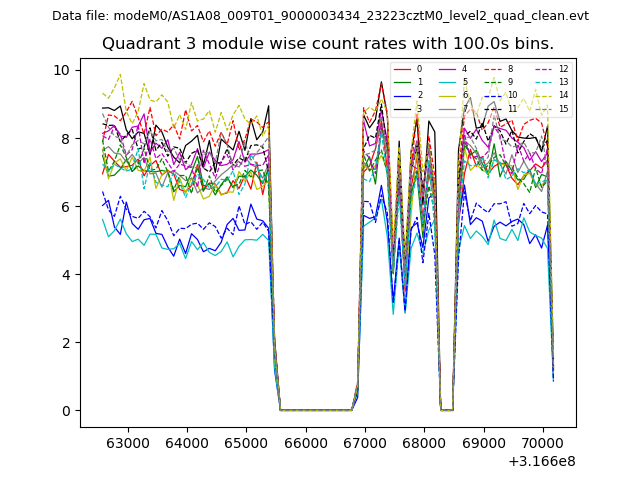 |
 |
| Parameter | Plot |
|---|---|
| CZT HV Monitor | 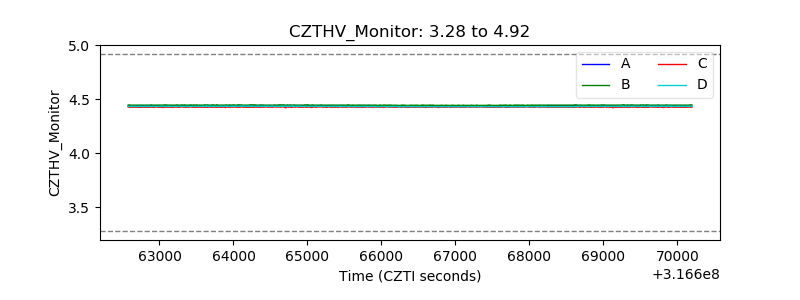 |
| D_VDD | 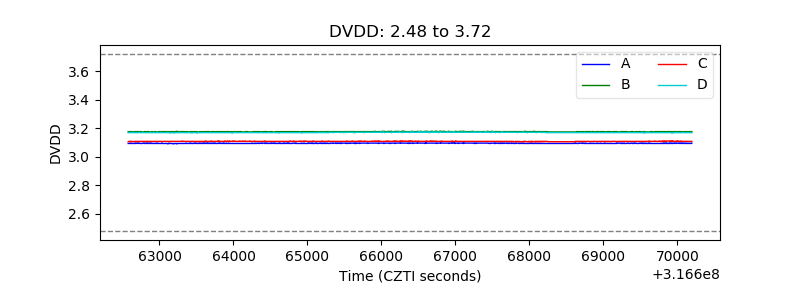 |
| Temperature 1 | 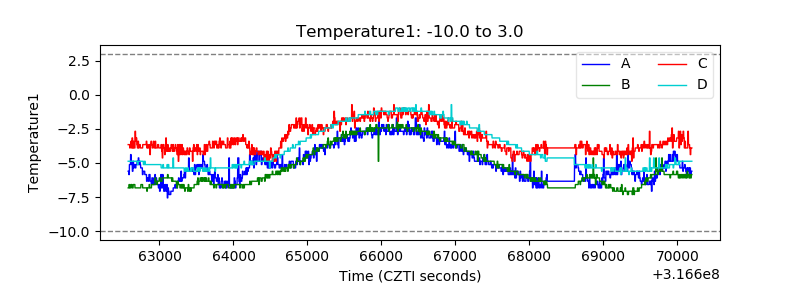 |
| Veto HV Monitor | 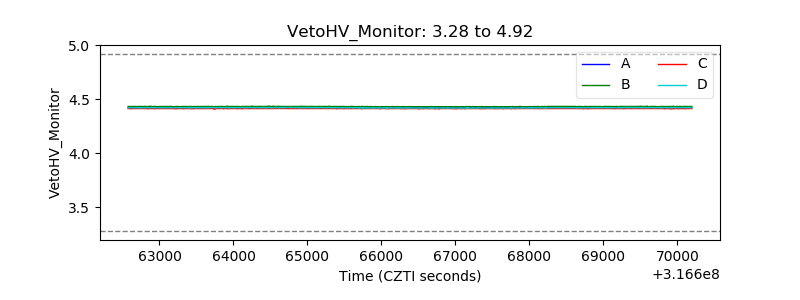 |
| Veto LLD | 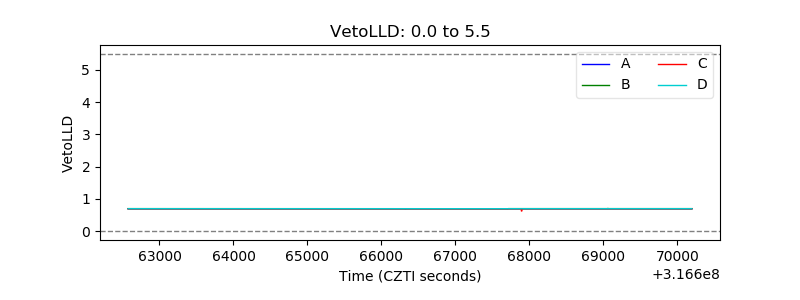 |
| Alpha Counter | 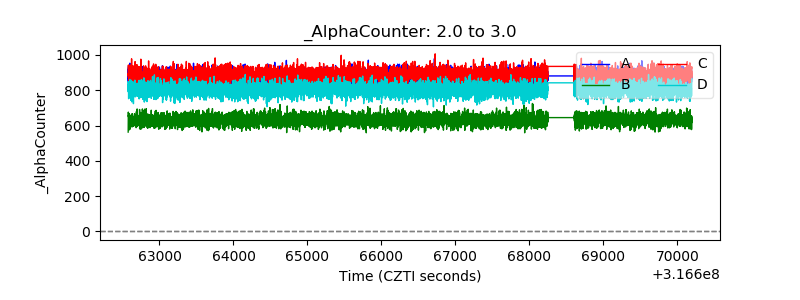 |
| _CPM_Rate | 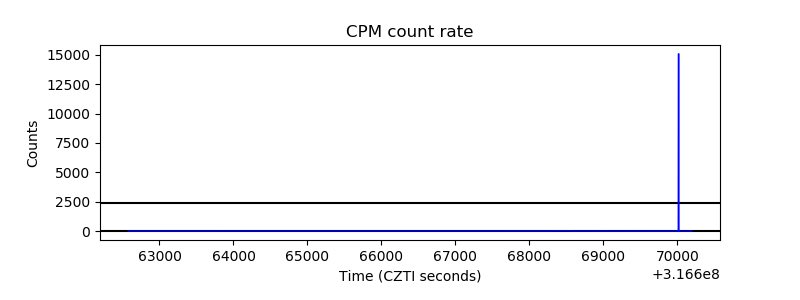 |
| CZT Counter | 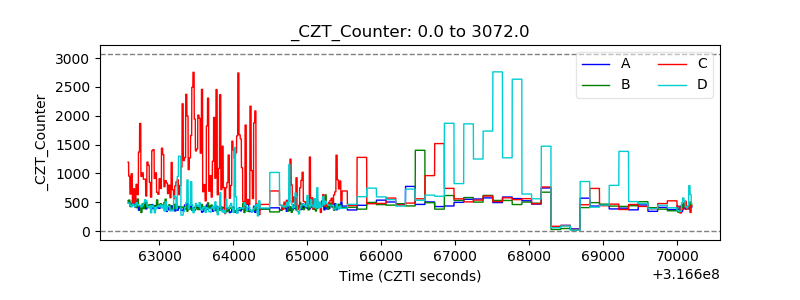 |
| +2.5 Volts monitor |  |
| +5 Volts monitor |  |
| _ROLL_ROT | 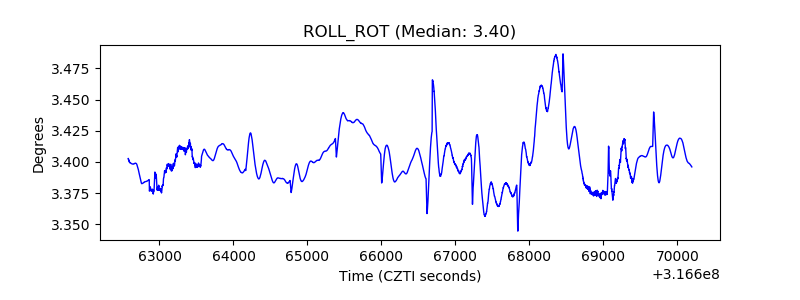 |
| _Roll_DEC | 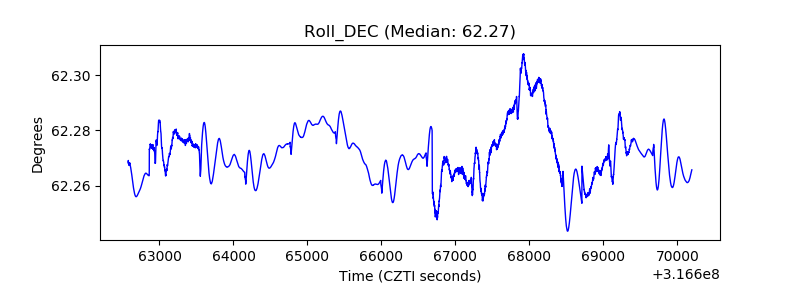 |
| _Roll_RA | 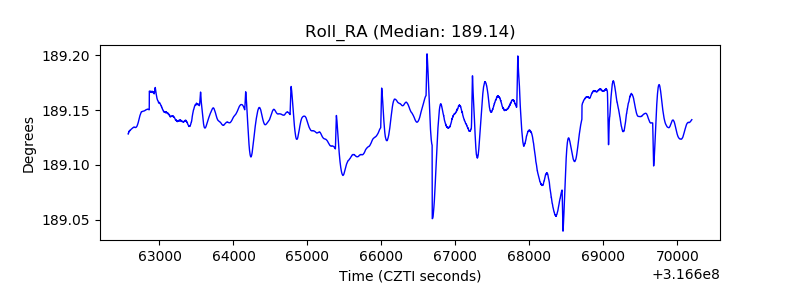 |
| Veto Counter | 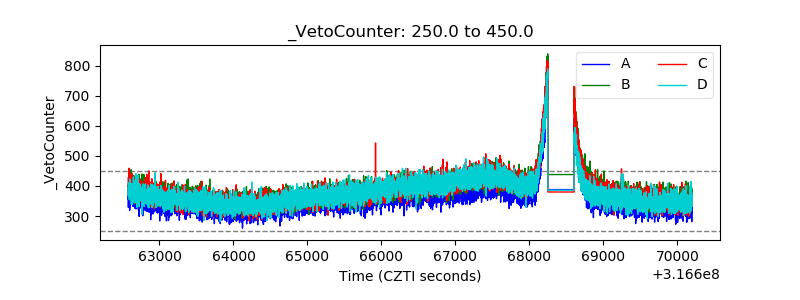 |