| Param | Original file | Final file |
|---|---|---|
| Filename | modeM0/AS1A08_009T01_9000003434_23225cztM0_level2.evt | modeM0/AS1A08_009T01_9000003434_23225cztM0_level2_quad_clean.evt |
| Size (bytes) | 748,448,640 | 154,684,800 |
| Size | 713.8 MB | 147.5 MB |
| Events in quadrant A | 4,929,504 | 991,679 |
| Events in quadrant B | 5,032,906 | 1,015,848 |
| Events in quadrant C | 5,203,154 | 972,488 |
| Events in quadrant D | 6,758,140 | 945,857 |
| Mode M0 | |||
|---|---|---|---|
| Quadrant | BADHDUFLAG | Total packets | Discarded packets |
| A | 0 | 22144 | 1 |
| B | 0 | 22235 | 2 |
| C | 0 | 22629 | 1 |
| D | 0 | 27560 | 1 |
| Mode M9 | |||
|---|---|---|---|
| Quadrant | BADHDUFLAG | Total packets | Discarded packets |
| A | 0 | 5 | 0 |
| B | 0 | 5 | 0 |
| C | 0 | 5 | 0 |
| D | 0 | 5 | 0 |
| Mode SS | |||
|---|---|---|---|
| Quadrant | BADHDUFLAG | Total packets | Discarded packets |
| A | 0 | 222 | 0 |
| B | 0 | 222 | 0 |
| C | 0 | 222 | 0 |
| D | 0 | 222 | 0 |
| Quadrant | Total seconds | Saturated seconds | Saturation percentage |
|---|---|---|---|
| A | 10965 | 63 | 0.574555% |
| B | 10965 | 58 | 0.528956% |
| C | 10965 | 104 | 0.948472% |
| D | 10966 | 265 | 2.416560% |
Noise dominated data is calculated using 1-second bins in cleaned event files. If a bin has >2000 counts, and if more than 50% of those come from <1% of pixels, then it is considered to be noise-dominated and hence unusable.
| Quadrant | # 1 sec bins | Bins with >0 counts | Bins with >2000 counts | High rate bins dominated by noise | Noise dominated (total time) | Noise dominated (detector-on time) | Marked lightcurve |
|---|---|---|---|---|---|---|---|
| A | 11480 | 10966 | 1 | 1 | 0.01% | 0.01% | 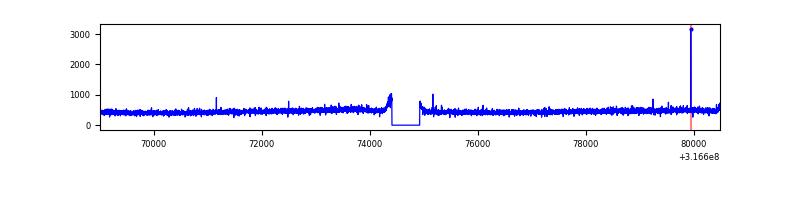 |
| B | 11481 | 10966 | 0 | 0 | 0.00% | 0.00% | 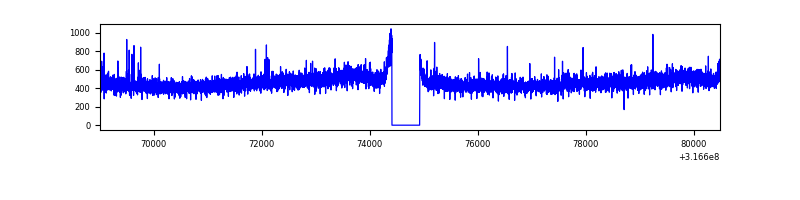 |
| C | 11481 | 10967 | 4 | 4 | 0.03% | 0.04% | 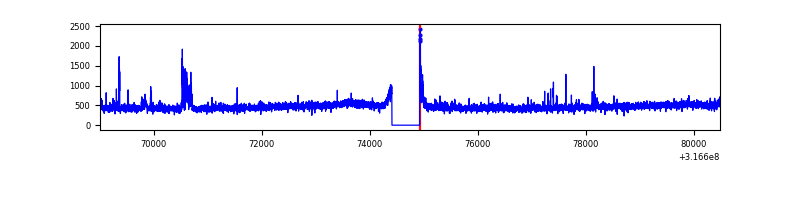 |
| D | 11481 | 10967 | 177 | 177 | 1.54% | 1.61% | 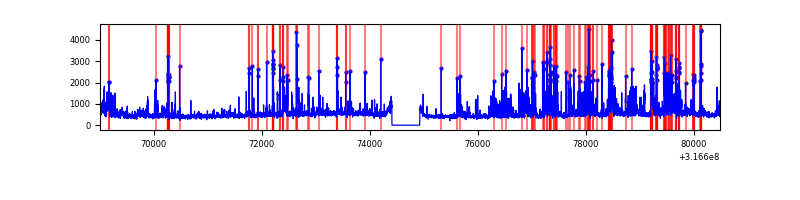 |
Top three noisy pixels from each quadrant. If the there are fewer than three noisy pixels in the level2.evt file, extra rows are filled as -1
| Pixel properties | Quadrant properties | ||||||
|---|---|---|---|---|---|---|---|
| Quadrant | DetID | PixID | Counts | Sigma | Mean | Median | Sigma |
| A | 13 | 254 | 16604 | 60.1 | 1274 | 1245 | 255.6 |
| A | 3 | 137 | 11293 | 39.32 | 1274 | 1245 | 255.6 |
| A | 0 | 226 | 10998 | 38.16 | 1274 | 1245 | 255.6 |
| B | 12 | 111 | 30179 | 118.95 | 1276 | 1244 | 243.3 |
| B | 11 | 111 | 26794 | 105.03 | 1276 | 1244 | 243.3 |
| B | 0 | 190 | 26295 | 102.98 | 1276 | 1244 | 243.3 |
| C | 14 | 238 | 195110 | 682.02 | 1223 | 1233 | 284.3 |
| C | 0 | 10 | 105695 | 367.47 | 1223 | 1233 | 284.3 |
| C | 2 | 16 | 98039 | 340.54 | 1223 | 1233 | 284.3 |
| D | 1 | 52 | 1141236 | 3798.84 | 1230 | 1192 | 300.1 |
| D | 2 | 152 | 252300 | 836.74 | 1230 | 1192 | 300.1 |
| D | 2 | 82 | 201113 | 666.17 | 1230 | 1192 | 300.1 |
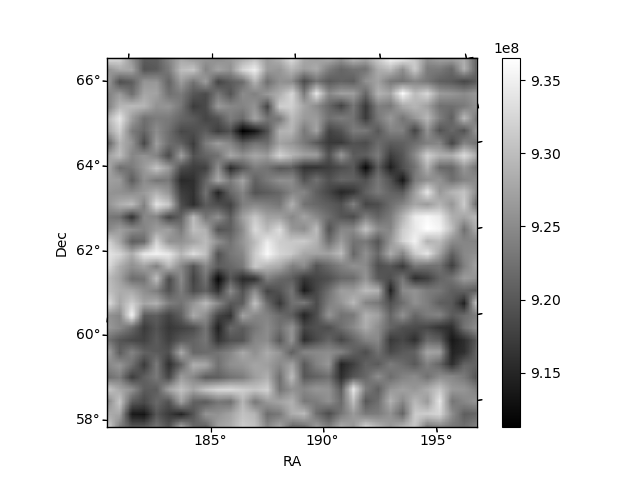
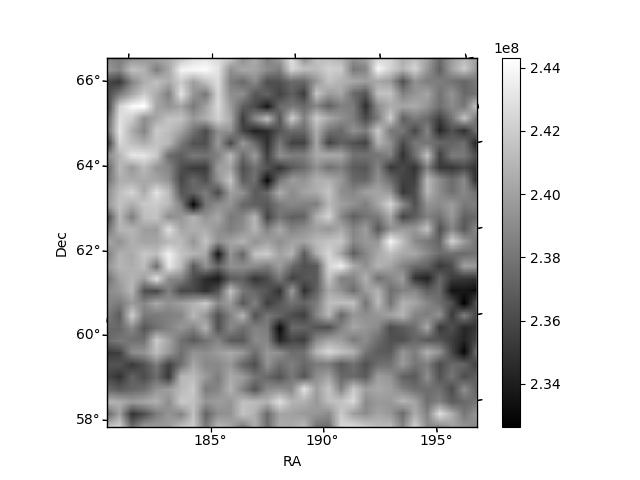
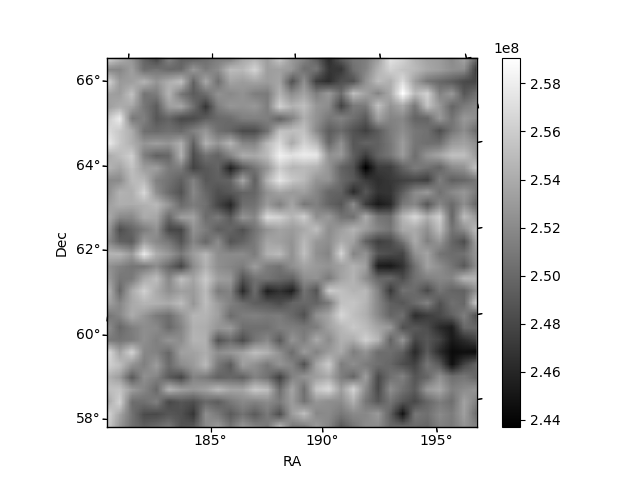
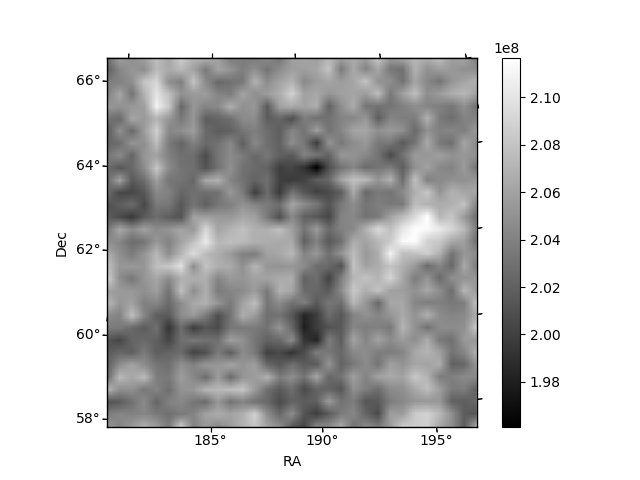
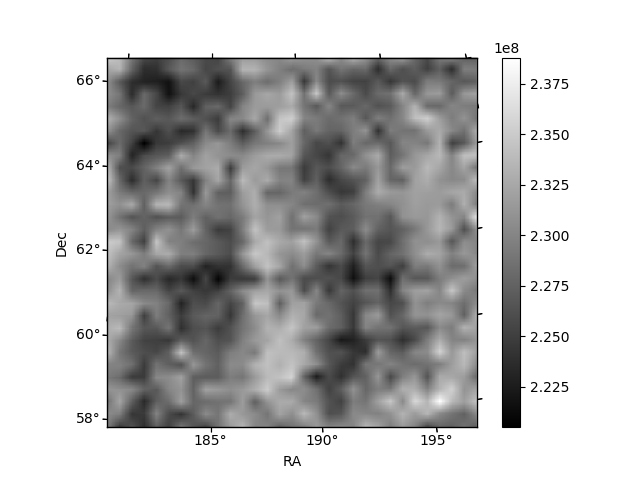
Histogram calculated using DETX and DETY for each event in the final _common_clean file
| Quadrant A | 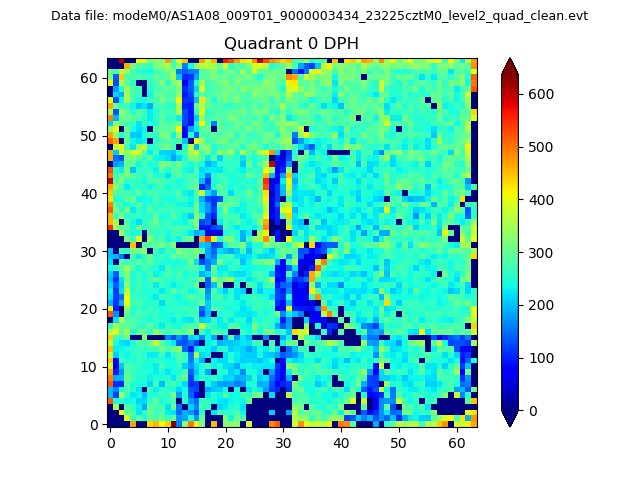 |
 |
Quadrant B |
|---|---|---|---|
| Quadrant D | 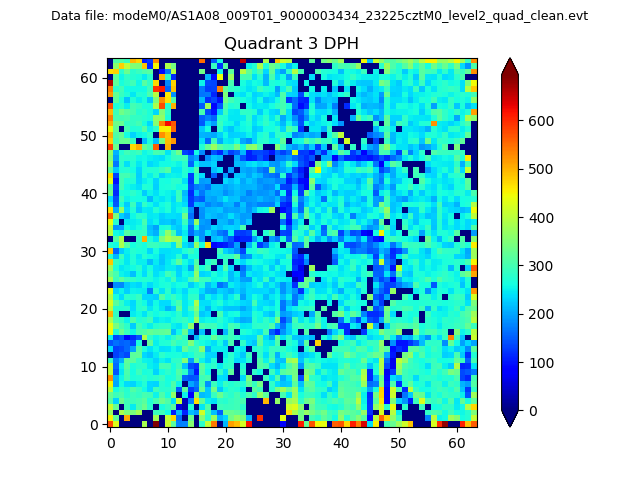 |
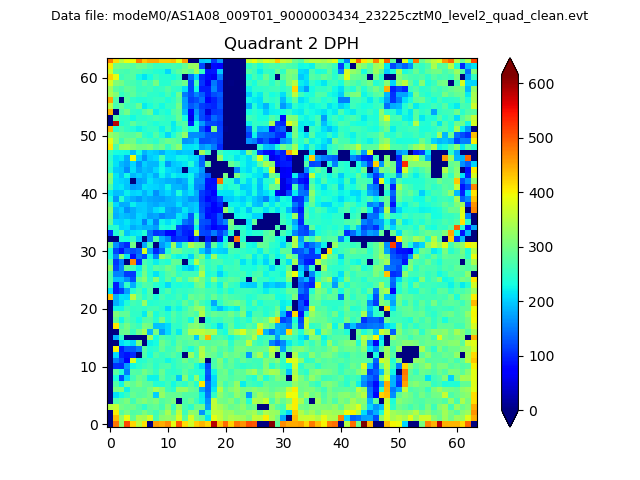 |
Quadrant C |
| Plot type | Count rate plots | Images |
|---|---|---|
| Comparison with Poisson distribution Blue bars denote a histogram of data divided into 1 sec bins. Red curve is a Poisson curve with rate = median count rate of data. |
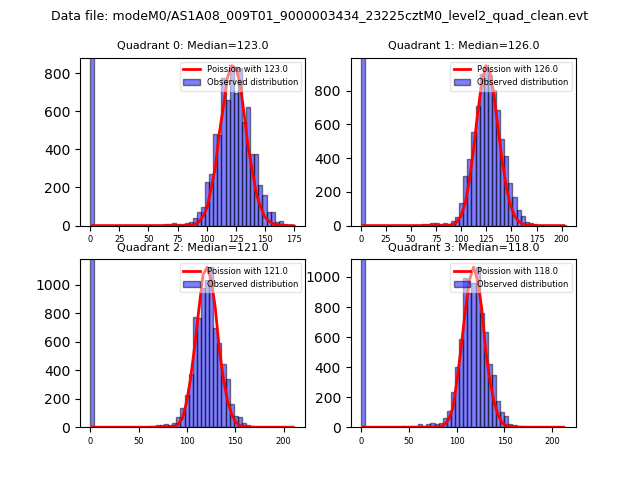 |
 |
| Quadrant-wise count rates Data is divided into 100 sec bins |
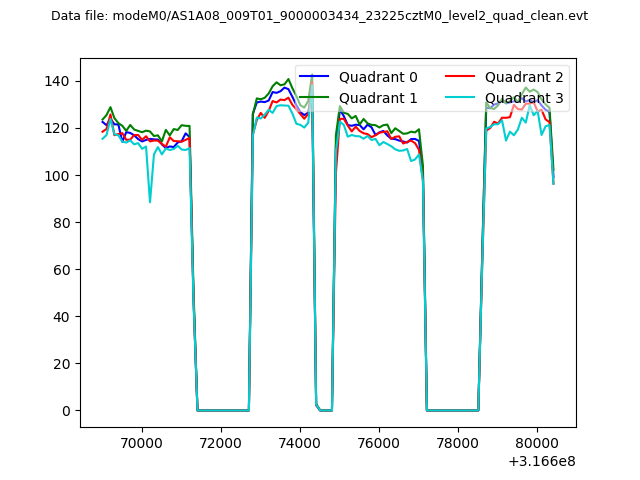 |
|
| Module-wise count rates for Quadrant A Data is divided into 100 sec bins |
 |
 |
| Module-wise count rates for Quadrant B Data is divided into 100 sec bins |
 |
 |
| Module-wise count rates for Quadrant C Data is divided into 100 sec bins |
 |
 |
| Module-wise count rates for Quadrant D Data is divided into 100 sec bins |
 |
 |
| Parameter | Plot |
|---|---|
| CZT HV Monitor |  |
| D_VDD | 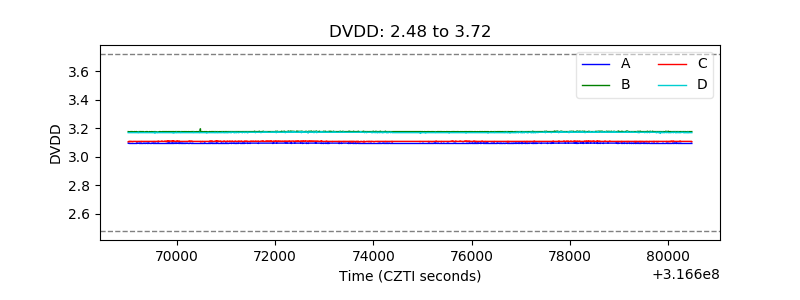 |
| Temperature 1 | 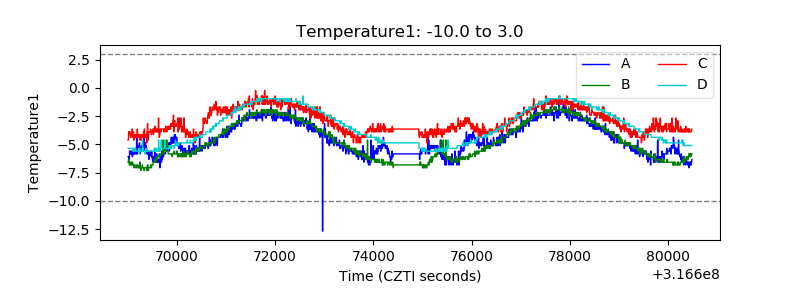 |
| Veto HV Monitor |  |
| Veto LLD | 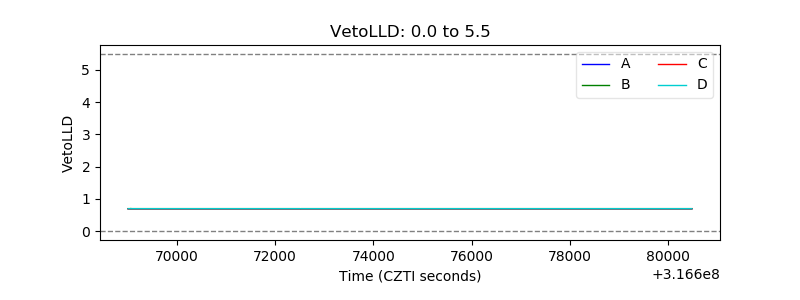 |
| Alpha Counter | 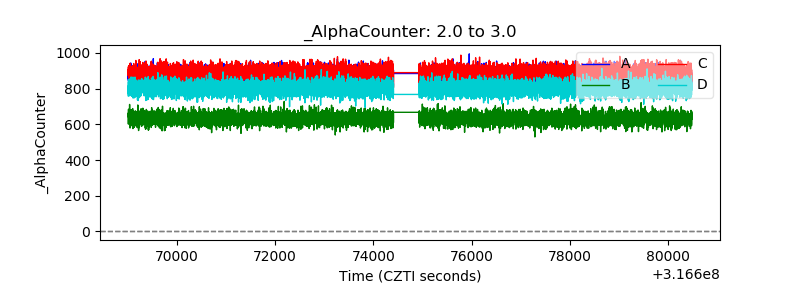 |
| _CPM_Rate | 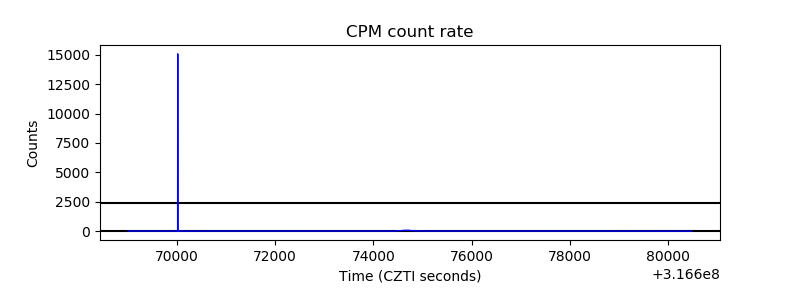 |
| CZT Counter | 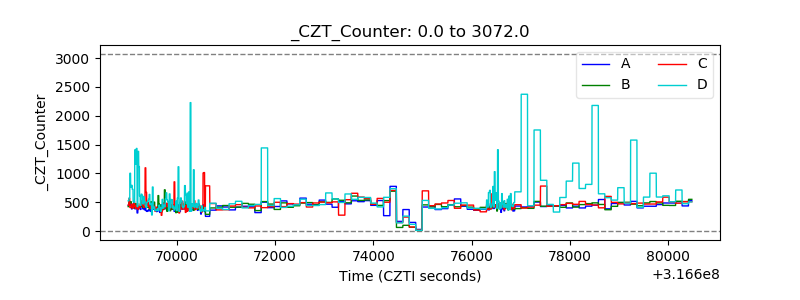 |
| +2.5 Volts monitor | 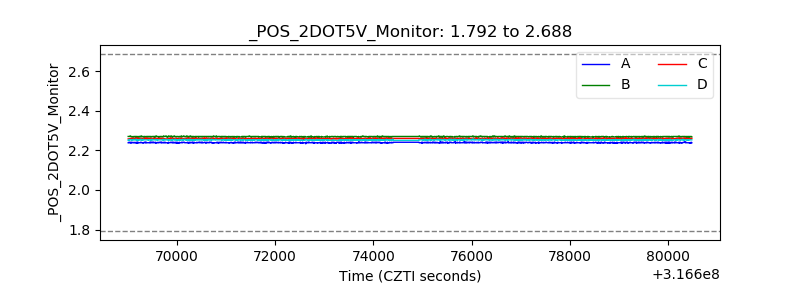 |
| +5 Volts monitor |  |
| _ROLL_ROT | 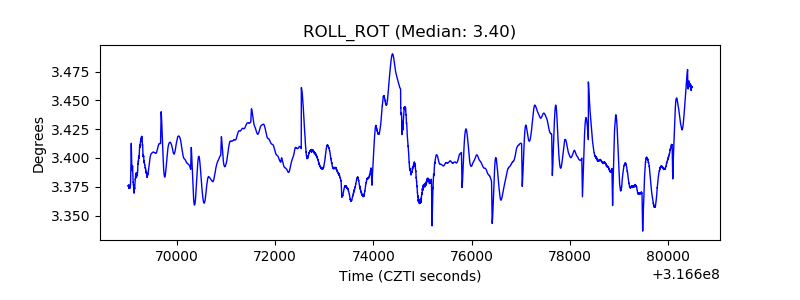 |
| _Roll_DEC |  |
| _Roll_RA | 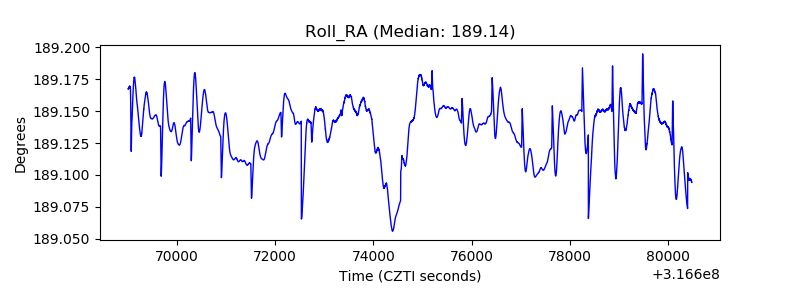 |
| Veto Counter | 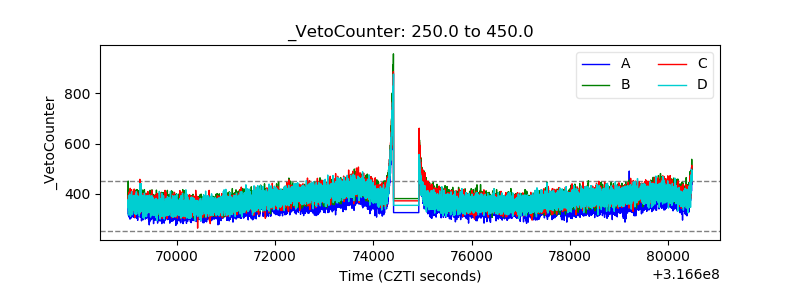 |