| Param | Original file | Final file |
|---|---|---|
| Filename | modeM0/AS1A08_009T01_9000003434_23229cztM0_level2.evt | modeM0/AS1A08_009T01_9000003434_23229cztM0_level2_quad_clean.evt |
| Size (bytes) | 483,451,200 | 78,992,640 |
| Size | 461.1 MB | 75.3 MB |
| Events in quadrant A | 3,146,405 | 501,933 |
| Events in quadrant B | 3,051,195 | 508,436 |
| Events in quadrant C | 3,069,325 | 487,366 |
| Events in quadrant D | 4,959,025 | 466,962 |
| Mode M0 | |||
|---|---|---|---|
| Quadrant | BADHDUFLAG | Total packets | Discarded packets |
| A | 0 | 13371 | 1 |
| B | 0 | 12916 | 1 |
| C | 0 | 12924 | 1 |
| D | 0 | 18988 | 1 |
| Mode M9 | |||
|---|---|---|---|
| Quadrant | BADHDUFLAG | Total packets | Discarded packets |
| A | 0 | 12 | 0 |
| B | 0 | 12 | 0 |
| C | 0 | 12 | 0 |
| D | 0 | 12 | 0 |
| Mode SS | |||
|---|---|---|---|
| Quadrant | BADHDUFLAG | Total packets | Discarded packets |
| A | 0 | 124 | 0 |
| B | 0 | 124 | 0 |
| C | 0 | 124 | 0 |
| D | 0 | 124 | 0 |
| Quadrant | Total seconds | Saturated seconds | Saturation percentage |
|---|---|---|---|
| A | 6119 | 52 | 0.849812% |
| B | 6120 | 44 | 0.718954% |
| C | 6120 | 85 | 1.388889% |
| D | 6120 | 507 | 8.284314% |
Noise dominated data is calculated using 1-second bins in cleaned event files. If a bin has >2000 counts, and if more than 50% of those come from <1% of pixels, then it is considered to be noise-dominated and hence unusable.
| Quadrant | # 1 sec bins | Bins with >0 counts | Bins with >2000 counts | High rate bins dominated by noise | Noise dominated (total time) | Noise dominated (detector-on time) | Marked lightcurve |
|---|---|---|---|---|---|---|---|
| A | 7254 | 6120 | 0 | 0 | 0.00% | 0.00% | 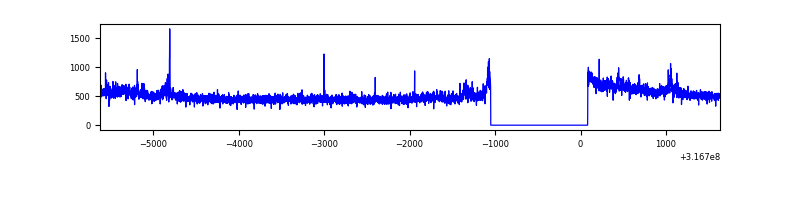 |
| B | 7255 | 6120 | 1 | 1 | 0.01% | 0.02% | 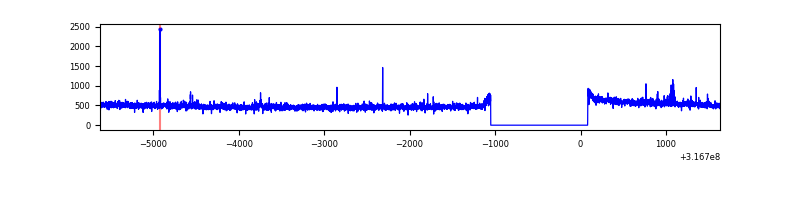 |
| C | 7255 | 6121 | 2 | 2 | 0.03% | 0.03% | 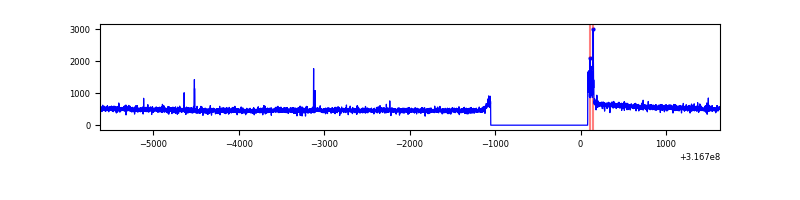 |
| D | 7255 | 6121 | 437 | 437 | 6.02% | 7.14% | 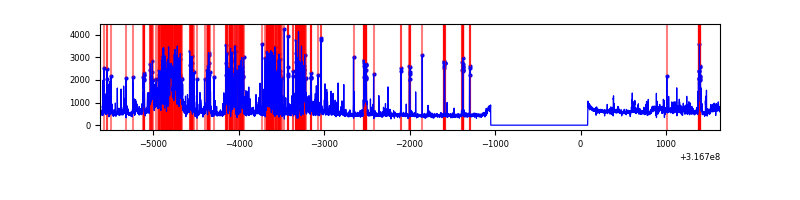 |
Top three noisy pixels from each quadrant. If the there are fewer than three noisy pixels in the level2.evt file, extra rows are filled as -1
| Pixel properties | Quadrant properties | ||||||
|---|---|---|---|---|---|---|---|
| Quadrant | DetID | PixID | Counts | Sigma | Mean | Median | Sigma |
| A | 13 | 252 | 159958 | 1017.38 | 775 | 759 | 156.5 |
| A | 13 | 254 | 9794 | 57.74 | 775 | 759 | 156.5 |
| A | 0 | 226 | 6818 | 38.72 | 775 | 759 | 156.5 |
| B | 0 | 190 | 34532 | 234.25 | 765 | 748 | 144.2 |
| B | 12 | 111 | 16674 | 110.43 | 765 | 748 | 144.2 |
| B | 11 | 111 | 15067 | 99.28 | 765 | 748 | 144.2 |
| C | 14 | 238 | 118294 | 683.91 | 739 | 743 | 171.9 |
| C | 0 | 10 | 54762 | 314.28 | 739 | 743 | 171.9 |
| C | 7 | 247 | 15200 | 84.11 | 739 | 743 | 171.9 |
| D | 1 | 52 | 682815 | 3787.93 | 736 | 715 | 180.1 |
| D | 12 | 233 | 605708 | 3359.73 | 736 | 715 | 180.1 |
| D | 2 | 82 | 536773 | 2976.91 | 736 | 715 | 180.1 |
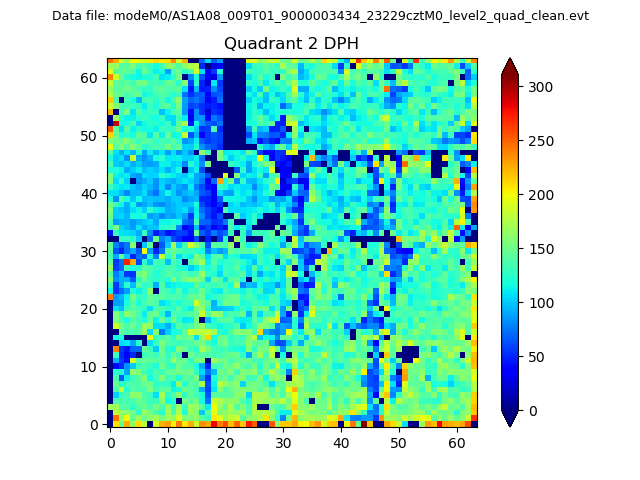
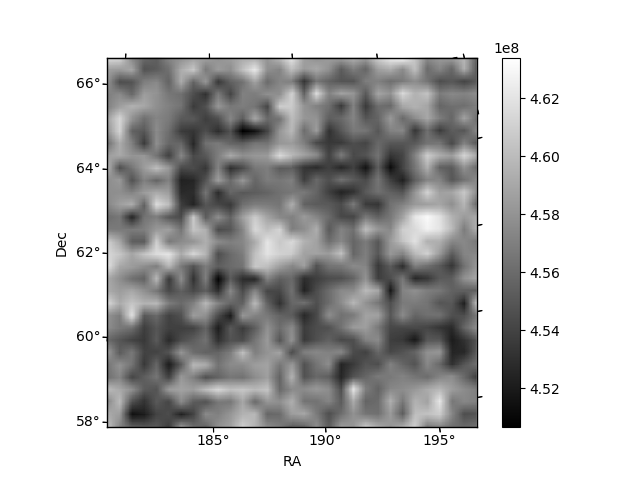
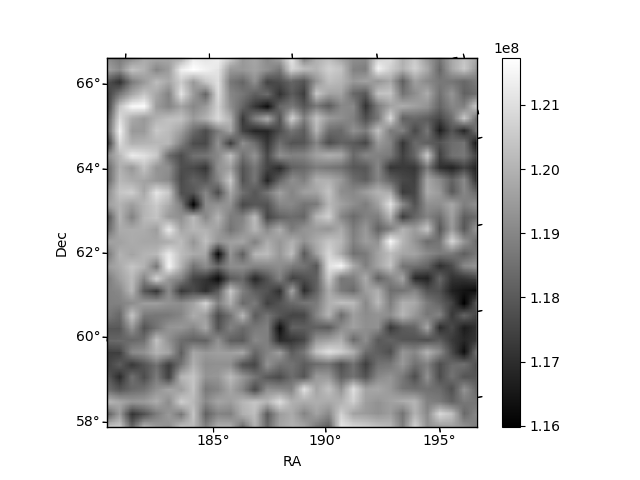
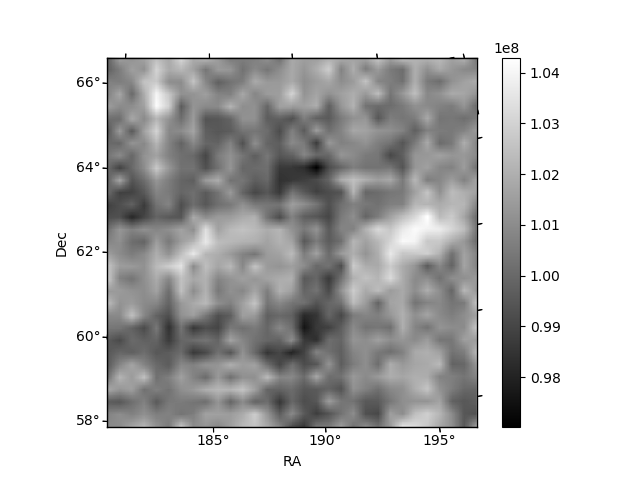
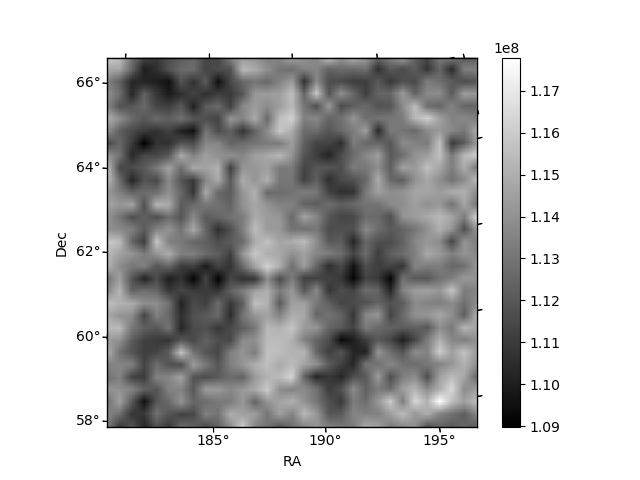
Histogram calculated using DETX and DETY for each event in the final _common_clean file
| Quadrant A | 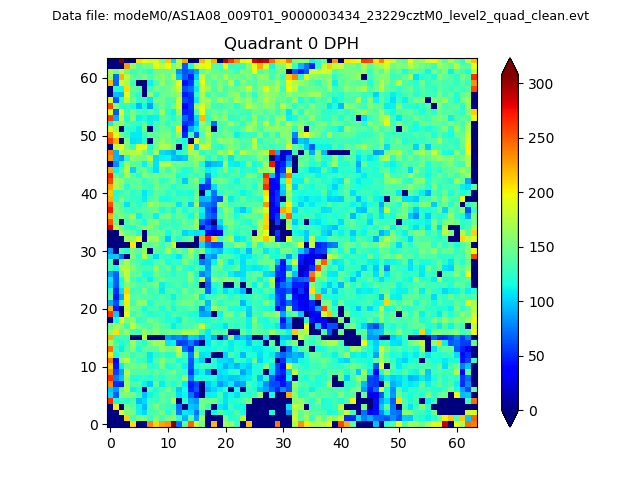 |
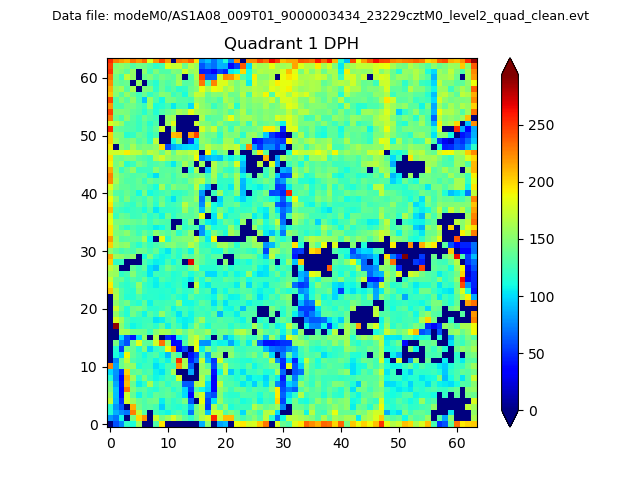 |
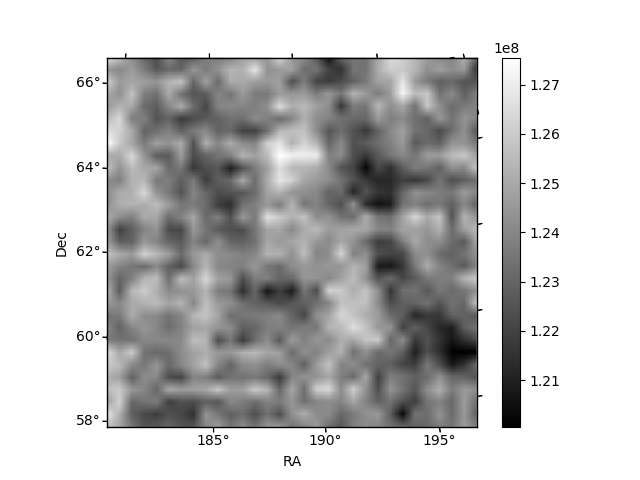
Quadrant B |
|---|---|---|---|
| Quadrant D | 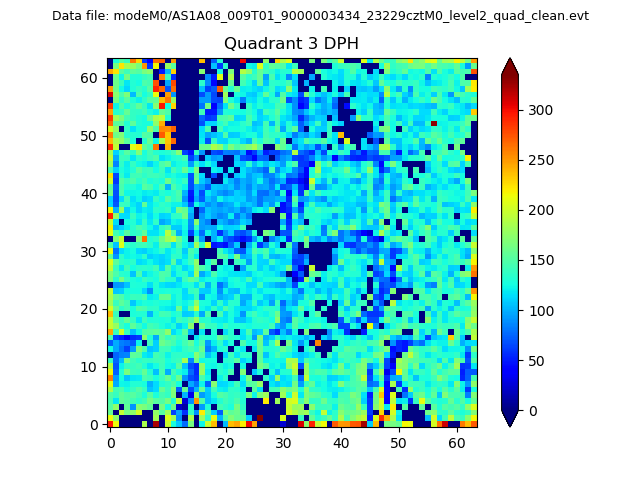 |
 |
Quadrant C |
| Plot type | Count rate plots | Images |
|---|---|---|
| Comparison with Poisson distribution Blue bars denote a histogram of data divided into 1 sec bins. Red curve is a Poisson curve with rate = median count rate of data. |
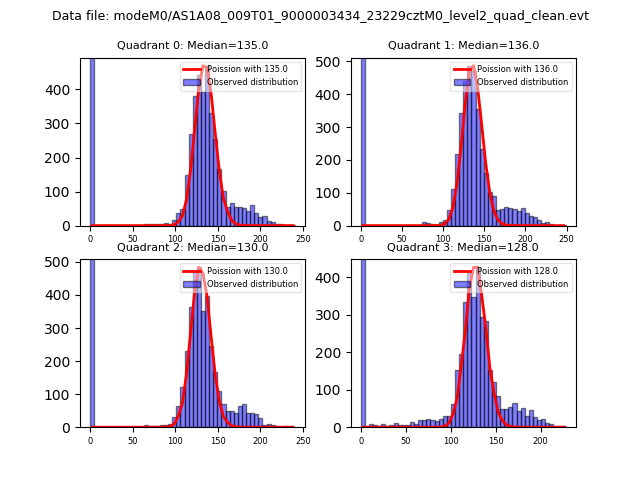 |
 |
| Quadrant-wise count rates Data is divided into 100 sec bins |
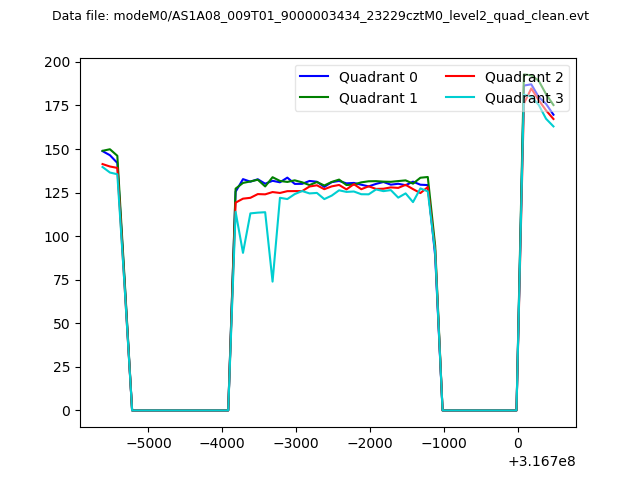 |
|
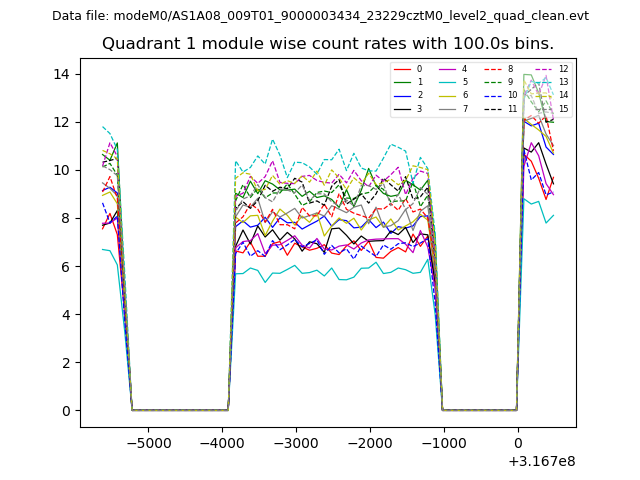
| Module-wise count rates for Quadrant A Data is divided into 100 sec bins |
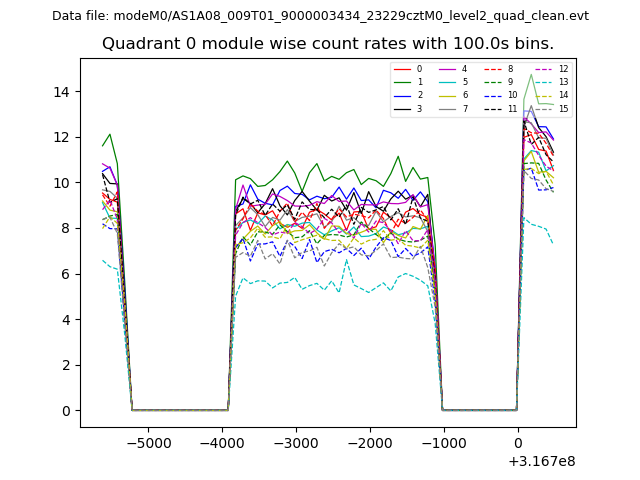 |
 |
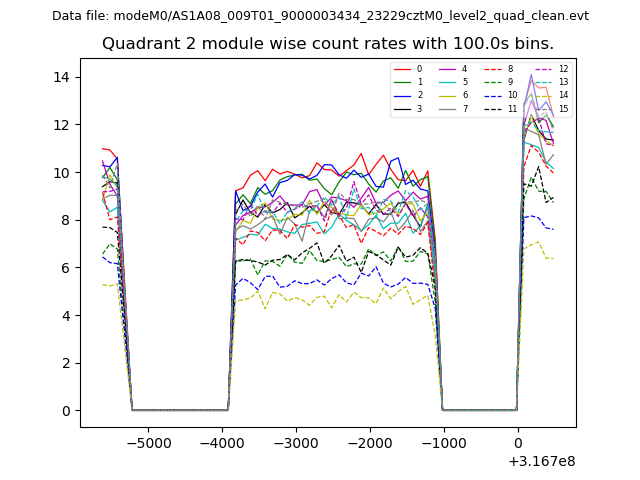
| Module-wise count rates for Quadrant B Data is divided into 100 sec bins |
 |
 |
| Module-wise count rates for Quadrant C Data is divided into 100 sec bins |
 |
 |
| Module-wise count rates for Quadrant D Data is divided into 100 sec bins |
 |
 |
| Parameter | Plot |
|---|---|
| CZT HV Monitor |  |
| D_VDD | 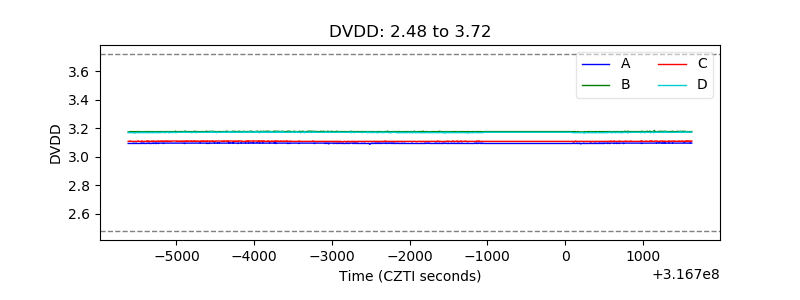 |
| Temperature 1 | 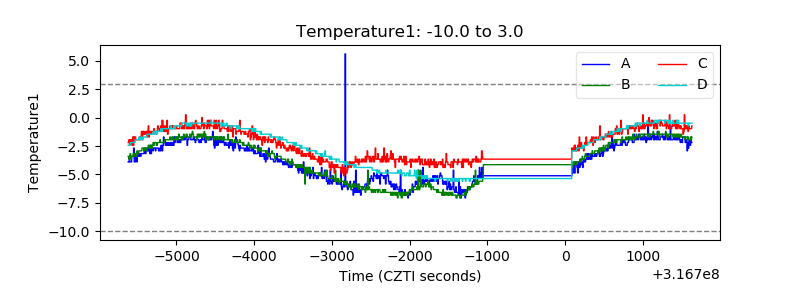 |
| Veto HV Monitor | 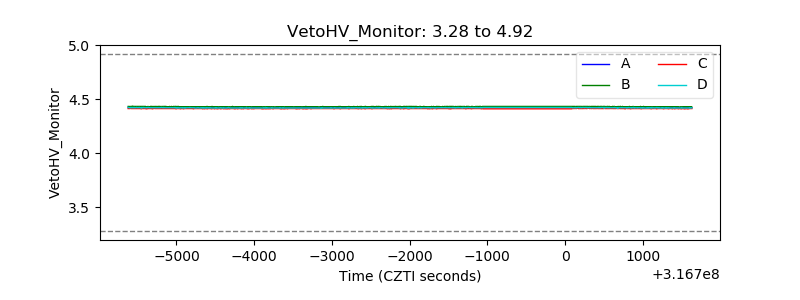 |
| Veto LLD | 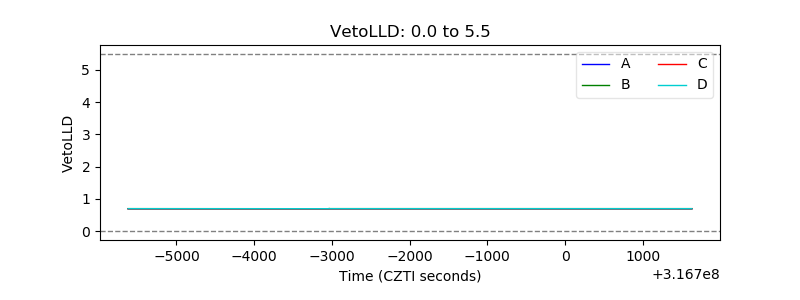 |
| Alpha Counter | 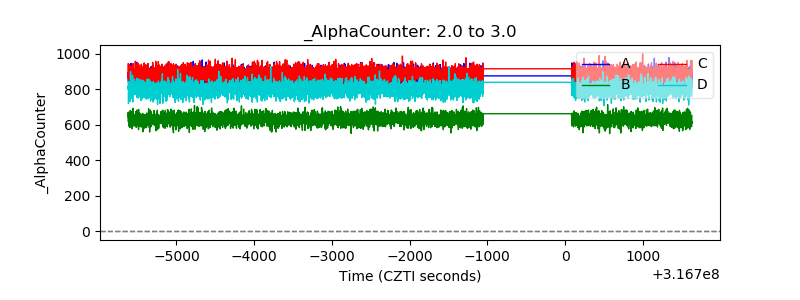 |
| _CPM_Rate | 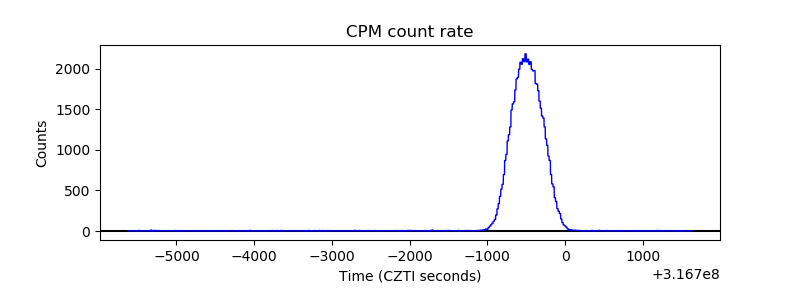 |
| CZT Counter | 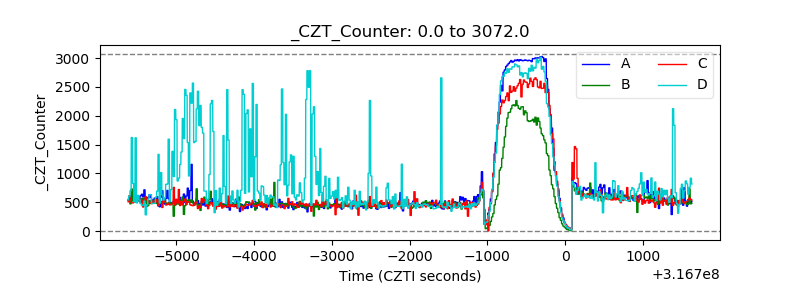 |
| +2.5 Volts monitor |  |
| +5 Volts monitor |  |
| _ROLL_ROT | 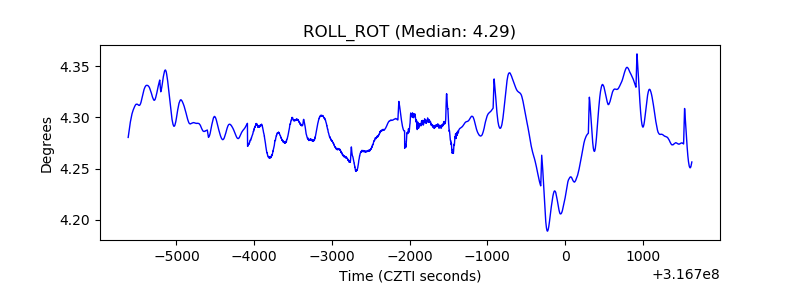 |
| _Roll_DEC | 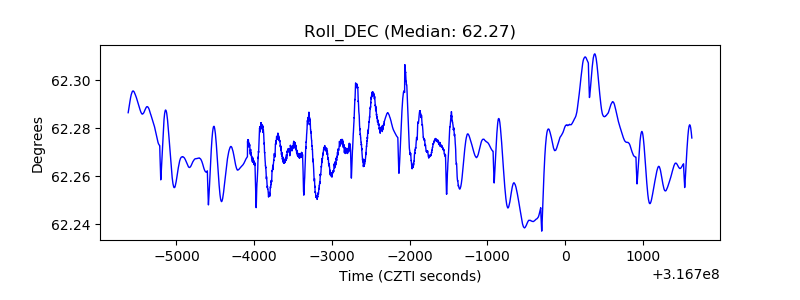 |
| _Roll_RA | 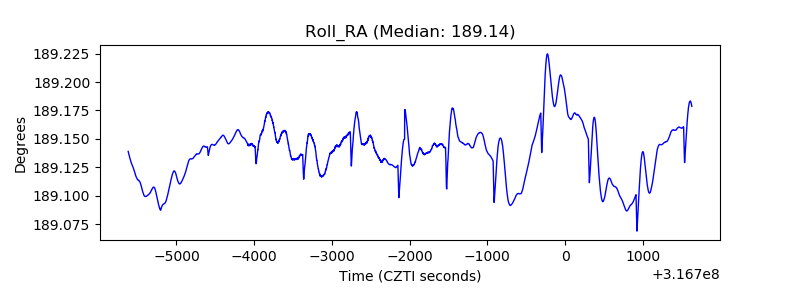 |
| Veto Counter | 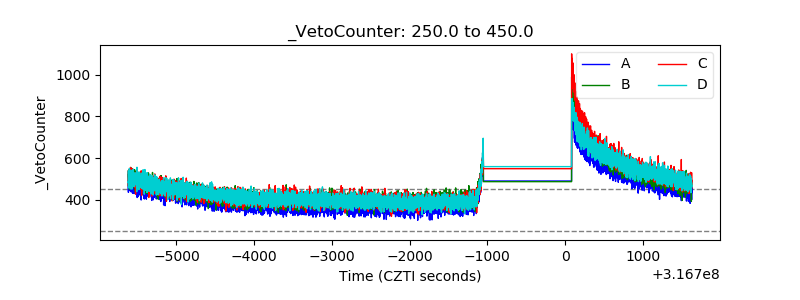 |