| Param | Original file | Final file |
|---|---|---|
| Filename | modeM0/AS1A08_009T01_9000003434_23231cztM0_level2.evt | modeM0/AS1A08_009T01_9000003434_23231cztM0_level2_quad_clean.evt |
| Size (bytes) | 506,064,960 | 87,828,480 |
| Size | 482.6 MB | 83.8 MB |
| Events in quadrant A | 3,498,529 | 559,848 |
| Events in quadrant B | 3,630,797 | 567,769 |
| Events in quadrant C | 3,692,950 | 546,122 |
| Events in quadrant D | 4,067,941 | 537,767 |
| Mode M0 | |||
|---|---|---|---|
| Quadrant | BADHDUFLAG | Total packets | Discarded packets |
| A | 0 | 14603 | 2 |
| B | 0 | 15134 | 2 |
| C | 0 | 15223 | 2 |
| D | 0 | 16594 | 2 |
| Mode M9 | |||
|---|---|---|---|
| Quadrant | BADHDUFLAG | Total packets | Discarded packets |
| A | 0 | 13 | 0 |
| B | 0 | 14 | 0 |
| C | 0 | 14 | 0 |
| D | 0 | 14 | 0 |
| Mode SS | |||
|---|---|---|---|
| Quadrant | BADHDUFLAG | Total packets | Discarded packets |
| A | 0 | 130 | 0 |
| B | 0 | 130 | 0 |
| C | 0 | 130 | 0 |
| D | 0 | 130 | 0 |
| Quadrant | Total seconds | Saturated seconds | Saturation percentage |
|---|---|---|---|
| A | 6427 | 108 | 1.680411% |
| B | 6427 | 117 | 1.820445% |
| C | 6427 | 192 | 2.987397% |
| D | 6427 | 182 | 2.831803% |
Noise dominated data is calculated using 1-second bins in cleaned event files. If a bin has >2000 counts, and if more than 50% of those come from <1% of pixels, then it is considered to be noise-dominated and hence unusable.
| Quadrant | # 1 sec bins | Bins with >0 counts | Bins with >2000 counts | High rate bins dominated by noise | Noise dominated (total time) | Noise dominated (detector-on time) | Marked lightcurve |
|---|---|---|---|---|---|---|---|
| A | 7697 | 6427 | 0 | 0 | 0.00% | 0.00% | 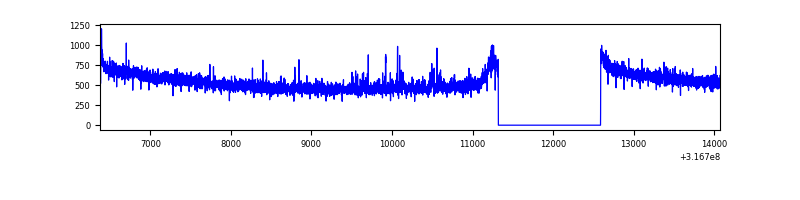 |
| B | 7697 | 6427 | 1 | 1 | 0.01% | 0.02% | 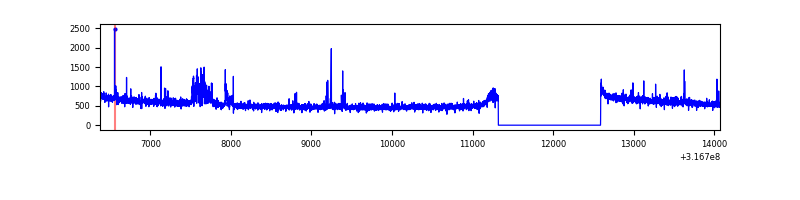 |
| C | 7697 | 6427 | 15 | 15 | 0.19% | 0.23% | 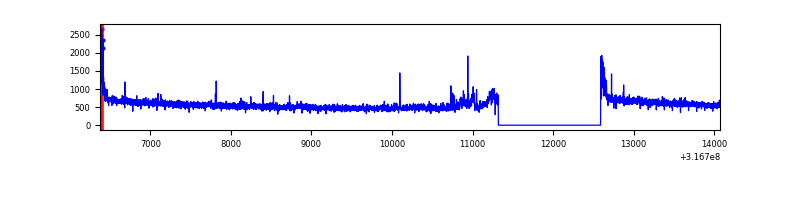 |
| D | 7697 | 6427 | 72 | 72 | 0.94% | 1.12% | 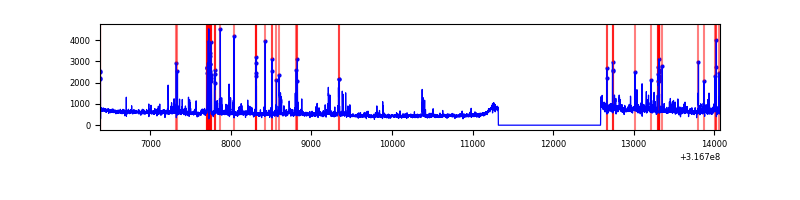 |
Top three noisy pixels from each quadrant. If the there are fewer than three noisy pixels in the level2.evt file, extra rows are filled as -1
| Pixel properties | Quadrant properties | ||||||
|---|---|---|---|---|---|---|---|
| Quadrant | DetID | PixID | Counts | Sigma | Mean | Median | Sigma |
| A | 13 | 252 | 40445 | 224.51 | 891 | 875 | 176.2 |
| A | 6 | 16 | 25019 | 136.99 | 891 | 875 | 176.2 |
| A | 13 | 254 | 10315 | 53.56 | 891 | 875 | 176.2 |
| B | 0 | 190 | 113960 | 696.13 | 885 | 866 | 162.5 |
| B | 0 | 229 | 33966 | 203.74 | 885 | 866 | 162.5 |
| B | 12 | 111 | 18012 | 105.54 | 885 | 866 | 162.5 |
| C | 14 | 238 | 138569 | 702.7 | 859 | 867 | 196.0 |
| C | 0 | 10 | 129676 | 657.32 | 859 | 867 | 196.0 |
| C | 10 | 9 | 69079 | 348.09 | 859 | 867 | 196.0 |
| D | 2 | 82 | 233202 | 1109.34 | 875 | 852 | 209.4 |
| D | 1 | 52 | 153944 | 730.93 | 875 | 852 | 209.4 |
| D | 2 | 152 | 130697 | 619.94 | 875 | 852 | 209.4 |
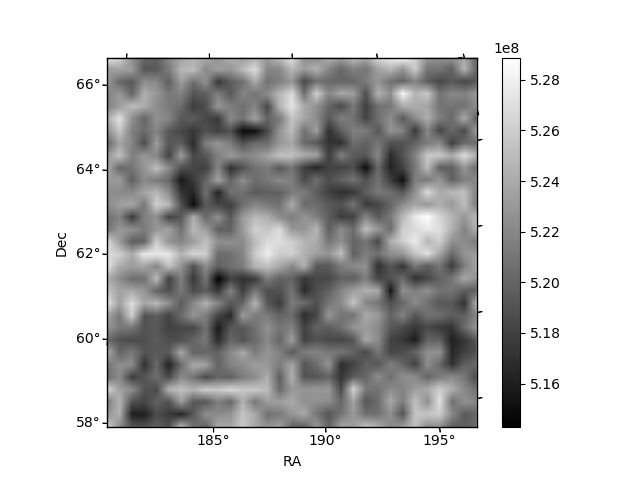
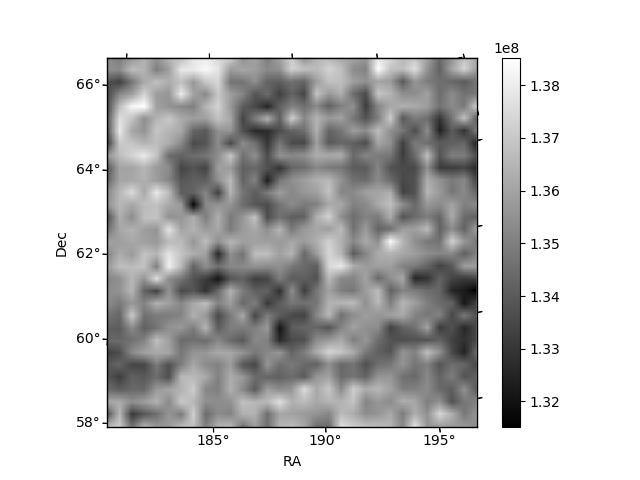
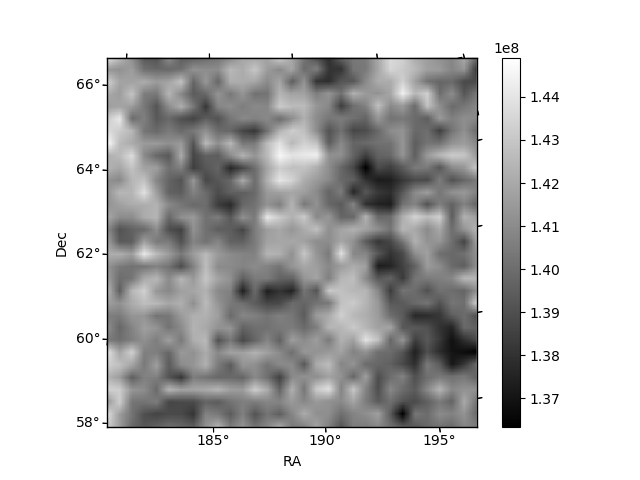
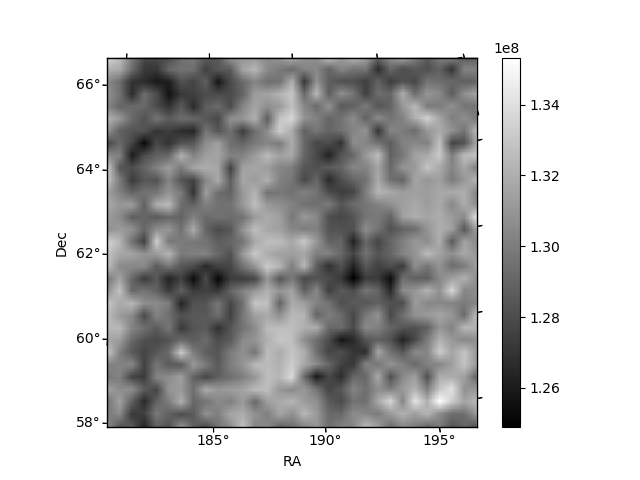
Histogram calculated using DETX and DETY for each event in the final _common_clean file
| Quadrant A | 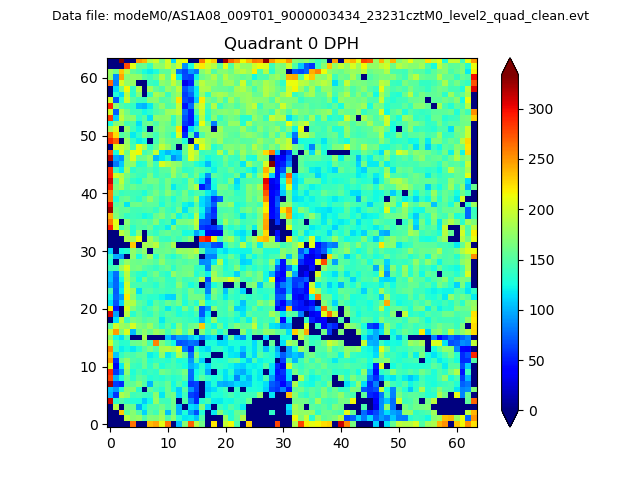 |
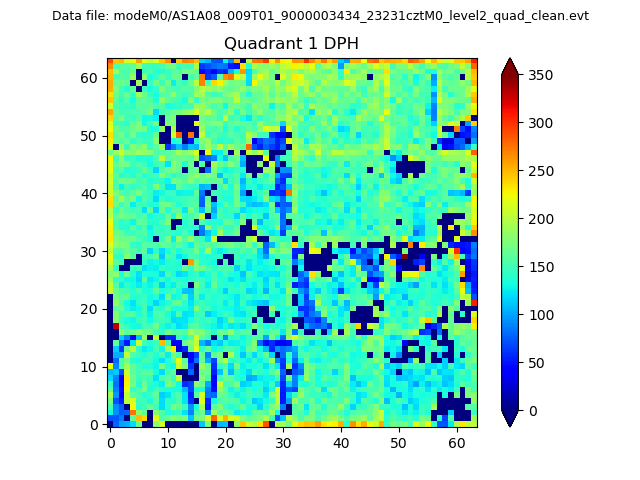 |
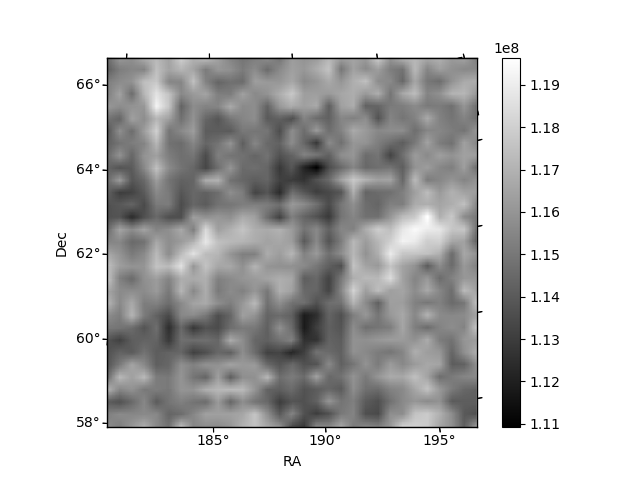
Quadrant B |
|---|---|---|---|
| Quadrant D | 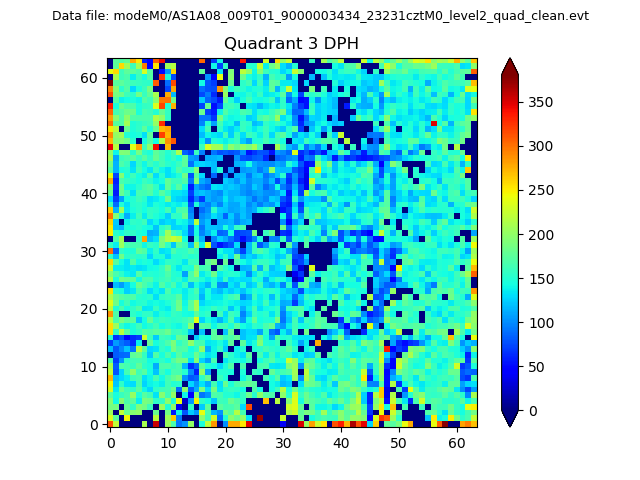 |
 |
Quadrant C |
| Plot type | Count rate plots | Images |
|---|---|---|
| Comparison with Poisson distribution Blue bars denote a histogram of data divided into 1 sec bins. Red curve is a Poisson curve with rate = median count rate of data. |
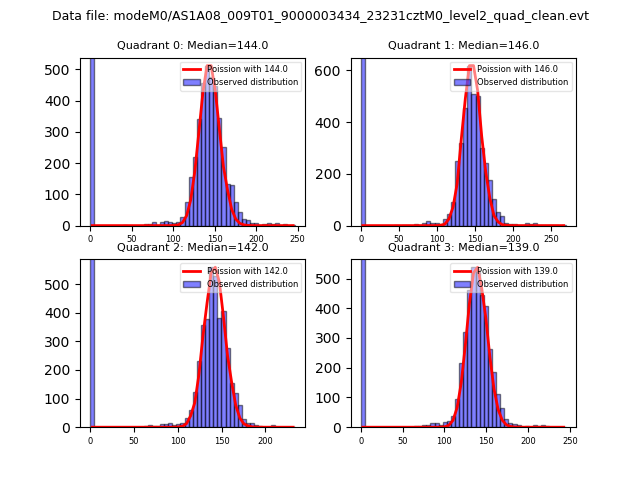 |
 |
| Quadrant-wise count rates Data is divided into 100 sec bins |
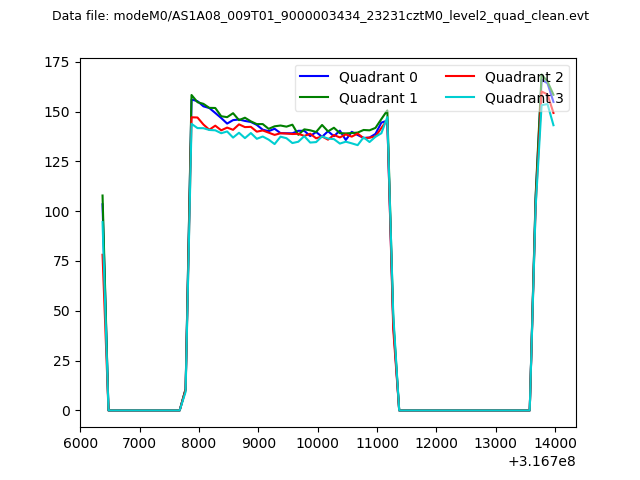 |
|
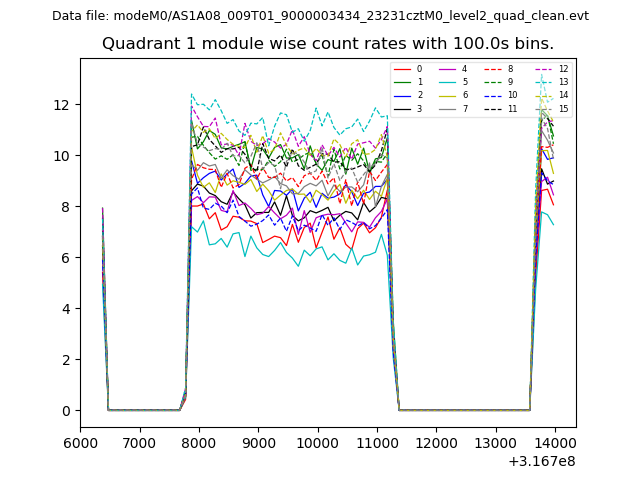
| Module-wise count rates for Quadrant A Data is divided into 100 sec bins |
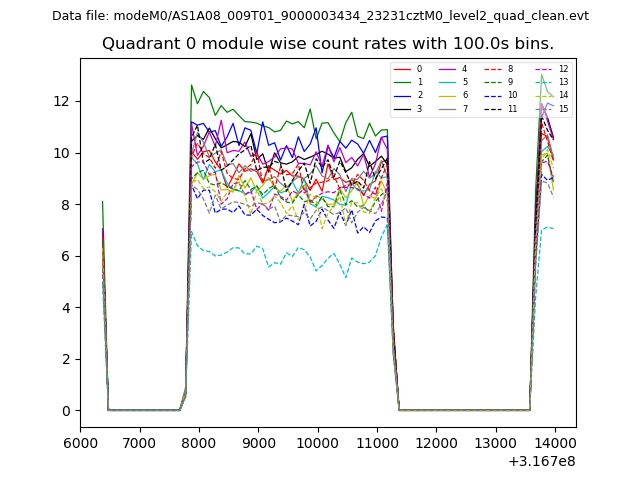 |
 |
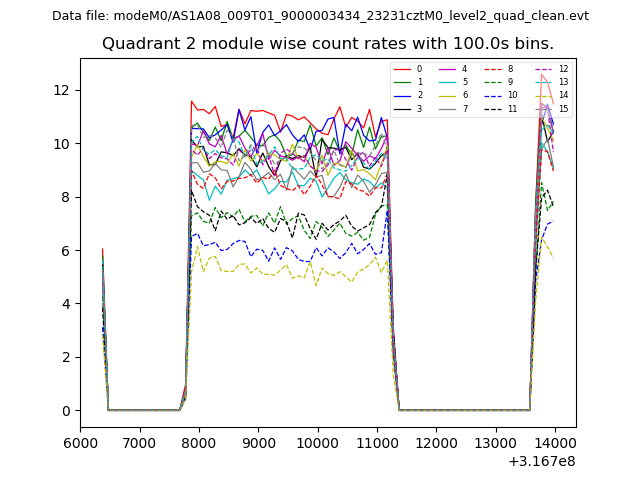
| Module-wise count rates for Quadrant B Data is divided into 100 sec bins |
 |
 |
| Module-wise count rates for Quadrant C Data is divided into 100 sec bins |
 |
 |
| Module-wise count rates for Quadrant D Data is divided into 100 sec bins |
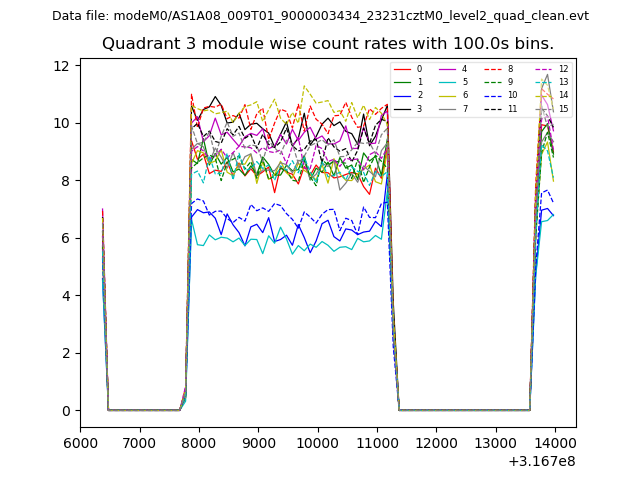 |
 |
| Parameter | Plot |
|---|---|
| CZT HV Monitor | 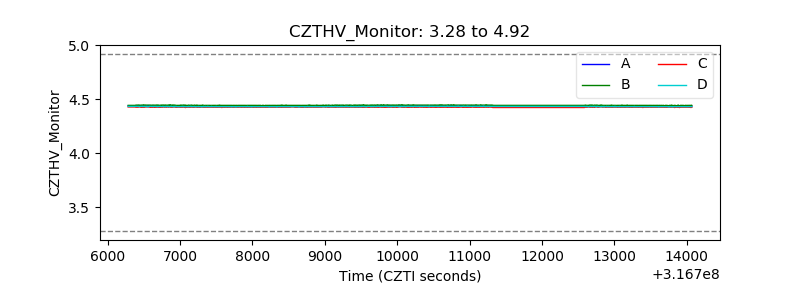 |
| D_VDD | 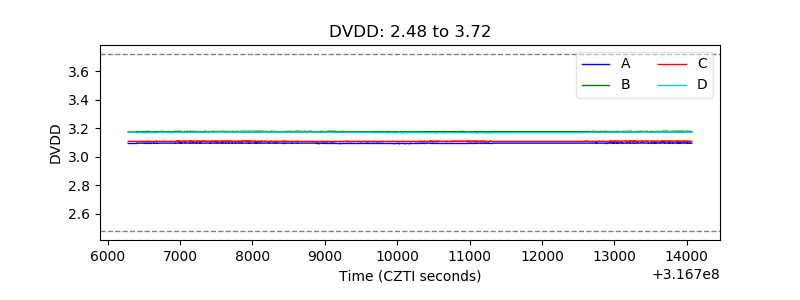 |
| Temperature 1 | 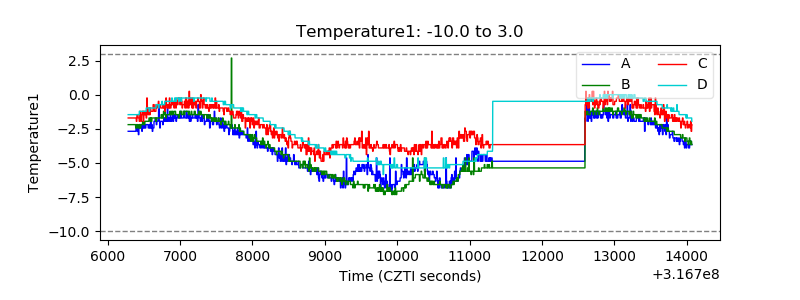 |
| Veto HV Monitor | 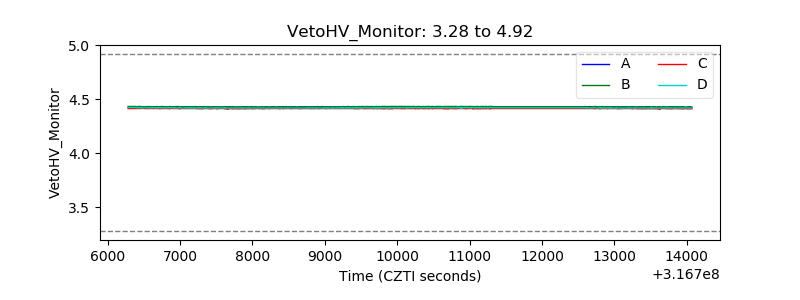 |
| Veto LLD | 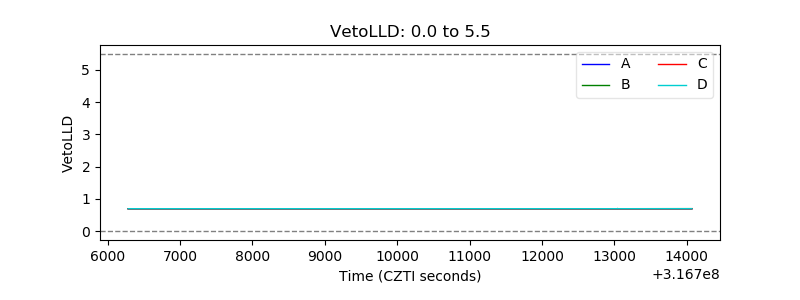 |
| Alpha Counter | 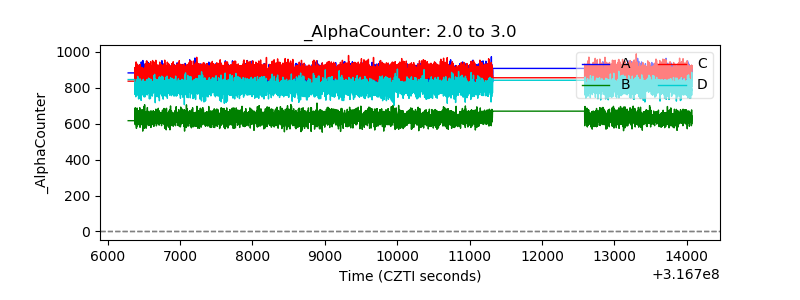 |
| _CPM_Rate | 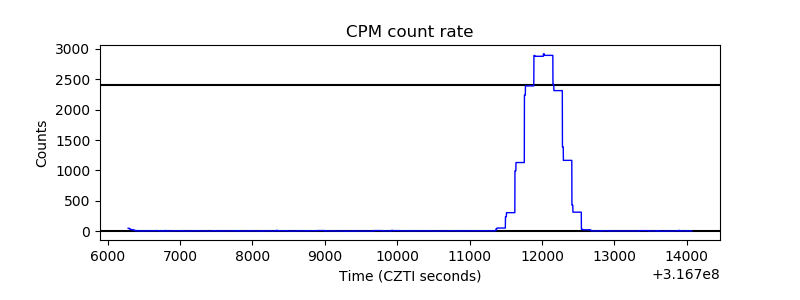 |
| CZT Counter | 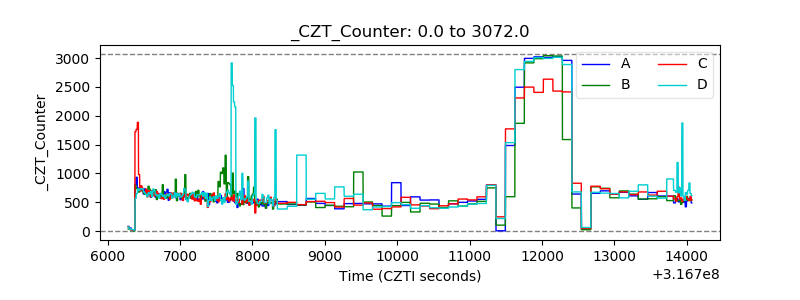 |
| +2.5 Volts monitor | 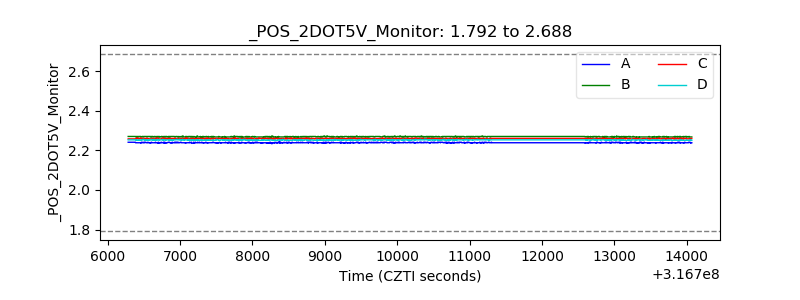 |
| +5 Volts monitor |  |
| _ROLL_ROT | 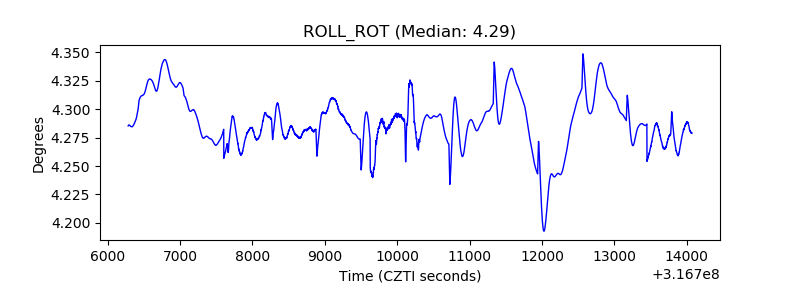 |
| _Roll_DEC | 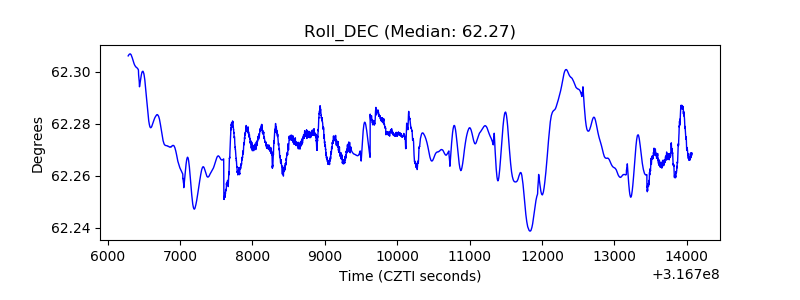 |
| _Roll_RA | 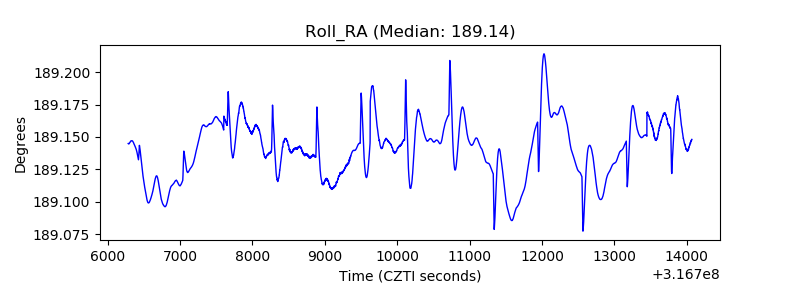 |
| Veto Counter | 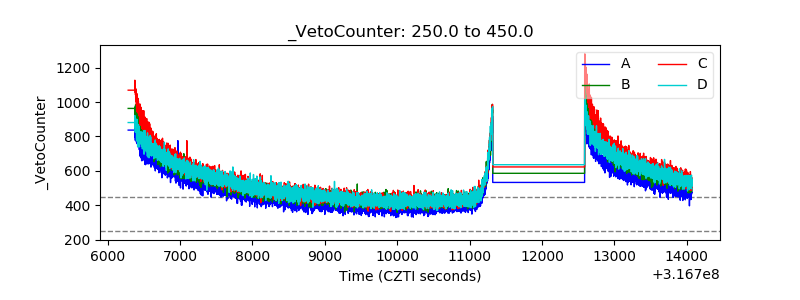 |