| Param | Original file | Final file |
|---|---|---|
| Filename | modeM0/AS1A08_009T01_9000003434_23232cztM0_level2.evt | modeM0/AS1A08_009T01_9000003434_23232cztM0_level2_quad_clean.evt |
| Size (bytes) | 448,980,480 | 98,890,560 |
| Size | 428.2 MB | 94.3 MB |
| Events in quadrant A | 3,086,077 | 655,196 |
| Events in quadrant B | 3,005,906 | 668,534 |
| Events in quadrant C | 3,121,505 | 649,039 |
| Events in quadrant D | 3,999,504 | 626,315 |
| Mode M0 | |||
|---|---|---|---|
| Quadrant | BADHDUFLAG | Total packets | Discarded packets |
| A | 0 | 12695 | 1 |
| B | 0 | 12503 | 1 |
| C | 0 | 12867 | 1 |
| D | 0 | 15845 | 1 |
| Mode M9 | |||
|---|---|---|---|
| Quadrant | BADHDUFLAG | Total packets | Discarded packets |
| A | 0 | 13 | 0 |
| B | 0 | 13 | 0 |
| C | 0 | 13 | 0 |
| D | 0 | 13 | 0 |
| Mode SS | |||
|---|---|---|---|
| Quadrant | BADHDUFLAG | Total packets | Discarded packets |
| A | 0 | 116 | 0 |
| B | 0 | 116 | 0 |
| C | 0 | 116 | 0 |
| D | 0 | 116 | 0 |
| Quadrant | Total seconds | Saturated seconds | Saturation percentage |
|---|---|---|---|
| A | 5656 | 110 | 1.944837% |
| B | 5657 | 106 | 1.873785% |
| C | 5657 | 182 | 3.217253% |
| D | 5657 | 188 | 3.323316% |
Noise dominated data is calculated using 1-second bins in cleaned event files. If a bin has >2000 counts, and if more than 50% of those come from <1% of pixels, then it is considered to be noise-dominated and hence unusable.
| Quadrant | # 1 sec bins | Bins with >0 counts | Bins with >2000 counts | High rate bins dominated by noise | Noise dominated (total time) | Noise dominated (detector-on time) | Marked lightcurve |
|---|---|---|---|---|---|---|---|
| A | 7001 | 5656 | 13 | 13 | 0.19% | 0.23% |  |
| B | 7002 | 5657 | 5 | 5 | 0.07% | 0.09% |  |
| C | 7002 | 5657 | 30 | 30 | 0.43% | 0.53% |  |
| D | 7002 | 5657 | 90 | 90 | 1.29% | 1.59% | 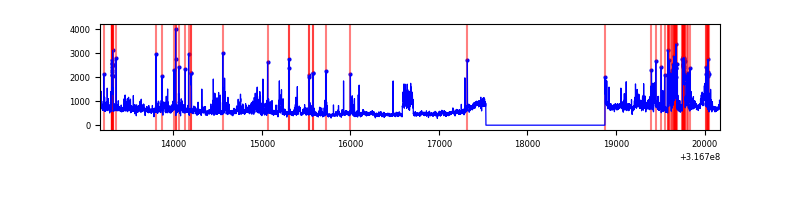 |
Top three noisy pixels from each quadrant. If the there are fewer than three noisy pixels in the level2.evt file, extra rows are filled as -1
| Pixel properties | Quadrant properties | ||||||
|---|---|---|---|---|---|---|---|
| Quadrant | DetID | PixID | Counts | Sigma | Mean | Median | Sigma |
| A | 13 | 252 | 99551 | 657.23 | 754 | 739 | 150.3 |
| A | 6 | 16 | 78600 | 517.88 | 754 | 739 | 150.3 |
| A | 13 | 254 | 9584 | 58.83 | 754 | 739 | 150.3 |
| B | 0 | 228 | 17491 | 120.51 | 755 | 739 | 139.0 |
| B | 12 | 111 | 15511 | 106.27 | 755 | 739 | 139.0 |
| B | 5 | 172 | 14984 | 102.48 | 755 | 739 | 139.0 |
| C | 14 | 238 | 118337 | 696.38 | 736 | 744 | 168.9 |
| C | 0 | 10 | 115270 | 678.21 | 736 | 744 | 168.9 |
| C | 10 | 9 | 12006 | 66.69 | 736 | 744 | 168.9 |
| D | 1 | 52 | 450274 | 2506.31 | 743 | 722 | 179.4 |
| D | 2 | 152 | 223218 | 1240.45 | 743 | 722 | 179.4 |
| D | 7 | 238 | 178538 | 991.35 | 743 | 722 | 179.4 |
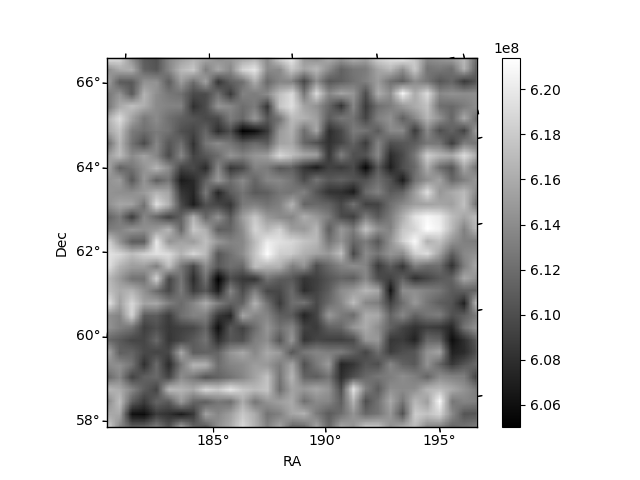
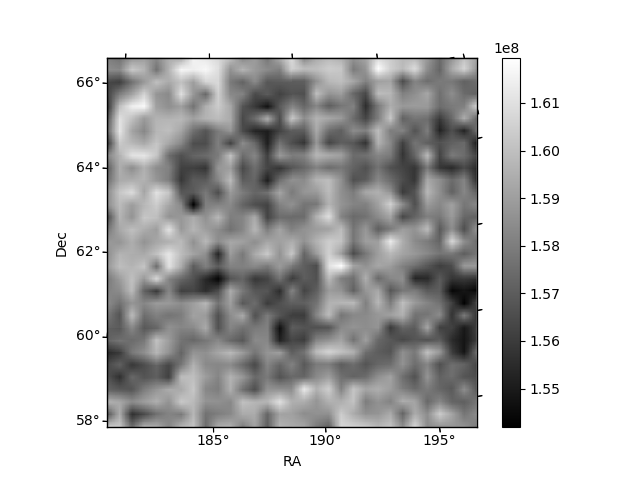
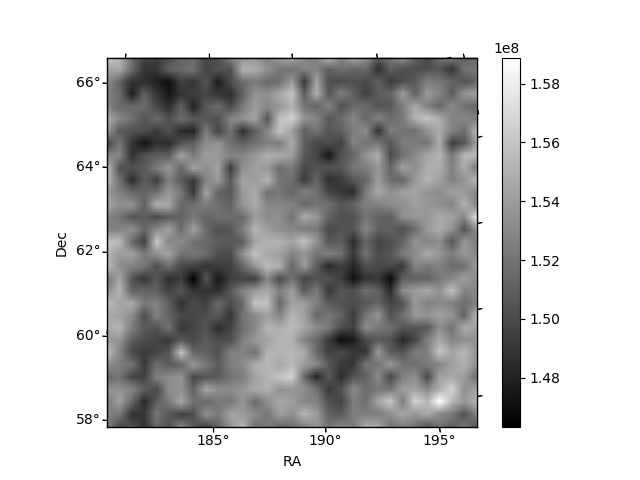
Histogram calculated using DETX and DETY for each event in the final _common_clean file
| Quadrant A | 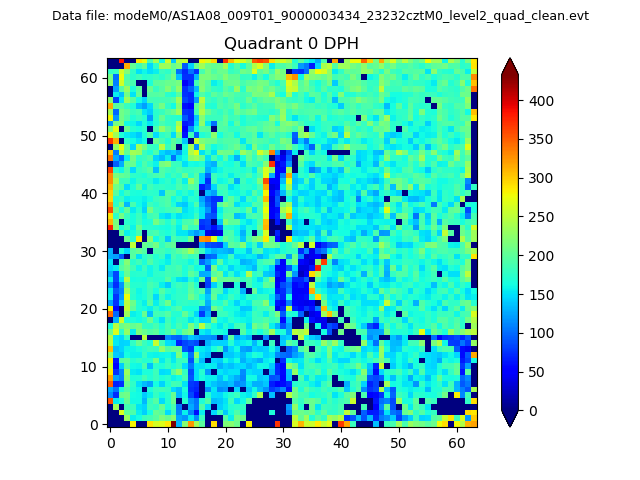 |
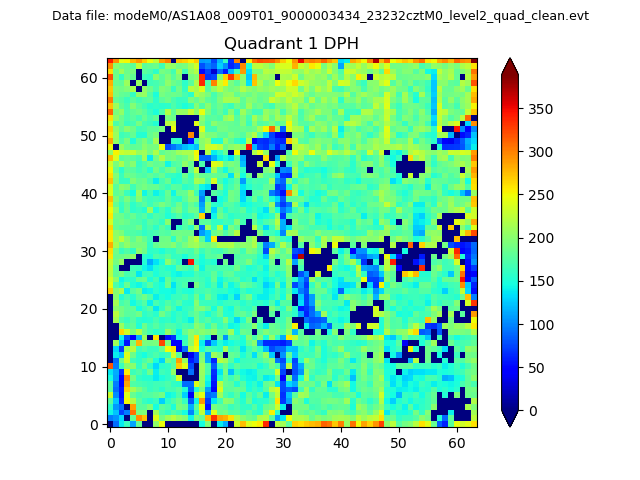 |
Quadrant B |
|---|---|---|---|
| Quadrant D | 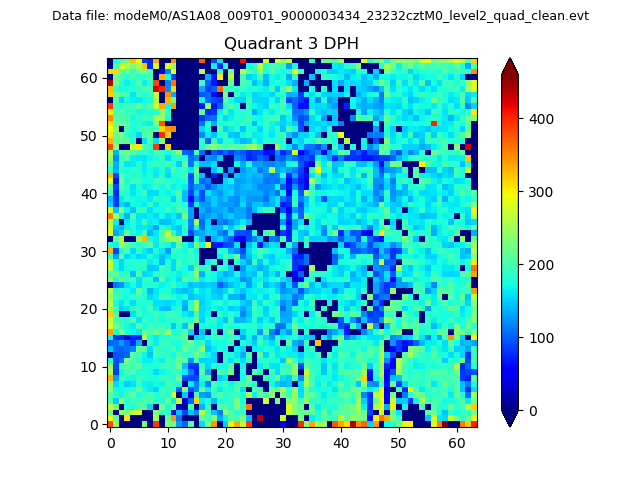 |
 |
Quadrant C |
| Plot type | Count rate plots | Images |
|---|---|---|
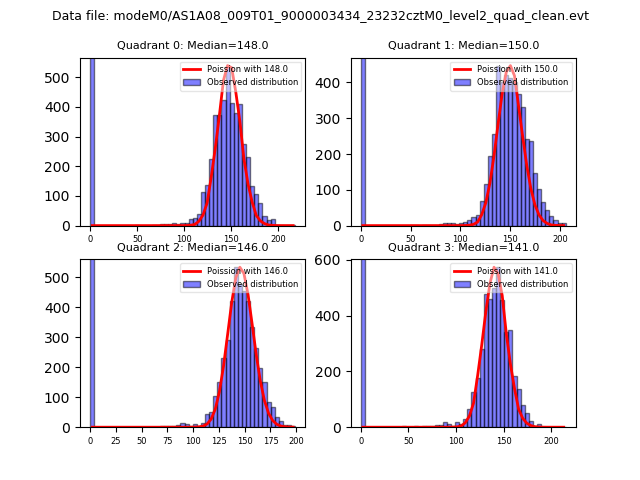
| Comparison with Poisson distribution Blue bars denote a histogram of data divided into 1 sec bins. Red curve is a Poisson curve with rate = median count rate of data. |
 |
 |
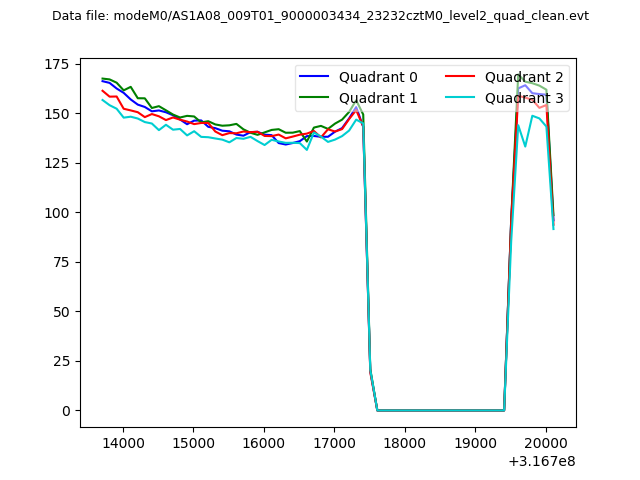
| Quadrant-wise count rates Data is divided into 100 sec bins |
 |
|
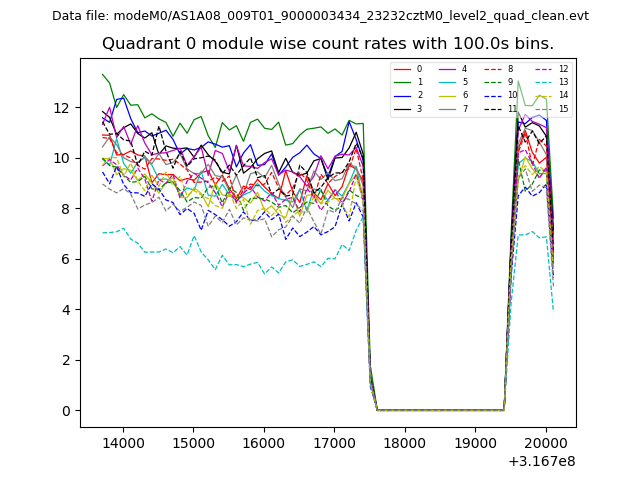
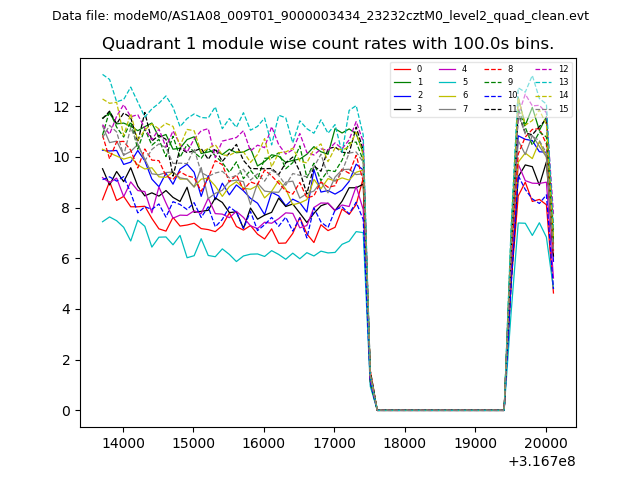
| Module-wise count rates for Quadrant A Data is divided into 100 sec bins |
 |
 |
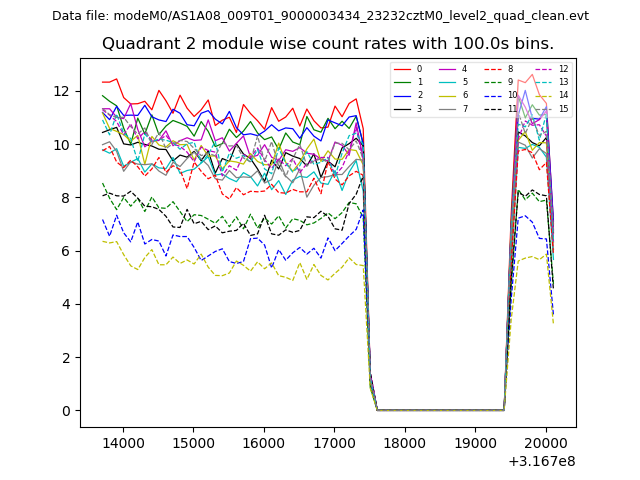
| Module-wise count rates for Quadrant B Data is divided into 100 sec bins |
 |
 |
| Module-wise count rates for Quadrant C Data is divided into 100 sec bins |
 |
 |
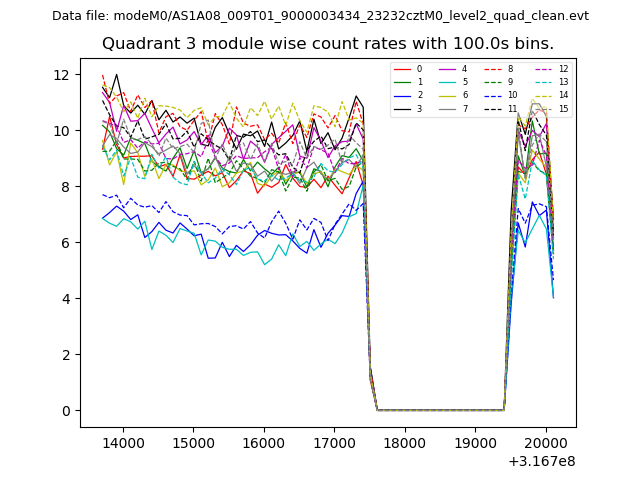
| Module-wise count rates for Quadrant D Data is divided into 100 sec bins |
 |
 |
| Parameter | Plot |
|---|---|
| CZT HV Monitor | 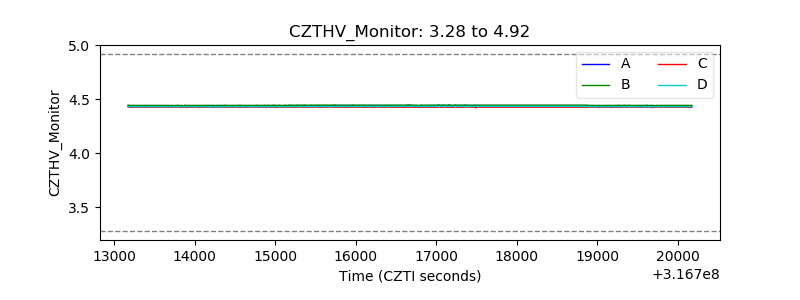 |
| D_VDD | 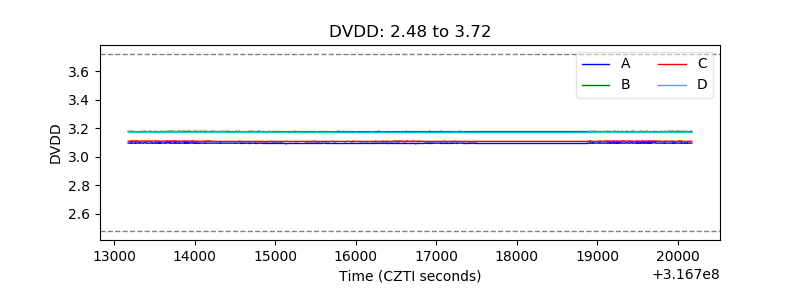 |
| Temperature 1 | 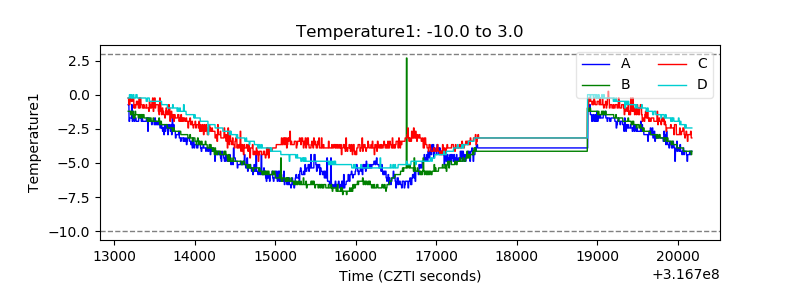 |
| Veto HV Monitor | 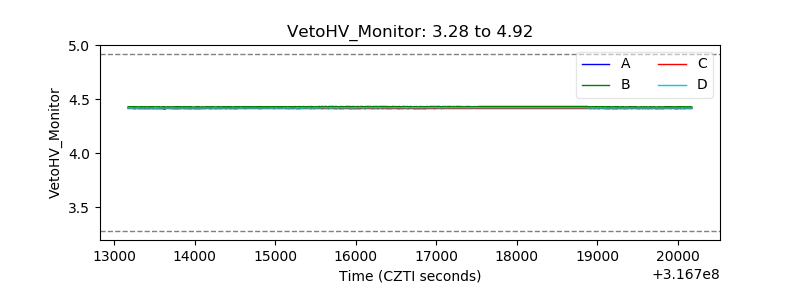 |
| Veto LLD | 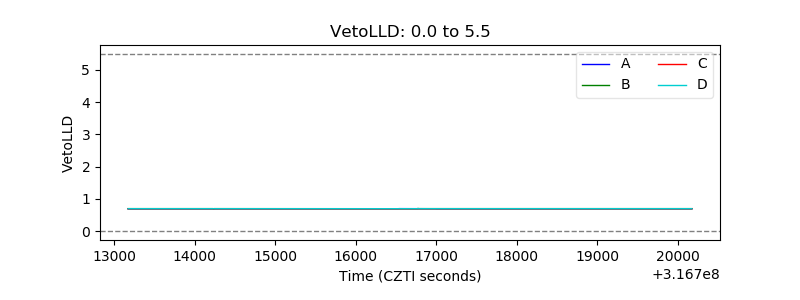 |
| Alpha Counter | 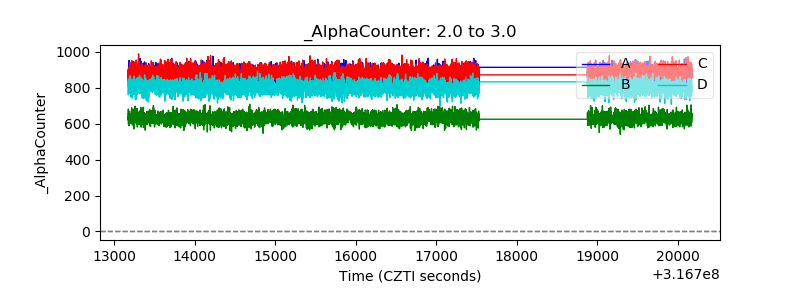 |
| _CPM_Rate | 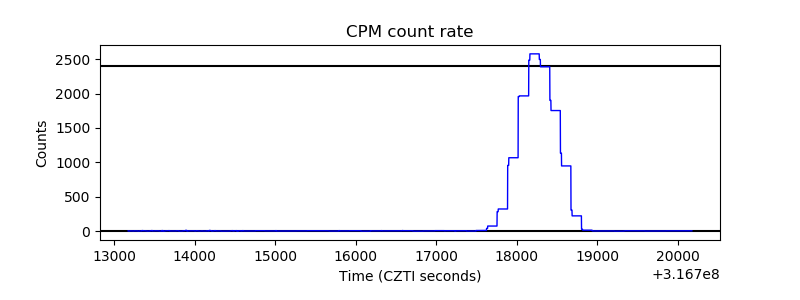 |
| CZT Counter | 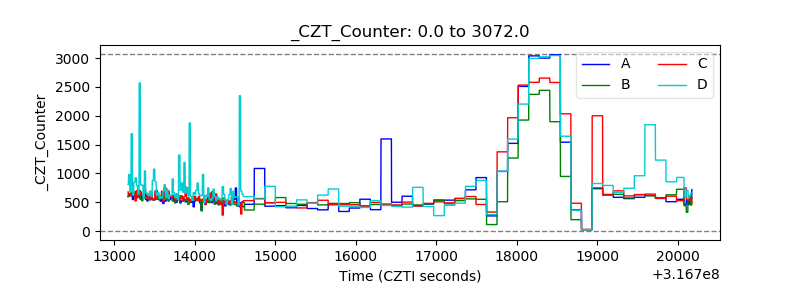 |
| +2.5 Volts monitor |  |
| +5 Volts monitor |  |
| _ROLL_ROT | 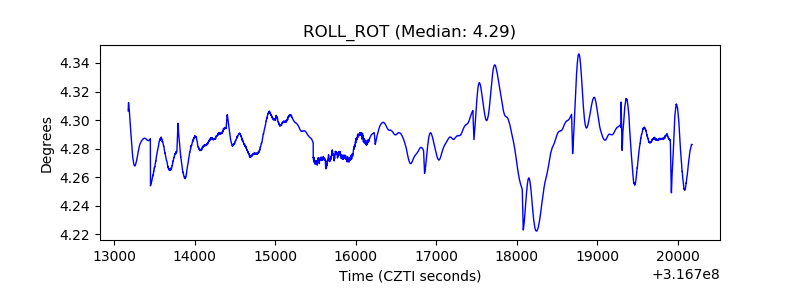 |
| _Roll_DEC | 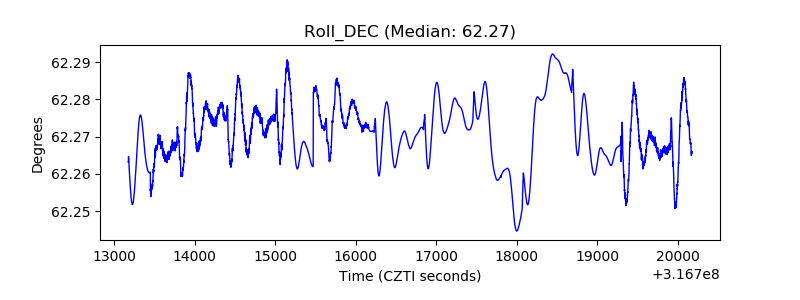 |
| _Roll_RA | 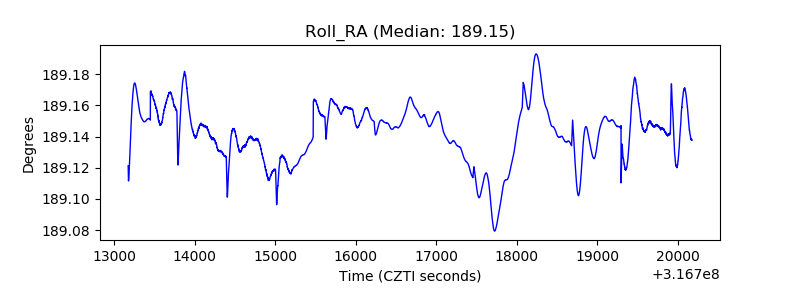 |
| Veto Counter | 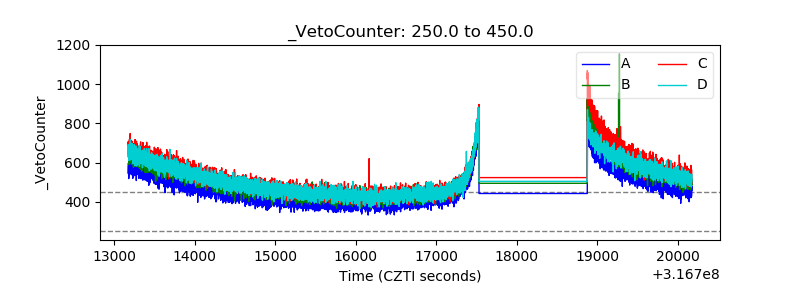 |