| Param | Original file | Final file |
|---|---|---|
| Filename | modeM0/AS1A08_009T01_9000003434_23233cztM0_level2.evt | modeM0/AS1A08_009T01_9000003434_23233cztM0_level2_quad_clean.evt |
| Size (bytes) | 463,377,600 | 113,051,520 |
| Size | 441.9 MB | 107.8 MB |
| Events in quadrant A | 2,938,542 | 758,388 |
| Events in quadrant B | 3,079,163 | 777,469 |
| Events in quadrant C | 3,135,973 | 754,382 |
| Events in quadrant D | 4,478,109 | 720,538 |
| Mode M0 | |||
|---|---|---|---|
| Quadrant | BADHDUFLAG | Total packets | Discarded packets |
| A | 0 | 12471 | 1 |
| B | 0 | 12858 | 1 |
| C | 0 | 13006 | 1 |
| D | 0 | 17506 | 1 |
| Mode M9 | |||
|---|---|---|---|
| Quadrant | BADHDUFLAG | Total packets | Discarded packets |
| A | 0 | 13 | 0 |
| B | 0 | 13 | 0 |
| C | 0 | 13 | 0 |
| D | 0 | 13 | 0 |
| Mode SS | |||
|---|---|---|---|
| Quadrant | BADHDUFLAG | Total packets | Discarded packets |
| A | 0 | 122 | 0 |
| B | 0 | 122 | 0 |
| C | 0 | 122 | 0 |
| D | 0 | 122 | 0 |
| Quadrant | Total seconds | Saturated seconds | Saturation percentage |
|---|---|---|---|
| A | 5908 | 45 | 0.761679% |
| B | 5909 | 68 | 1.150787% |
| C | 5909 | 139 | 2.352344% |
| D | 5909 | 237 | 4.010831% |
Noise dominated data is calculated using 1-second bins in cleaned event files. If a bin has >2000 counts, and if more than 50% of those come from <1% of pixels, then it is considered to be noise-dominated and hence unusable.
| Quadrant | # 1 sec bins | Bins with >0 counts | Bins with >2000 counts | High rate bins dominated by noise | Noise dominated (total time) | Noise dominated (detector-on time) | Marked lightcurve |
|---|---|---|---|---|---|---|---|
| A | 7223 | 5909 | 2 | 2 | 0.03% | 0.03% | 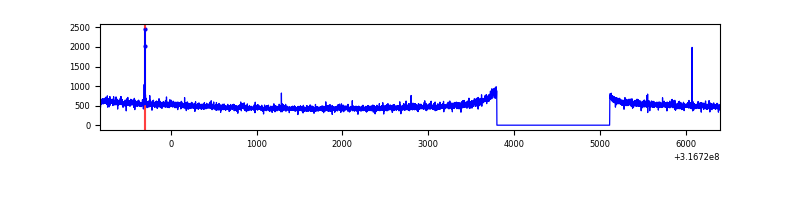 |
| B | 7224 | 5910 | 8 | 8 | 0.11% | 0.14% | 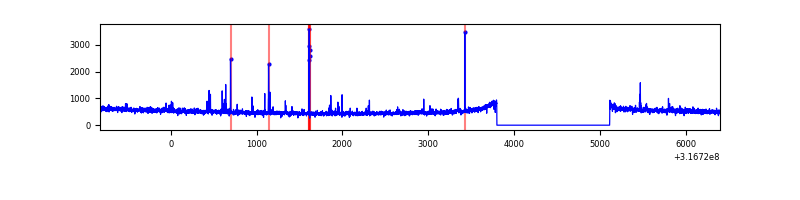 |
| C | 7224 | 5910 | 23 | 23 | 0.32% | 0.39% | 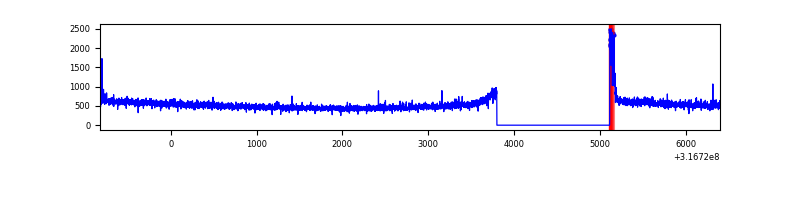 |
| D | 7224 | 5909 | 170 | 170 | 2.35% | 2.88% | 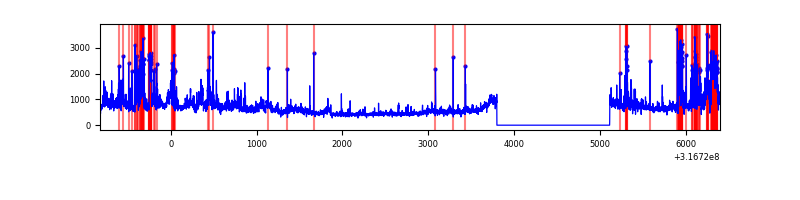 |
Top three noisy pixels from each quadrant. If the there are fewer than three noisy pixels in the level2.evt file, extra rows are filled as -1
| Pixel properties | Quadrant properties | ||||||
|---|---|---|---|---|---|---|---|
| Quadrant | DetID | PixID | Counts | Sigma | Mean | Median | Sigma |
| A | 6 | 16 | 10929 | 67.43 | 758 | 744 | 151.0 |
| A | 13 | 254 | 9876 | 60.46 | 758 | 744 | 151.0 |
| A | 0 | 226 | 6496 | 38.08 | 758 | 744 | 151.0 |
| B | 5 | 172 | 51516 | 358.71 | 762 | 744 | 141.5 |
| B | 0 | 190 | 25514 | 175.0 | 762 | 744 | 141.5 |
| B | 6 | 36 | 18190 | 123.26 | 762 | 744 | 141.5 |
| C | 14 | 238 | 120257 | 696.22 | 743 | 748 | 171.7 |
| C | 0 | 10 | 106598 | 616.65 | 743 | 748 | 171.7 |
| C | 10 | 9 | 6162 | 31.54 | 743 | 748 | 171.7 |
| D | 1 | 52 | 421963 | 2378.4 | 743 | 723 | 177.1 |
| D | 7 | 238 | 376877 | 2123.84 | 743 | 723 | 177.1 |
| D | 2 | 152 | 372001 | 2096.31 | 743 | 723 | 177.1 |
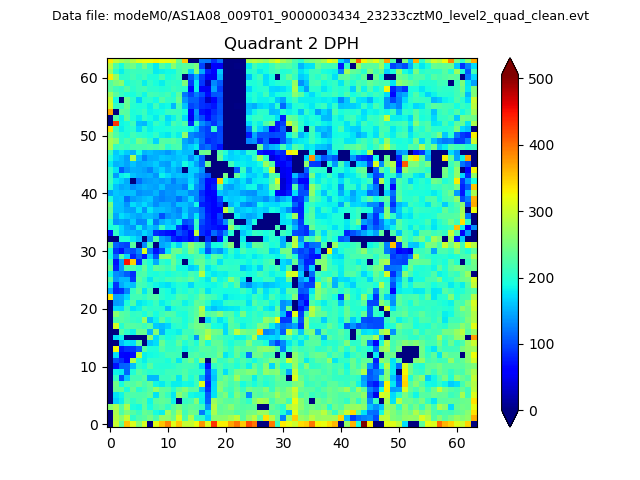
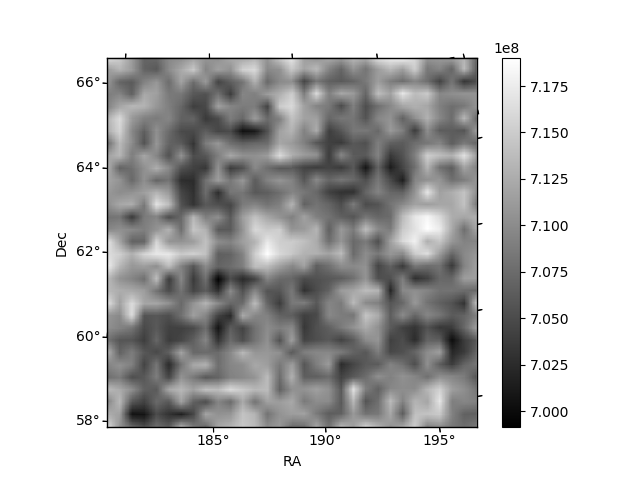
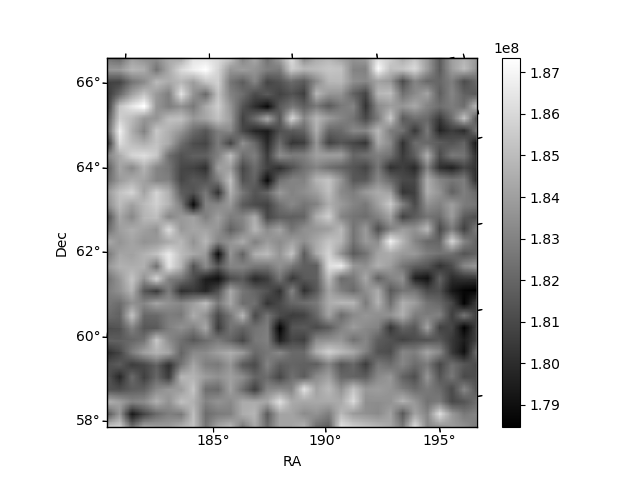
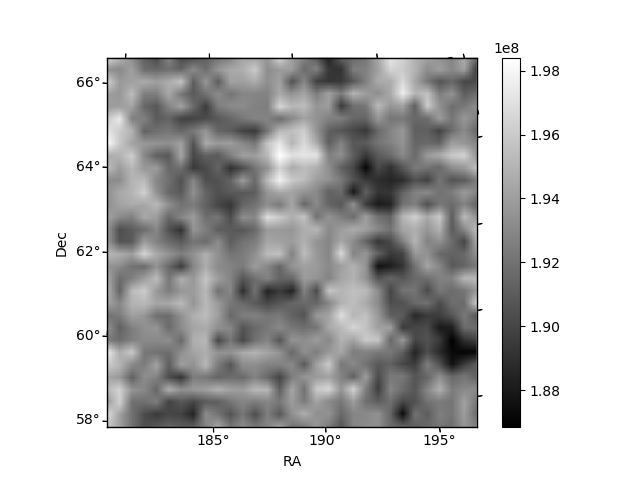
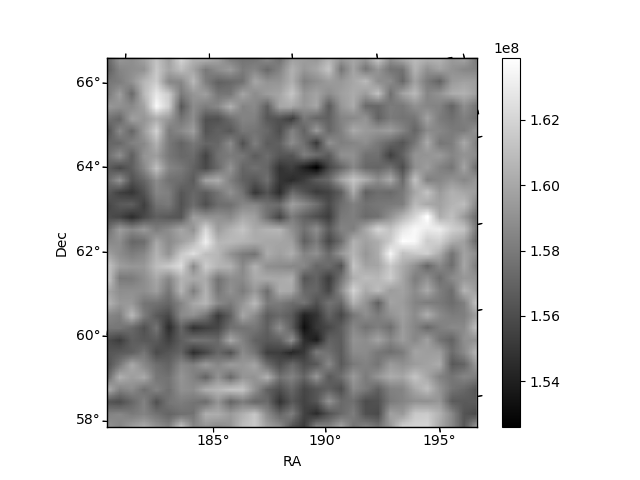
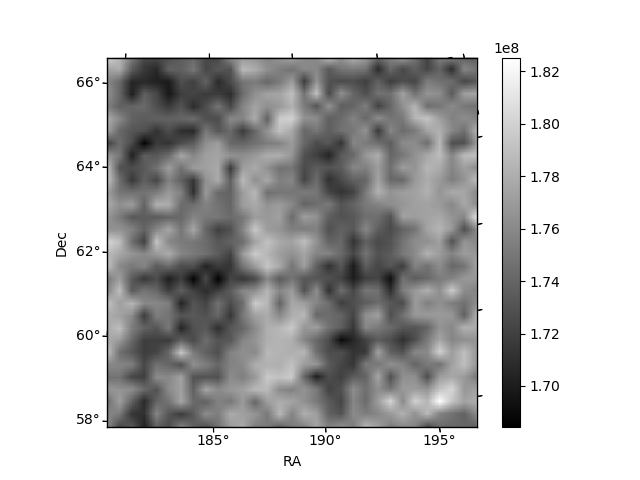
Histogram calculated using DETX and DETY for each event in the final _common_clean file
| Quadrant A | 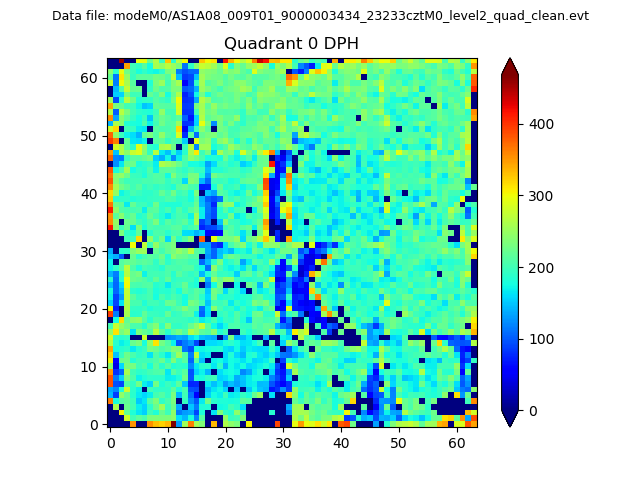 |
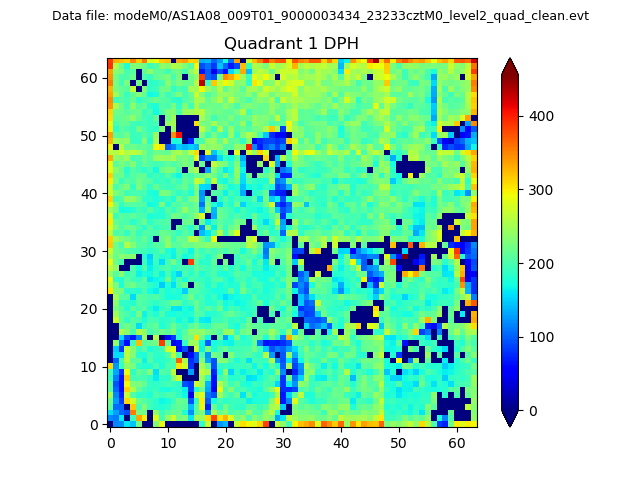 |
Quadrant B |
|---|---|---|---|
| Quadrant D | 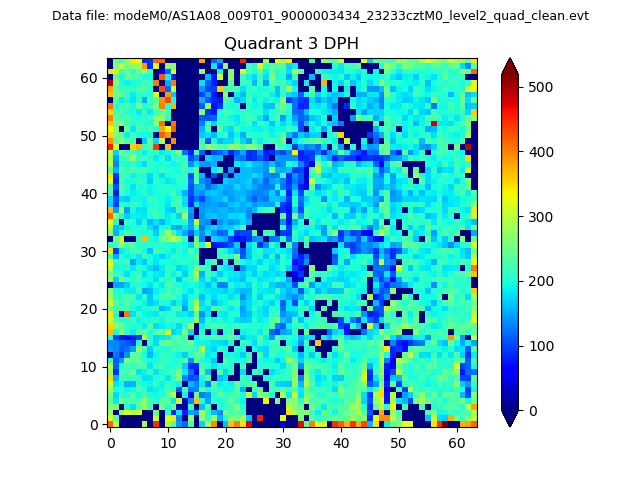 |
 |
Quadrant C |
| Plot type | Count rate plots | Images |
|---|---|---|
| Comparison with Poisson distribution Blue bars denote a histogram of data divided into 1 sec bins. Red curve is a Poisson curve with rate = median count rate of data. |
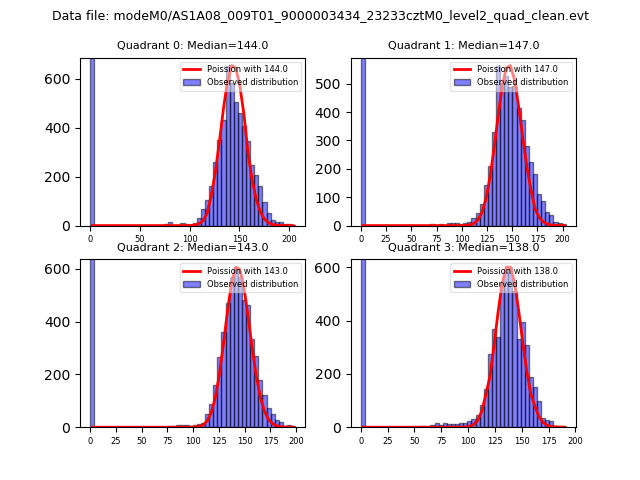 |
 |
| Quadrant-wise count rates Data is divided into 100 sec bins |
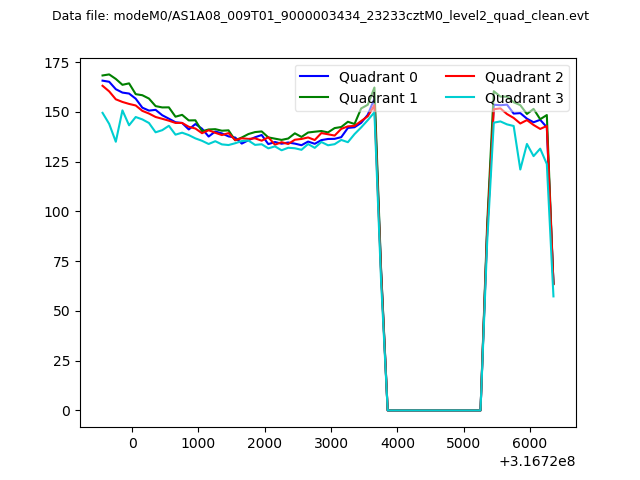 |
|
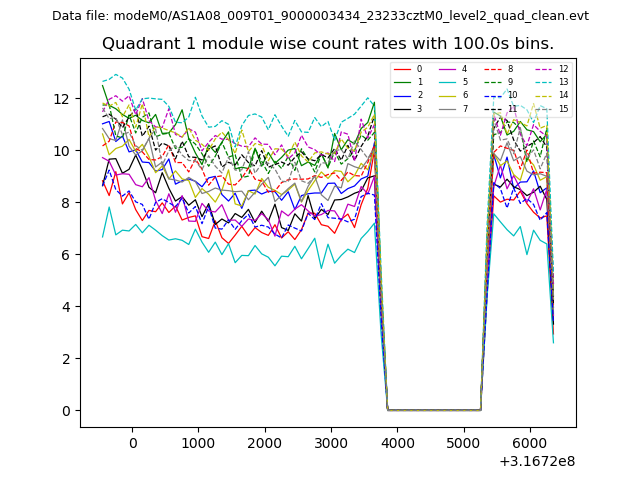
| Module-wise count rates for Quadrant A Data is divided into 100 sec bins |
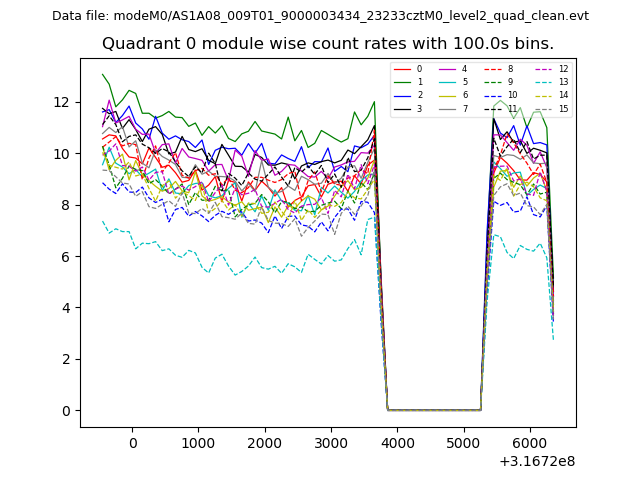 |
 |
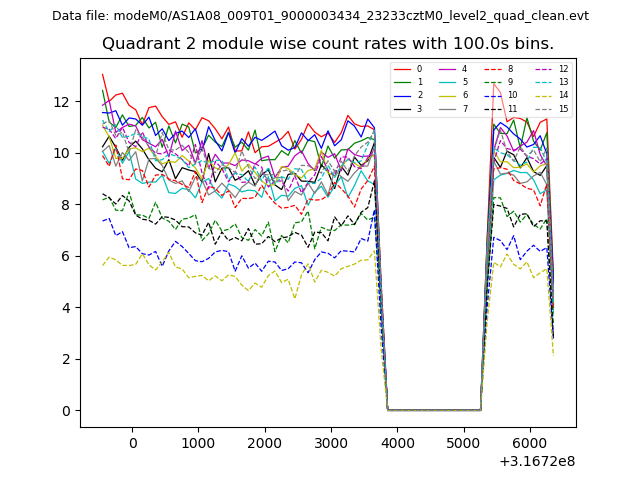
| Module-wise count rates for Quadrant B Data is divided into 100 sec bins |
 |
 |
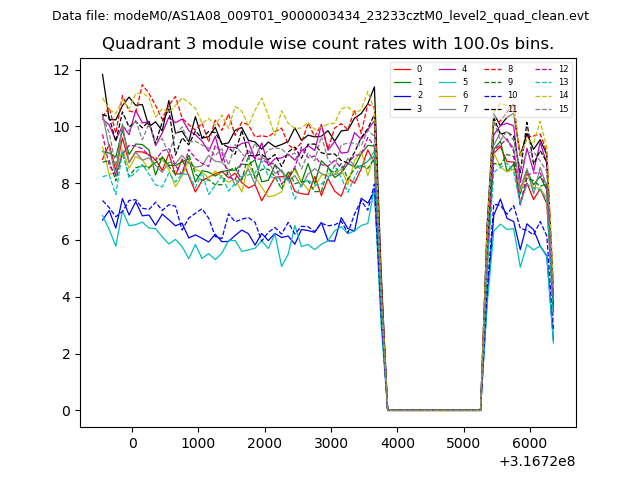
| Module-wise count rates for Quadrant C Data is divided into 100 sec bins |
 |
 |
| Module-wise count rates for Quadrant D Data is divided into 100 sec bins |
 |
 |
| Parameter | Plot |
|---|---|
| CZT HV Monitor | 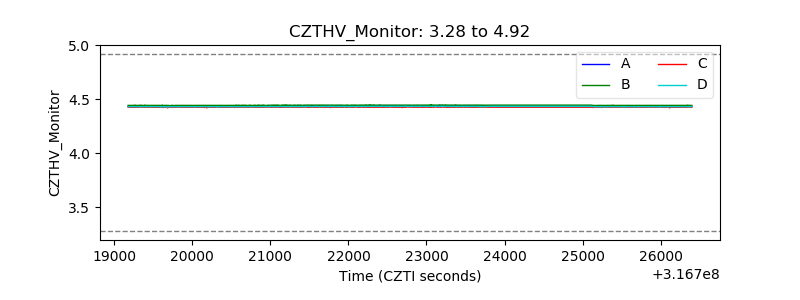 |
| D_VDD | 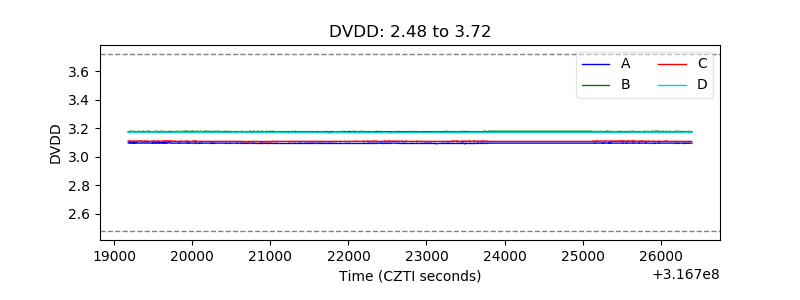 |
| Temperature 1 | 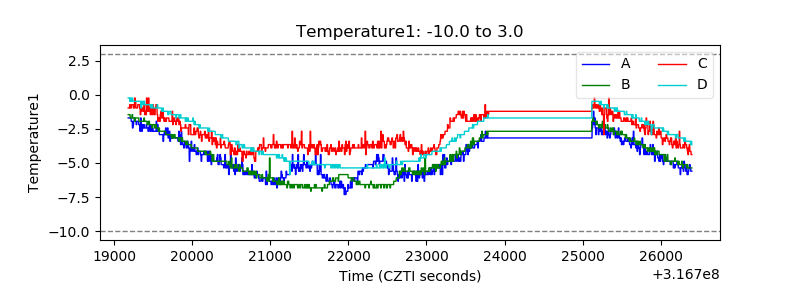 |
| Veto HV Monitor | 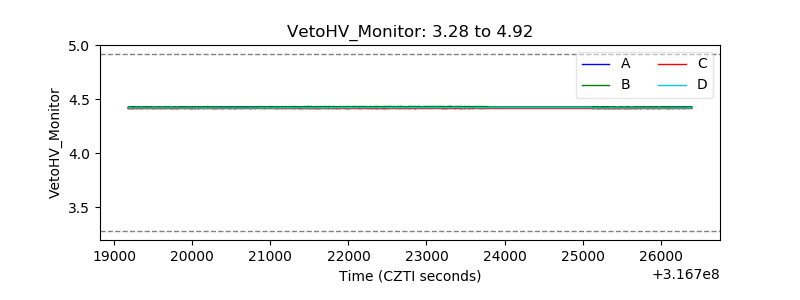 |
| Veto LLD | 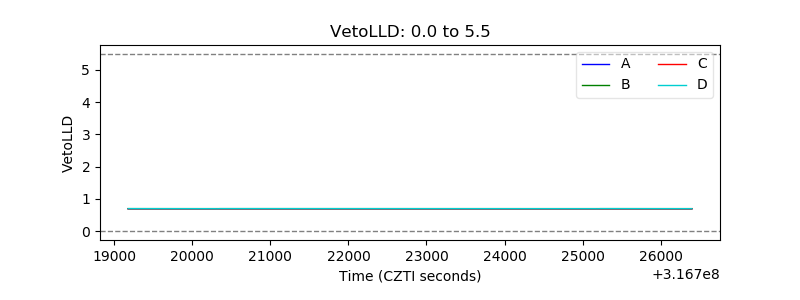 |
| Alpha Counter | 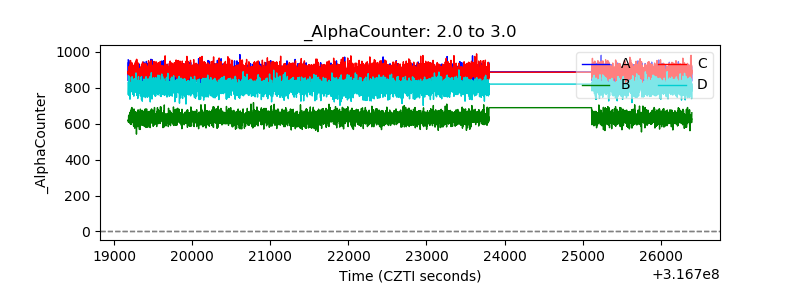 |
| _CPM_Rate | 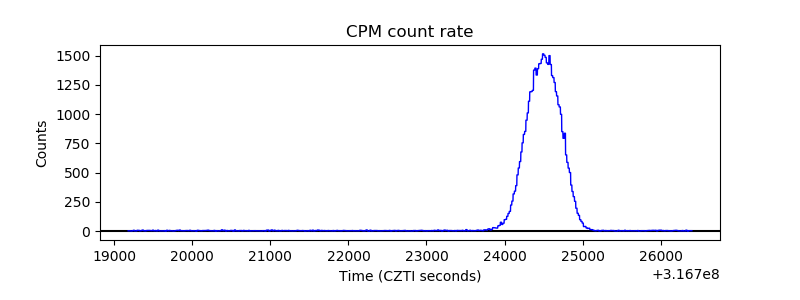 |
| CZT Counter |  |
| +2.5 Volts monitor |  |
| +5 Volts monitor | 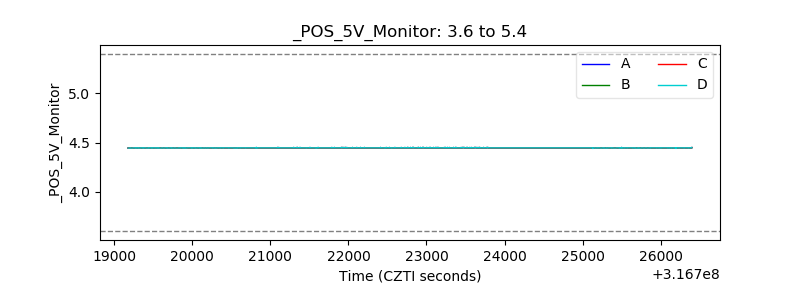 |
| _ROLL_ROT | 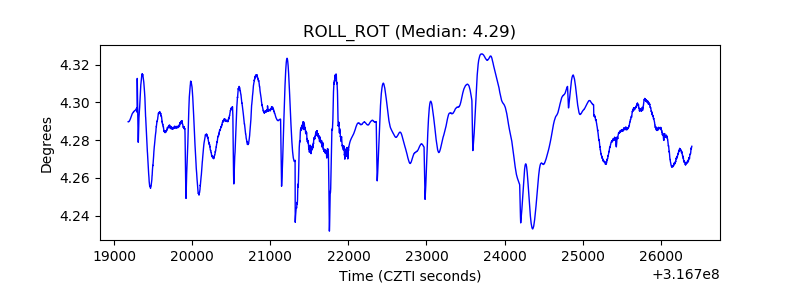 |
| _Roll_DEC | 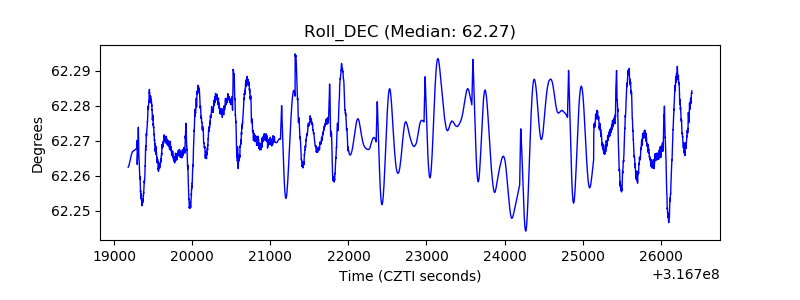 |
| _Roll_RA | 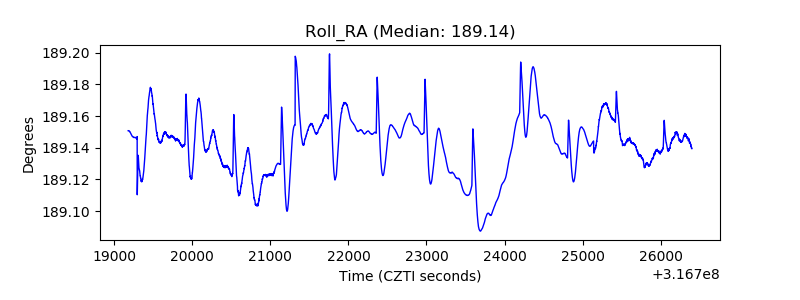 |
| Veto Counter |  |