| Param | Original file | Final file |
|---|---|---|
| Filename | modeM0/AS1A08_009T01_9000003434_23240cztM0_level2.evt | modeM0/AS1A08_009T01_9000003434_23240cztM0_level2_quad_clean.evt |
| Size (bytes) | 528,203,520 | 104,126,400 |
| Size | 503.7 MB | 99.3 MB |
| Events in quadrant A | 3,353,355 | 677,639 |
| Events in quadrant B | 3,226,139 | 692,777 |
| Events in quadrant C | 3,917,835 | 661,363 |
| Events in quadrant D | 5,035,028 | 644,730 |
| Mode M0 | |||
|---|---|---|---|
| Quadrant | BADHDUFLAG | Total packets | Discarded packets |
| A | 0 | 14511 | 3 |
| B | 0 | 14193 | 3 |
| C | 0 | 16279 | 3 |
| D | 0 | 19589 | 3 |
| Mode M9 | |||
|---|---|---|---|
| Quadrant | BADHDUFLAG | Total packets | Discarded packets |
| A | 0 | 6 | 0 |
| B | 0 | 7 | 0 |
| C | 0 | 7 | 0 |
| D | 0 | 7 | 0 |
| Mode SS | |||
|---|---|---|---|
| Quadrant | BADHDUFLAG | Total packets | Discarded packets |
| A | 0 | 142 | 0 |
| B | 0 | 142 | 0 |
| C | 0 | 142 | 0 |
| D | 0 | 142 | 0 |
| Quadrant | Total seconds | Saturated seconds | Saturation percentage |
|---|---|---|---|
| A | 6838 | 32 | 0.467973% |
| B | 6838 | 52 | 0.760456% |
| C | 6838 | 228 | 3.334308% |
| D | 6838 | 458 | 6.697865% |
Noise dominated data is calculated using 1-second bins in cleaned event files. If a bin has >2000 counts, and if more than 50% of those come from <1% of pixels, then it is considered to be noise-dominated and hence unusable.
| Quadrant | # 1 sec bins | Bins with >0 counts | Bins with >2000 counts | High rate bins dominated by noise | Noise dominated (total time) | Noise dominated (detector-on time) | Marked lightcurve |
|---|---|---|---|---|---|---|---|
| A | 7183 | 6840 | 3 | 3 | 0.04% | 0.04% | 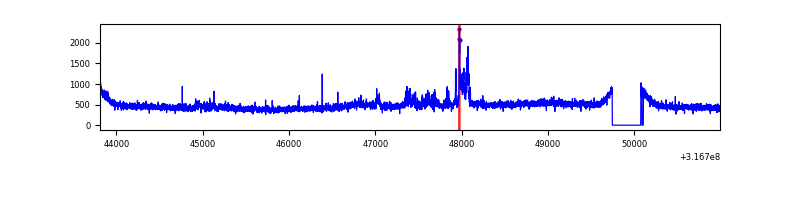 |
| B | 7183 | 6840 | 1 | 1 | 0.01% | 0.01% | 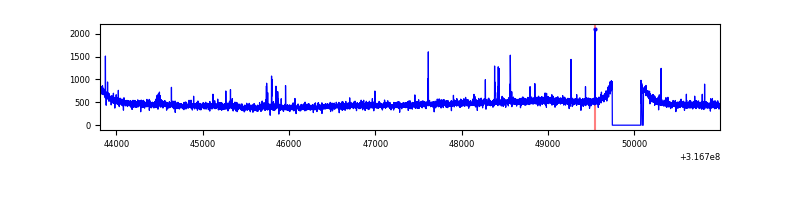 |
| C | 7183 | 6840 | 47 | 47 | 0.65% | 0.69% | 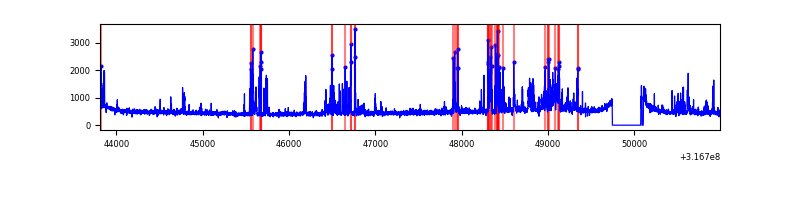 |
| D | 7183 | 6840 | 350 | 350 | 4.87% | 5.12% | 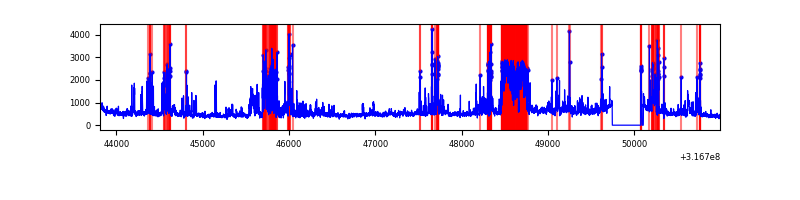 |
Top three noisy pixels from each quadrant. If the there are fewer than three noisy pixels in the level2.evt file, extra rows are filled as -1
| Pixel properties | Quadrant properties | ||||||
|---|---|---|---|---|---|---|---|
| Quadrant | DetID | PixID | Counts | Sigma | Mean | Median | Sigma |
| A | 13 | 252 | 218548 | 1333.43 | 809 | 790 | 163.3 |
| A | 6 | 16 | 15566 | 90.48 | 809 | 790 | 163.3 |
| A | 13 | 254 | 10467 | 59.26 | 809 | 790 | 163.3 |
| B | 12 | 111 | 19132 | 117.34 | 812 | 789 | 156.3 |
| B | 11 | 111 | 17077 | 104.19 | 812 | 789 | 156.3 |
| B | 0 | 228 | 15635 | 94.97 | 812 | 789 | 156.3 |
| C | 8 | 208 | 631306 | 3449.99 | 779 | 783 | 182.8 |
| C | 14 | 238 | 123308 | 670.41 | 779 | 783 | 182.8 |
| C | 0 | 10 | 41246 | 221.4 | 779 | 783 | 182.8 |
| D | 7 | 238 | 956410 | 5228.59 | 750 | 728 | 182.8 |
| D | 1 | 52 | 898401 | 4911.22 | 750 | 728 | 182.8 |
| D | 12 | 233 | 103118 | 560.18 | 750 | 728 | 182.8 |
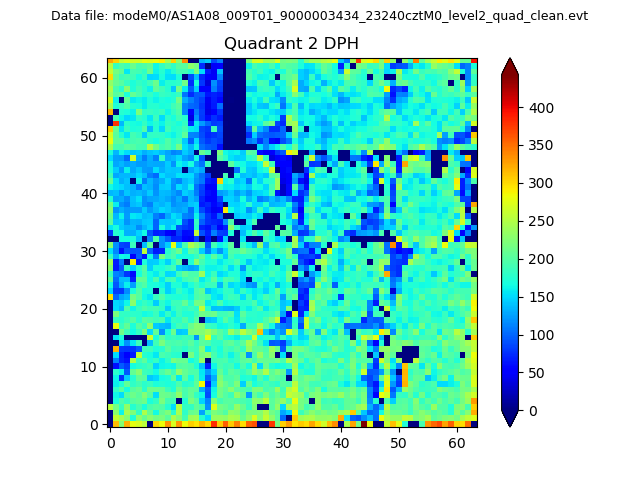
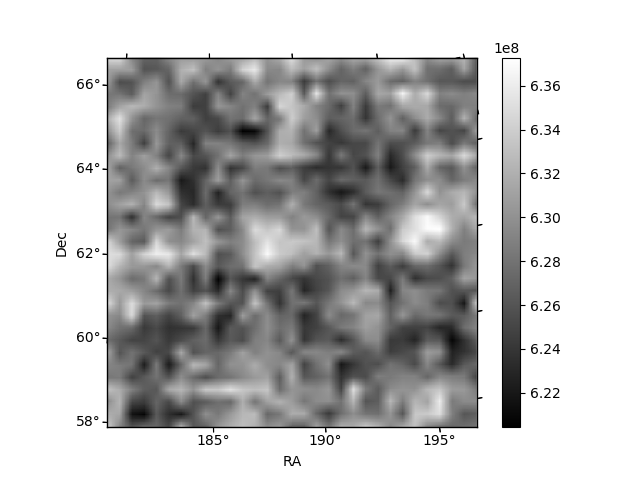
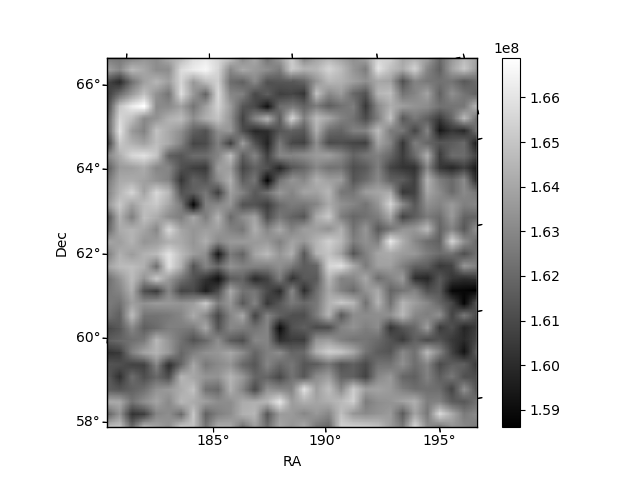
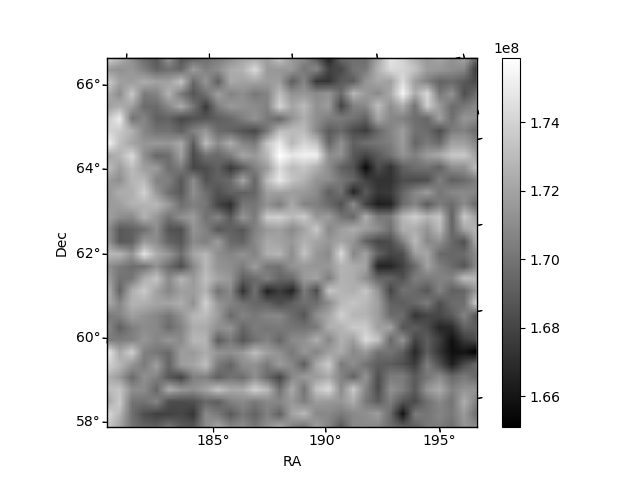
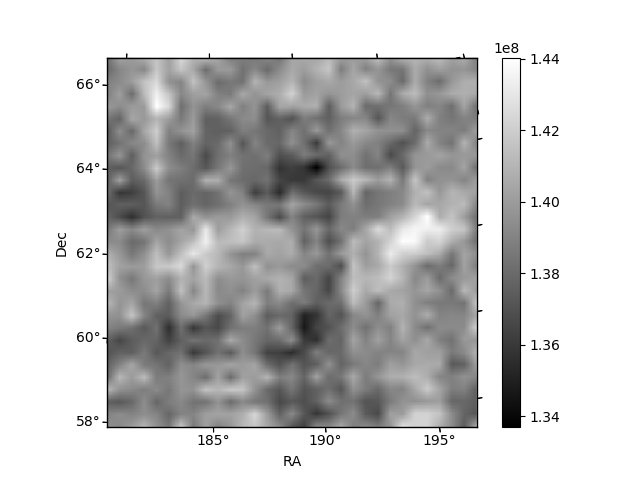
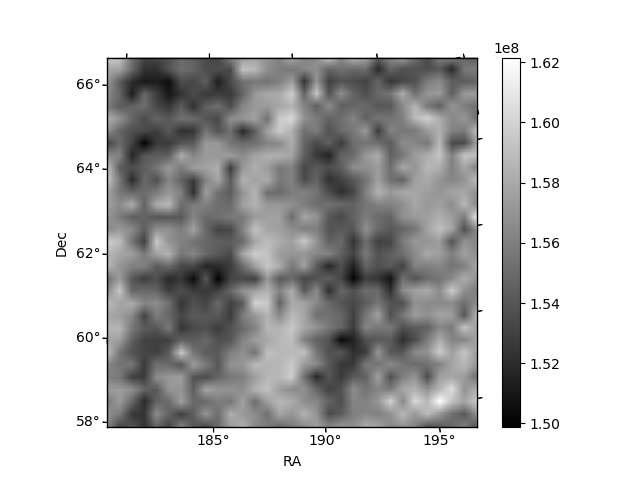
Histogram calculated using DETX and DETY for each event in the final _common_clean file
| Quadrant A | 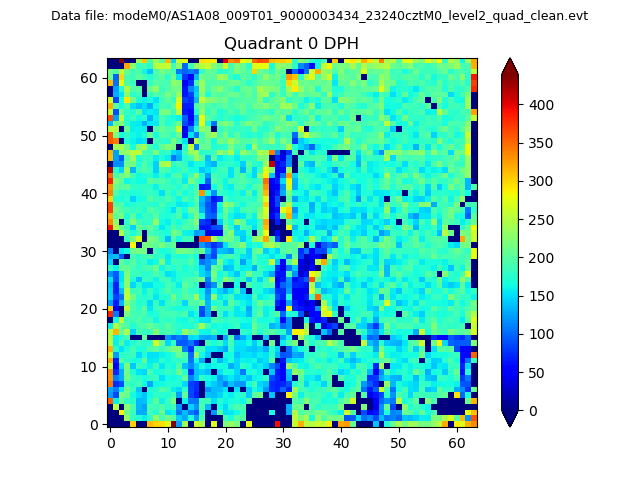 |
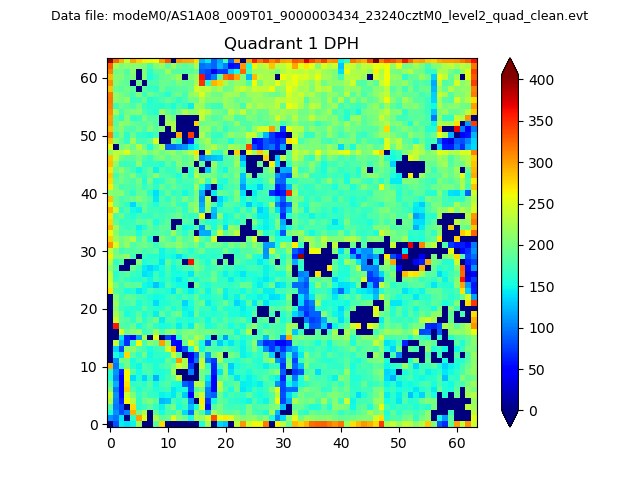 |
Quadrant B |
|---|---|---|---|
| Quadrant D | 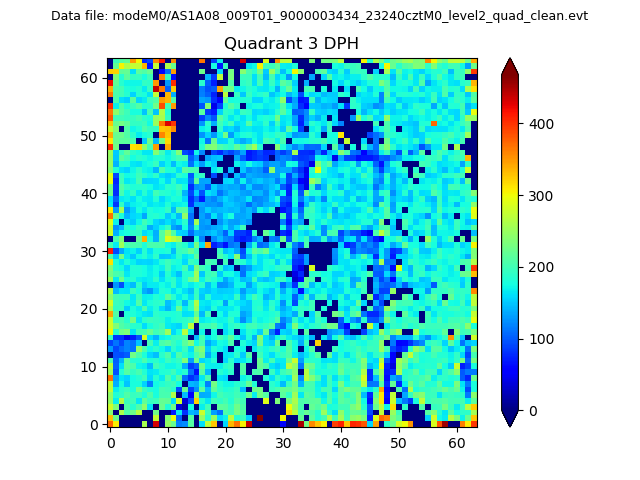 |
 |
Quadrant C |
| Plot type | Count rate plots | Images |
|---|---|---|
| Comparison with Poisson distribution Blue bars denote a histogram of data divided into 1 sec bins. Red curve is a Poisson curve with rate = median count rate of data. |
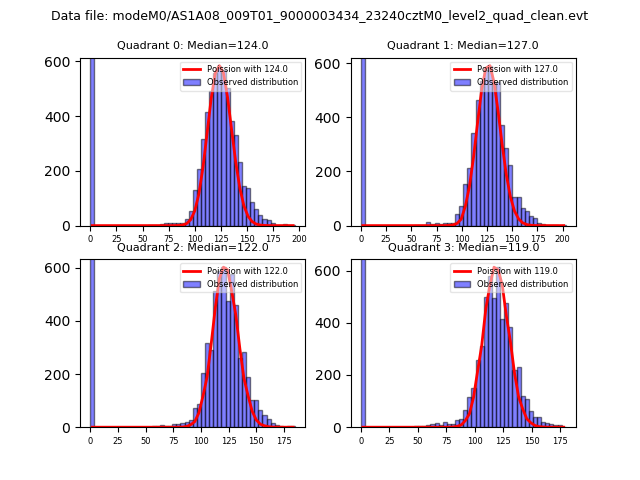 |
 |
| Quadrant-wise count rates Data is divided into 100 sec bins |
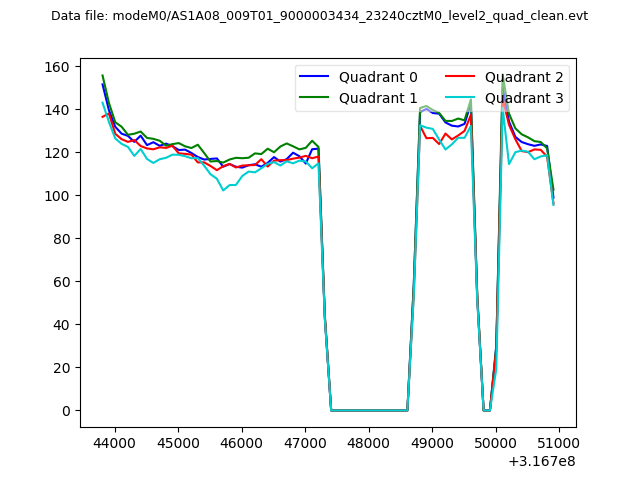 |
|
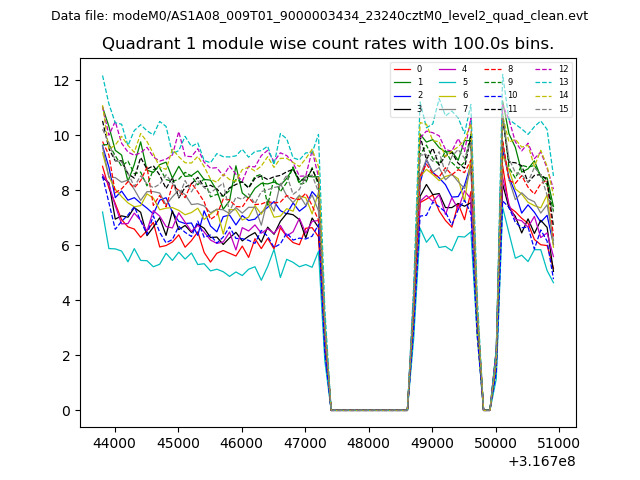
| Module-wise count rates for Quadrant A Data is divided into 100 sec bins |
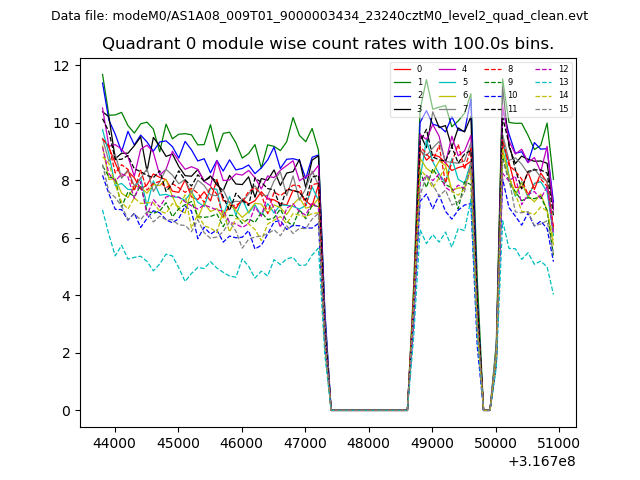 |
 |
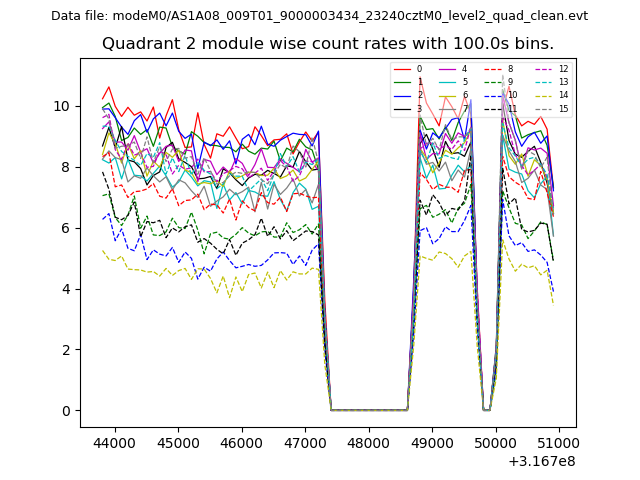
| Module-wise count rates for Quadrant B Data is divided into 100 sec bins |
 |
 |
| Module-wise count rates for Quadrant C Data is divided into 100 sec bins |
 |
 |
| Module-wise count rates for Quadrant D Data is divided into 100 sec bins |
 |
 |
| Parameter | Plot |
|---|---|
| CZT HV Monitor | 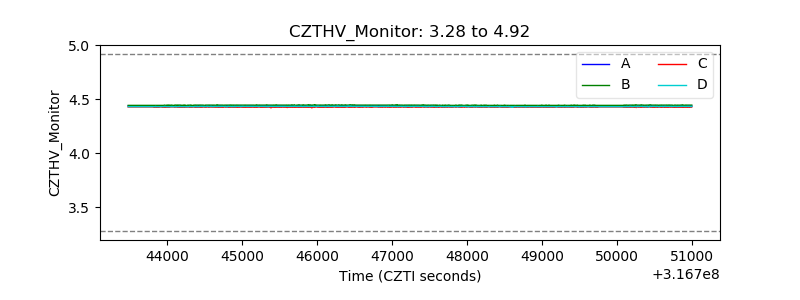 |
| D_VDD | 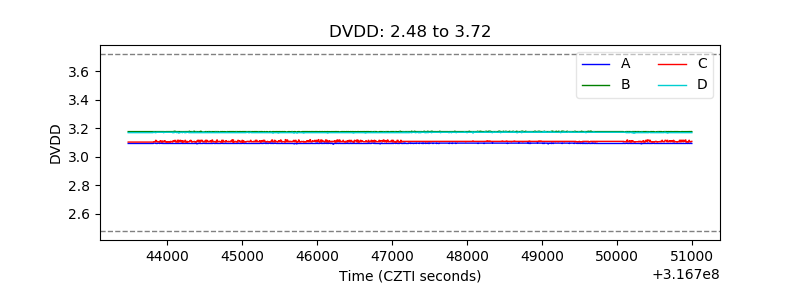 |
| Temperature 1 | 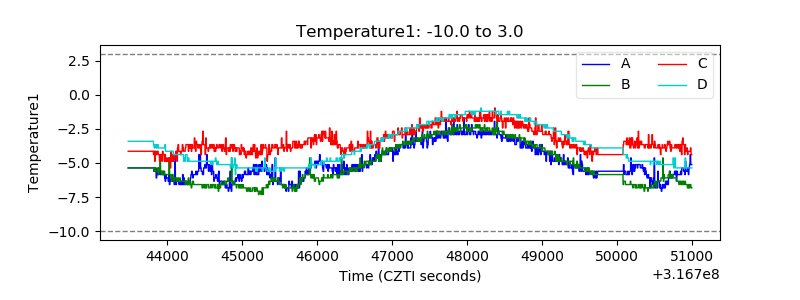 |
| Veto HV Monitor | 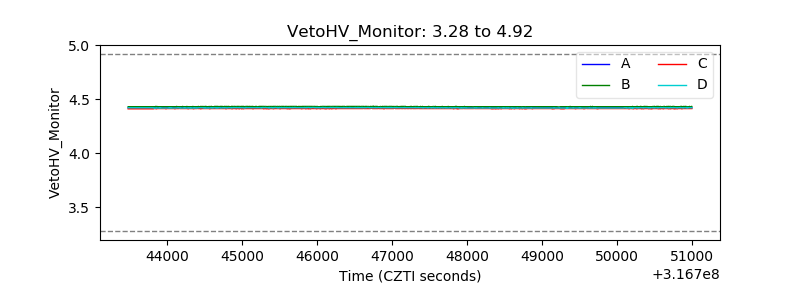 |
| Veto LLD | 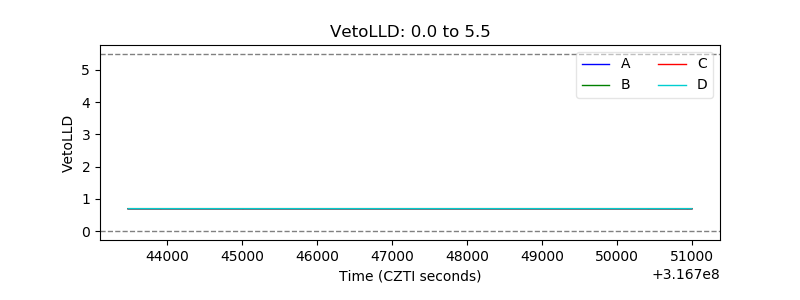 |
| Alpha Counter | 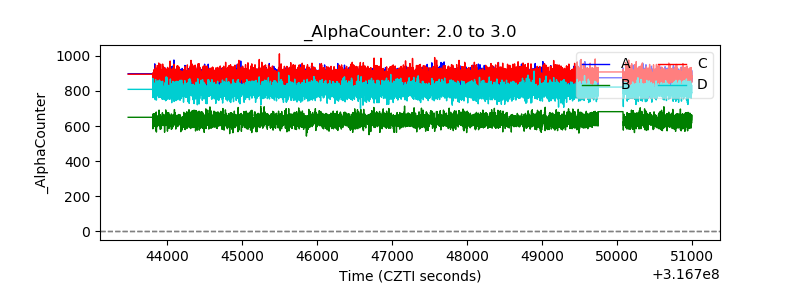 |
| _CPM_Rate | 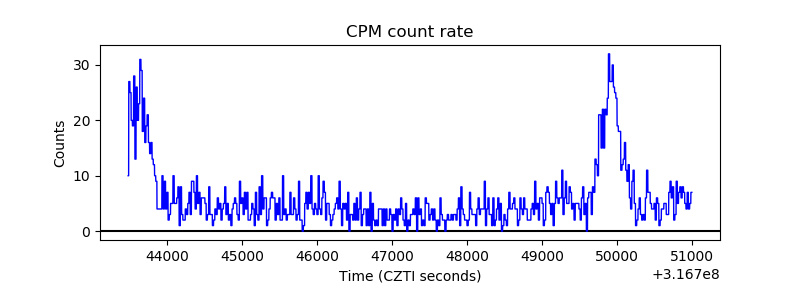 |
| CZT Counter | 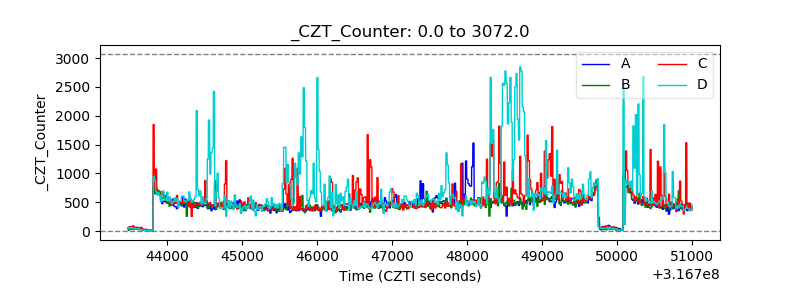 |
| +2.5 Volts monitor |  |
| +5 Volts monitor |  |
| _ROLL_ROT |  |
| _Roll_DEC | 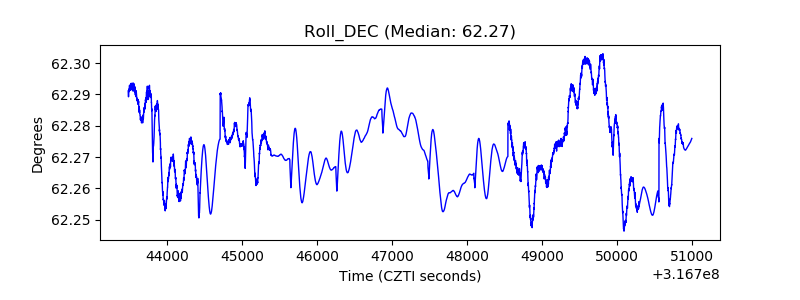 |
| _Roll_RA | 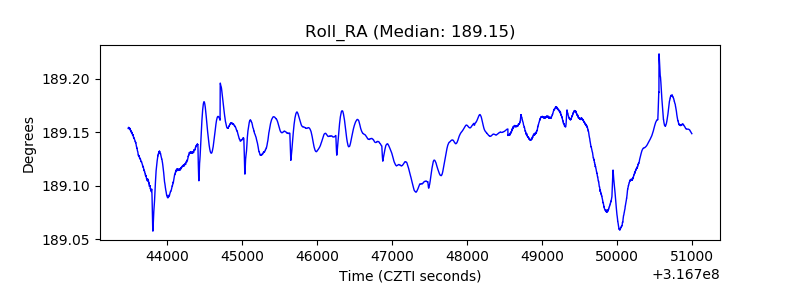 |
| Veto Counter |  |