| Param | Original file | Final file |
|---|---|---|
| Filename | modeM0/AS1A08_004T02_9000003436cztM0_level2.fits | modeM0/AS1A08_004T02_9000003436cztM0_level2_quad_clean.evt |
| Size (bytes) | 313,107,840 | 351,069,120 |
| Size | 298.6 MB | 334.8 MB |
| Events in quadrant A | 1,936,396 | 2,204,632 |
| Events in quadrant B | 1,848,334 | 2,203,760 |
| Events in quadrant C | 1,846,722 | 2,084,386 |
| Events in quadrant D | 1,626,444 | 1,915,329 |
| Mode SS | |||
|---|---|---|---|
| Quadrant | BADHDUFLAG | Total packets | Discarded packets |
| A | 0 | 656 | 0 |
| B | 0 | 656 | 0 |
| C | 0 | 656 | 0 |
| D | 0 | 656 | 0 |
| Mode M0 | |||
|---|---|---|---|
| Quadrant | BADHDUFLAG | Total packets | Discarded packets |
| A | 0 | 67269 | 0 |
| B | 0 | 67676 | 0 |
| C | 0 | 76627 | 0 |
| D | 0 | 80195 | 0 |
| Mode M9 | |||
|---|---|---|---|
| Quadrant | BADHDUFLAG | Total packets | Discarded packets |
| A | 0 | 52 | 0 |
| B | 0 | 52 | 0 |
| C | 0 | 52 | 0 |
| D | 0 | 52 | 0 |
| Quadrant | Total seconds | Saturated seconds | Saturation percentage |
|---|---|---|---|
| A | 32383 | 300 | 0.926412% |
| B | 32383 | 410 | 1.266096% |
| C | 32383 | 1053 | 3.251706% |
| D | 32383 | 882 | 2.723651% |
Noise dominated data is calculated using 1-second bins in cleaned event files. If a bin has >2000 counts, and if more than 50% of those come from <1% of pixels, then it is considered to be noise-dominated and hence unusable.
| Quadrant | # 1 sec bins | Bins with >0 counts | Bins with >2000 counts | High rate bins dominated by noise | Noise dominated (total time) | Noise dominated (detector-on time) | Marked lightcurve |
|---|---|---|---|---|---|---|---|
| A | 37463 | 32378 | 0 | 0 | 0.00% | 0.00% | 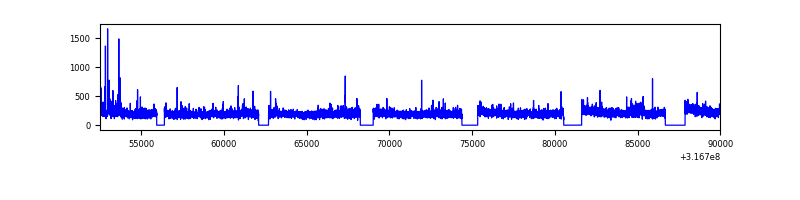 |
| B | 37463 | 32377 | 0 | 0 | 0.00% | 0.00% |  |
| C | 37463 | 32377 | 0 | 0 | 0.00% | 0.00% |  |
| D | 37463 | 32377 | 0 | 0 | 0.00% | 0.00% |  |
Top three noisy pixels from each quadrant. If the there are fewer than three noisy pixels in the level2.evt file, extra rows are filled as -1
| Pixel properties | Quadrant properties | ||||||
|---|---|---|---|---|---|---|---|
| Quadrant | DetID | PixID | Counts | Sigma | Mean | Median | Sigma |
| A | 0 | 29 | 1827 | 10.77 | 504 | 475 | 125.5 |
| A | 9 | 19 | 1522 | 8.34 | 504 | 475 | 125.5 |
| A | 7 | 110 | 1500 | 8.17 | 504 | 475 | 125.5 |
| B | 2 | 9 | 1473 | 10.35 | 489 | 470 | 96.9 |
| B | 2 | 8 | 1293 | 8.49 | 489 | 470 | 96.9 |
| B | 5 | 128 | 1186 | 7.39 | 489 | 470 | 96.9 |
| C | 12 | 241 | 1329 | 7.03 | 487 | 458 | 123.9 |
| C | 2 | 191 | 1273 | 6.58 | 487 | 458 | 123.9 |
| C | 9 | 209 | 1262 | 6.49 | 487 | 458 | 123.9 |
| D | 3 | 14 | 1244 | 6.63 | 464 | 423 | 123.8 |
| D | 6 | 231 | 1143 | 5.82 | 464 | 423 | 123.8 |
| D | 15 | 46 | 1113 | 5.57 | 464 | 423 | 123.8 |
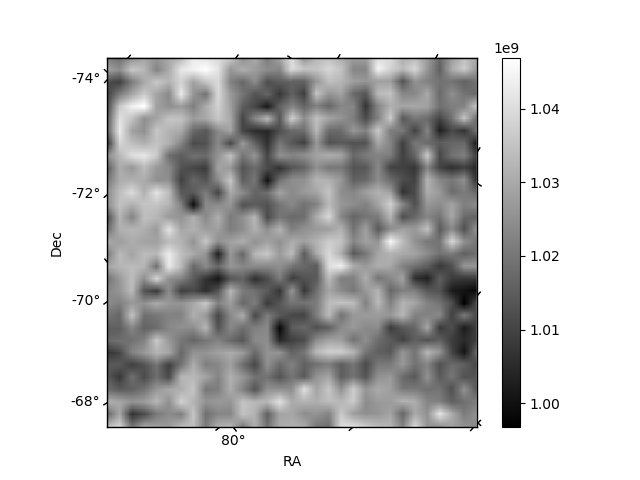
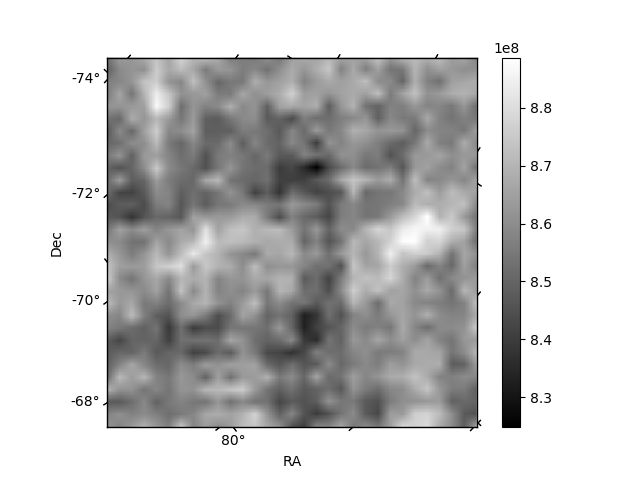
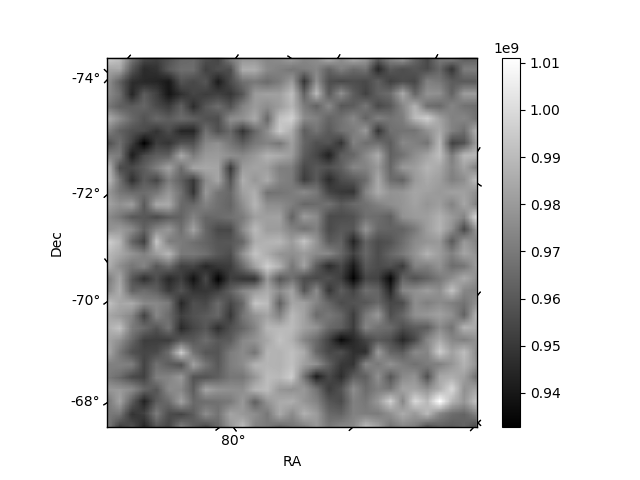
Histogram calculated using DETX and DETY for each event in the final _common_clean file
| Quadrant A | 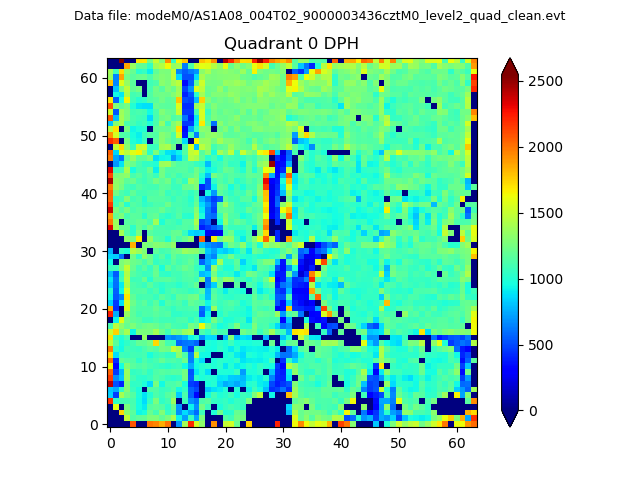 |
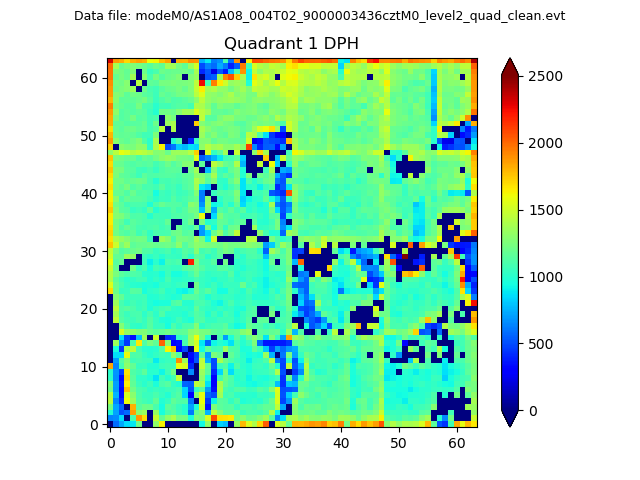 |
Quadrant B |
|---|---|---|---|
| Quadrant D |  |
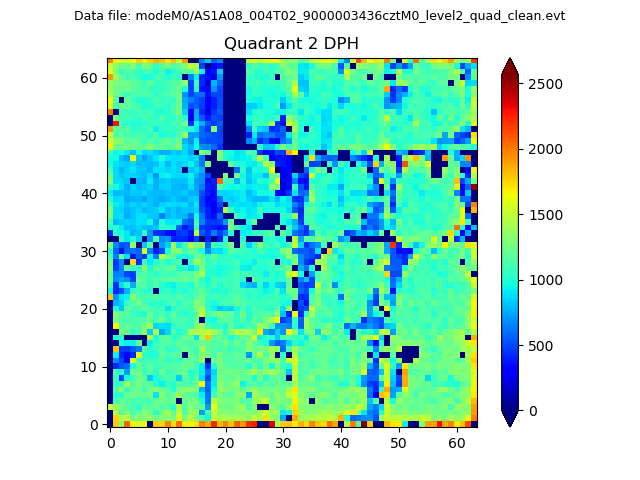 |
Quadrant C |
| Plot type | Count rate plots | Images |
|---|---|---|
| Comparison with Poisson distribution Blue bars denote a histogram of data divided into 1 sec bins. Red curve is a Poisson curve with rate = median count rate of data. |
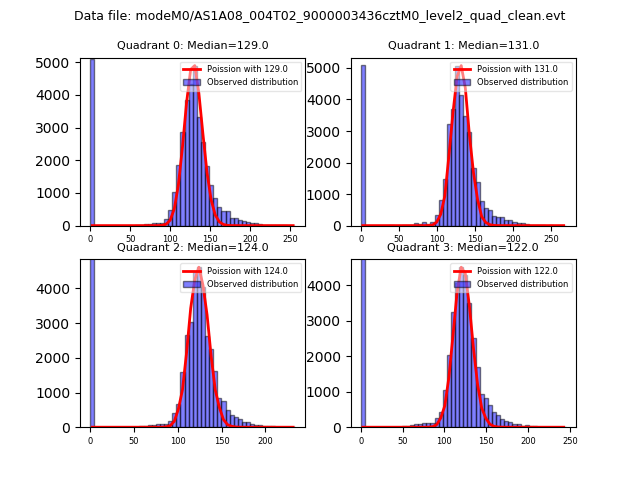 |
 |
| Quadrant-wise count rates Data is divided into 100 sec bins |
 |
|
| Module-wise count rates for Quadrant A Data is divided into 100 sec bins |
 |
 |
| Module-wise count rates for Quadrant B Data is divided into 100 sec bins |
 |
 |
| Module-wise count rates for Quadrant C Data is divided into 100 sec bins |
 |
 |
| Module-wise count rates for Quadrant D Data is divided into 100 sec bins |
 |
 |
| Parameter | Plot |
|---|---|
| CZT HV Monitor |  |
| D_VDD |  |
| Temperature 1 |  |
| Veto HV Monitor |  |
| Veto LLD |  |
| Alpha Counter |  |
| _CPM_Rate | 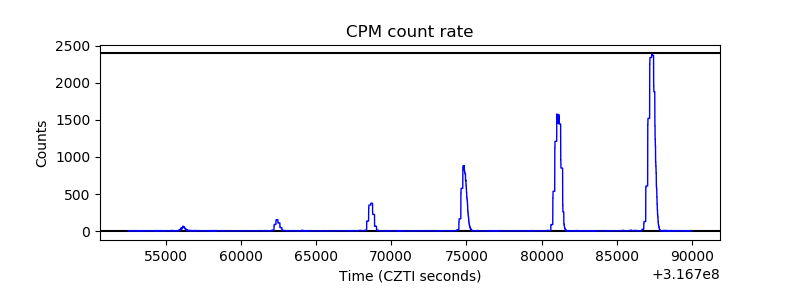 |
| CZT Counter |  |
| +2.5 Volts monitor |  |
| +5 Volts monitor |  |
| _ROLL_ROT | 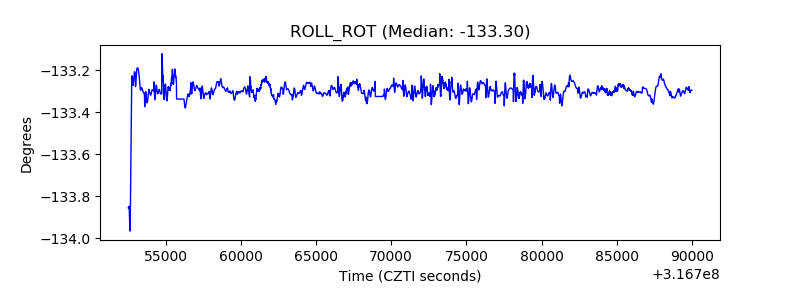 |
| _Roll_DEC |  |
| _Roll_RA |  |
| Veto Counter |  |