| Param | Original file | Final file |
|---|---|---|
| Filename | modeM0/AS1A08_004T02_9000003436_23243cztM0_level2.evt | modeM0/AS1A08_004T02_9000003436_23243cztM0_level2_quad_clean.evt |
| Size (bytes) | 555,336,000 | 136,627,200 |
| Size | 529.6 MB | 130.3 MB |
| Events in quadrant A | 3,308,966 | 941,326 |
| Events in quadrant B | 3,397,376 | 957,104 |
| Events in quadrant C | 4,726,697 | 889,749 |
| Events in quadrant D | 4,927,457 | 879,044 |
| Mode SS | |||
|---|---|---|---|
| Quadrant | BADHDUFLAG | Total packets | Discarded packets |
| A | 0 | 136 | 0 |
| B | 0 | 136 | 0 |
| C | 0 | 136 | 0 |
| D | 0 | 136 | 0 |
| Mode M0 | |||
|---|---|---|---|
| Quadrant | BADHDUFLAG | Total packets | Discarded packets |
| A | 0 | 14245 | 1 |
| B | 0 | 14402 | 1 |
| C | 0 | 18661 | 1 |
| D | 0 | 19174 | 1 |
| Mode M9 | |||
|---|---|---|---|
| Quadrant | BADHDUFLAG | Total packets | Discarded packets |
| A | 0 | 11 | 0 |
| B | 0 | 11 | 0 |
| C | 0 | 11 | 0 |
| D | 0 | 11 | 0 |
| Quadrant | Total seconds | Saturated seconds | Saturation percentage |
|---|---|---|---|
| A | 6760 | 53 | 0.784024% |
| B | 6760 | 67 | 0.991124% |
| C | 6760 | 380 | 5.621302% |
| D | 6761 | 281 | 4.156190% |
Noise dominated data is calculated using 1-second bins in cleaned event files. If a bin has >2000 counts, and if more than 50% of those come from <1% of pixels, then it is considered to be noise-dominated and hence unusable.
| Quadrant | # 1 sec bins | Bins with >0 counts | Bins with >2000 counts | High rate bins dominated by noise | Noise dominated (total time) | Noise dominated (detector-on time) | Marked lightcurve |
|---|---|---|---|---|---|---|---|
| A | 7845 | 6760 | 0 | 0 | 0.00% | 0.00% | 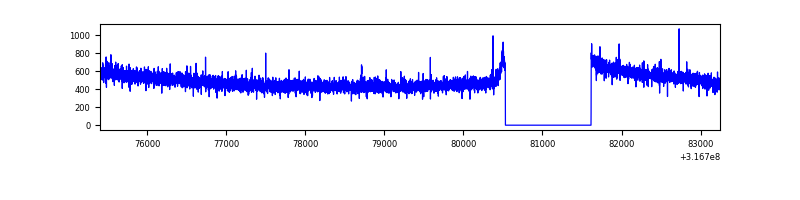 |
| B | 7845 | 6760 | 5 | 5 | 0.06% | 0.07% | 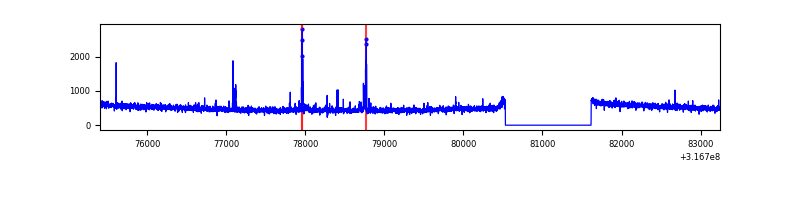 |
| C | 7845 | 6760 | 94 | 94 | 1.20% | 1.39% | 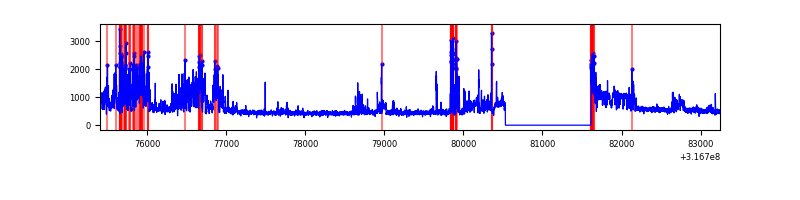 |
| D | 7846 | 6761 | 184 | 184 | 2.35% | 2.72% | 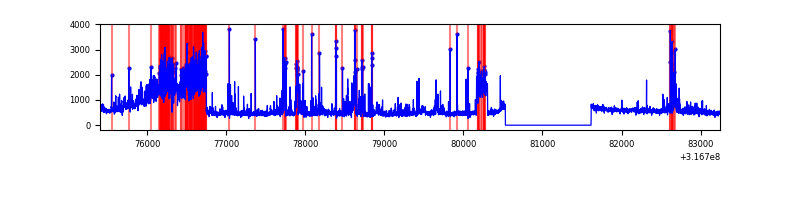 |
Top three noisy pixels from each quadrant. If the there are fewer than three noisy pixels in the level2.evt file, extra rows are filled as -1
| Pixel properties | Quadrant properties | ||||||
|---|---|---|---|---|---|---|---|
| Quadrant | DetID | PixID | Counts | Sigma | Mean | Median | Sigma |
| A | 6 | 16 | 12988 | 71.02 | 854 | 838 | 171.1 |
| A | 13 | 254 | 10116 | 54.23 | 854 | 838 | 171.1 |
| A | 0 | 226 | 7435 | 38.56 | 854 | 838 | 171.1 |
| B | 3 | 64 | 36116 | 225.07 | 844 | 824 | 156.8 |
| B | 10 | 247 | 18821 | 114.77 | 844 | 824 | 156.8 |
| B | 12 | 111 | 18605 | 113.39 | 844 | 824 | 156.8 |
| C | 8 | 208 | 1323893 | 7149.42 | 803 | 808 | 185.1 |
| C | 14 | 238 | 129005 | 692.73 | 803 | 808 | 185.1 |
| C | 0 | 10 | 98544 | 528.13 | 803 | 808 | 185.1 |
| D | 12 | 218 | 911517 | 4574.05 | 825 | 800 | 199.1 |
| D | 7 | 238 | 228854 | 1145.39 | 825 | 800 | 199.1 |
| D | 1 | 52 | 158984 | 794.47 | 825 | 800 | 199.1 |
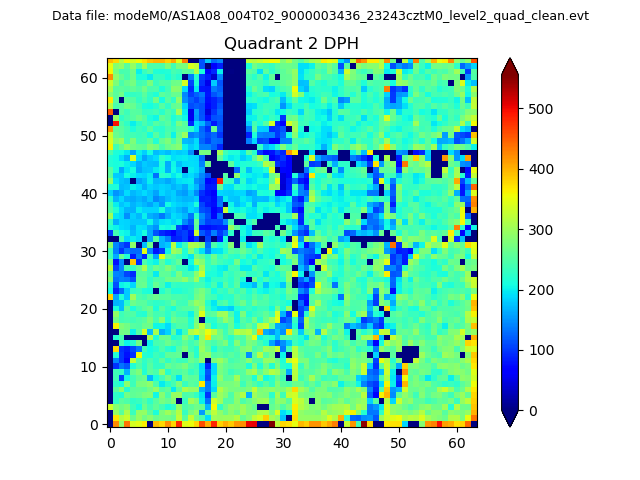
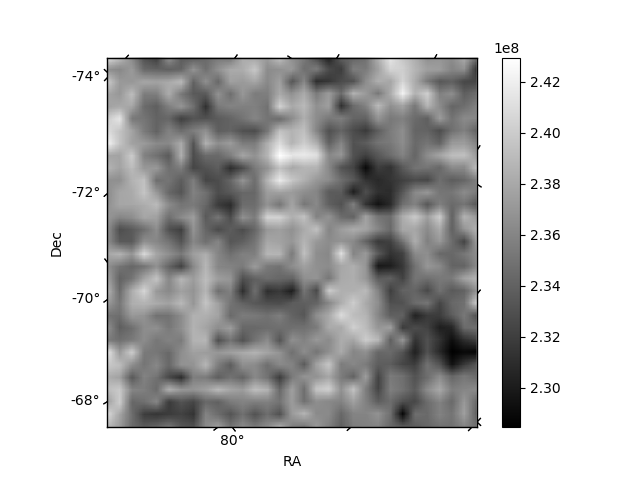
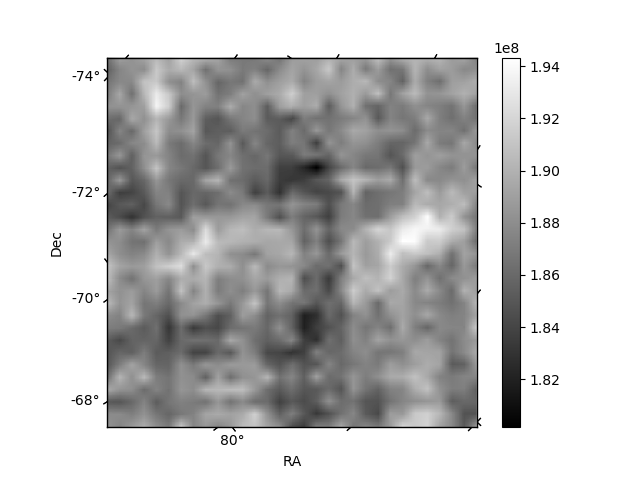
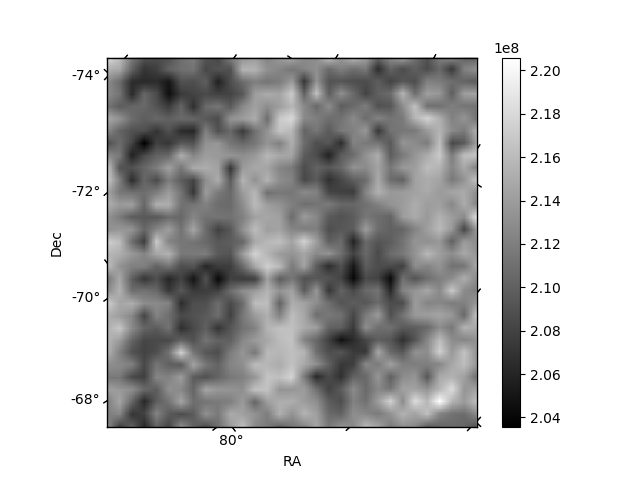
Histogram calculated using DETX and DETY for each event in the final _common_clean file
| Quadrant A | 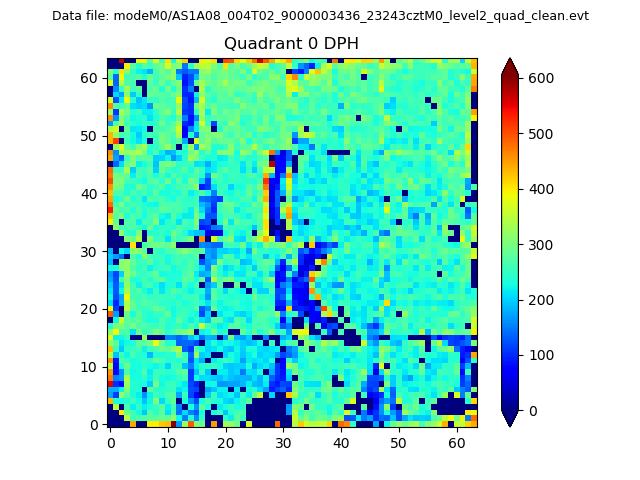 |
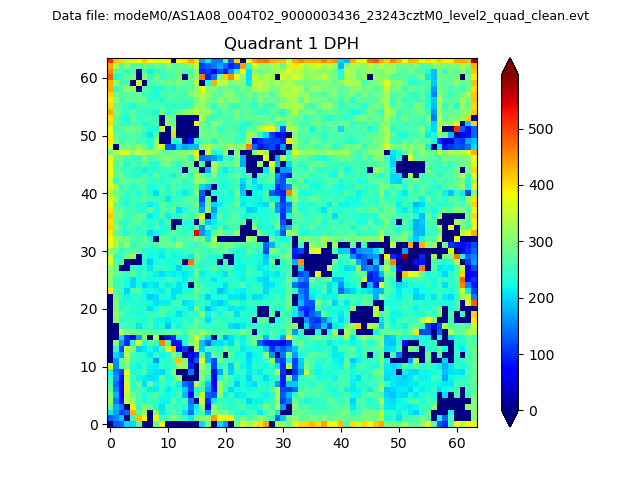 |
Quadrant B |
|---|---|---|---|
| Quadrant D | 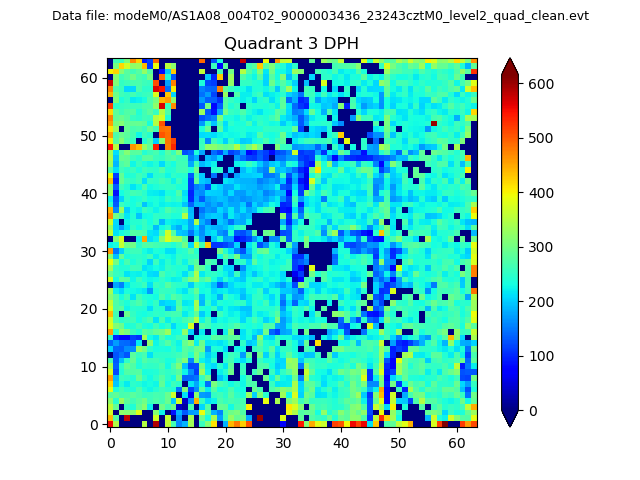 |
 |
Quadrant C |
| Plot type | Count rate plots | Images |
|---|---|---|
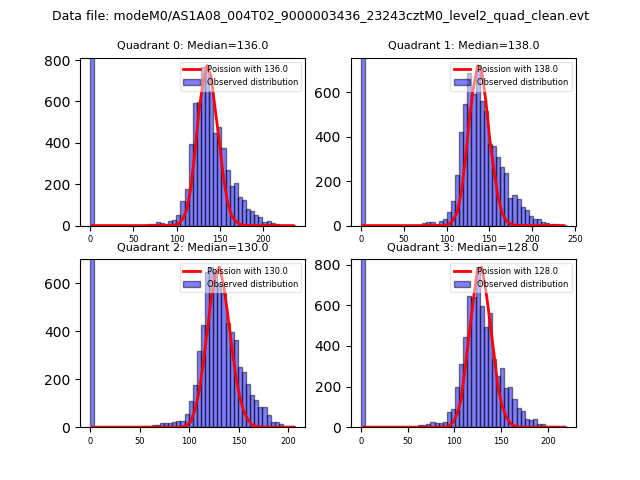
| Comparison with Poisson distribution Blue bars denote a histogram of data divided into 1 sec bins. Red curve is a Poisson curve with rate = median count rate of data. |
 |
 |
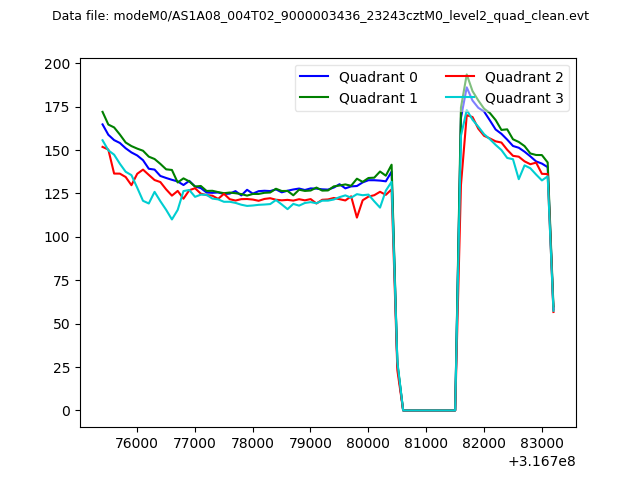
| Quadrant-wise count rates Data is divided into 100 sec bins |
 |
|
| Module-wise count rates for Quadrant A Data is divided into 100 sec bins |
 |
 |
| Module-wise count rates for Quadrant B Data is divided into 100 sec bins |
 |
 |
| Module-wise count rates for Quadrant C Data is divided into 100 sec bins |
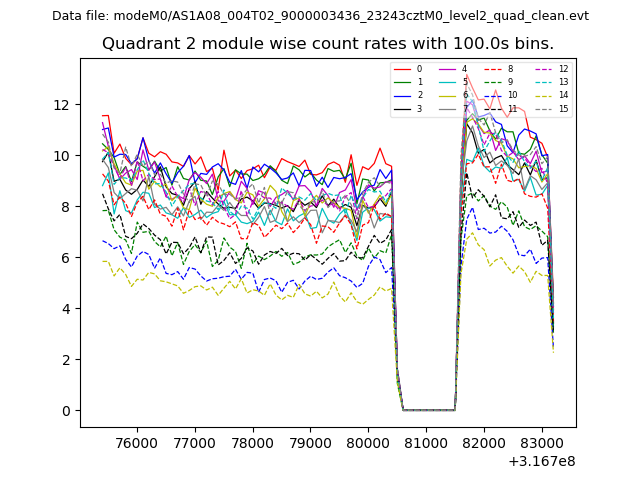 |
 |
| Module-wise count rates for Quadrant D Data is divided into 100 sec bins |
 |
 |
| Parameter | Plot |
|---|---|
| CZT HV Monitor | 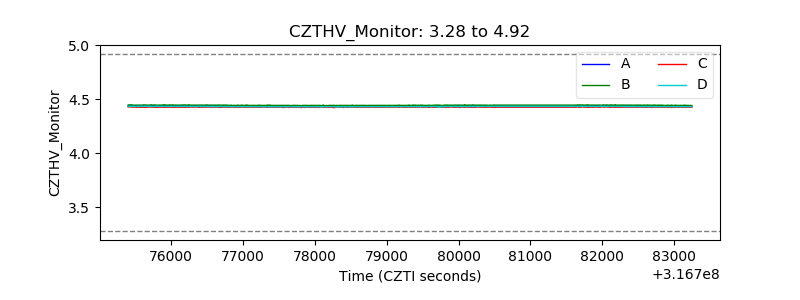 |
| D_VDD | 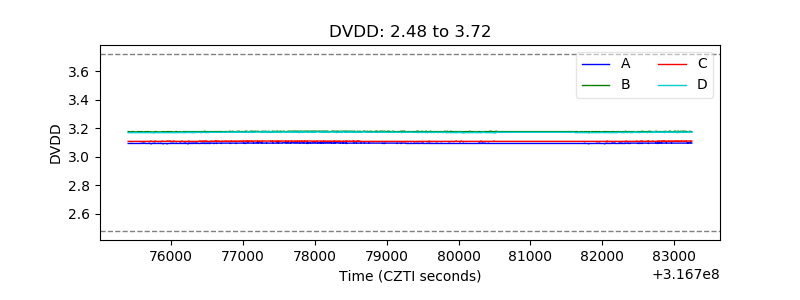 |
| Temperature 1 | 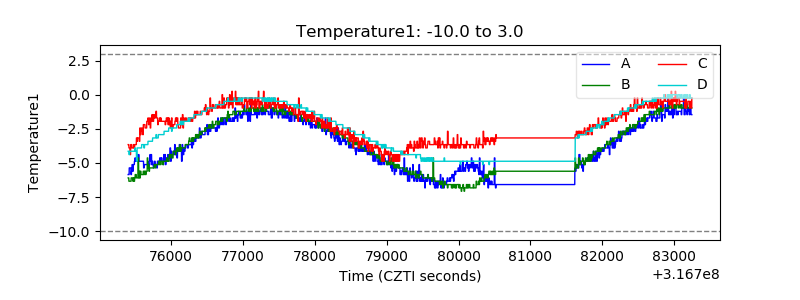 |
| Veto HV Monitor | 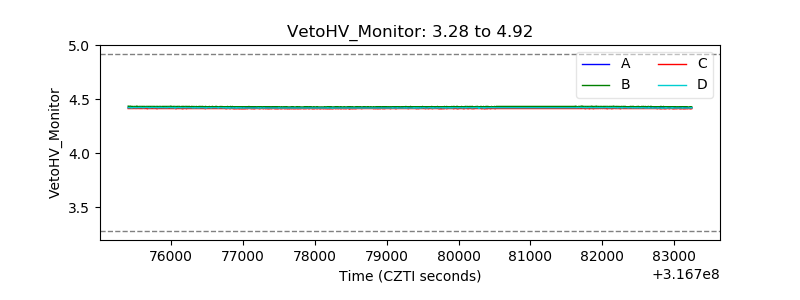 |
| Veto LLD | 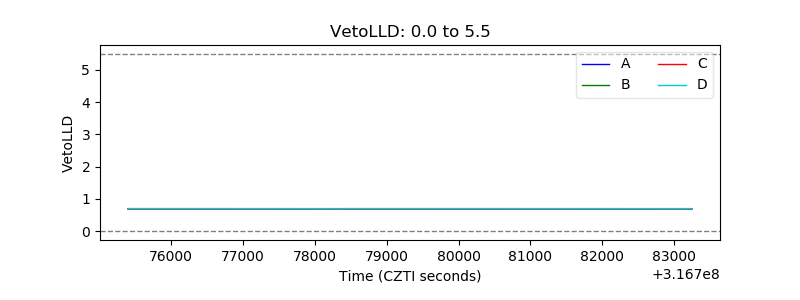 |
| Alpha Counter | 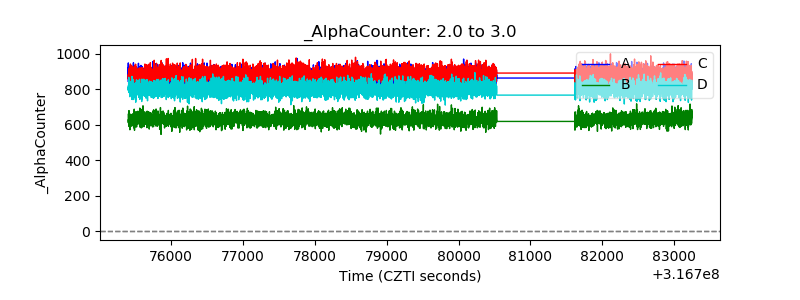 |
| _CPM_Rate | 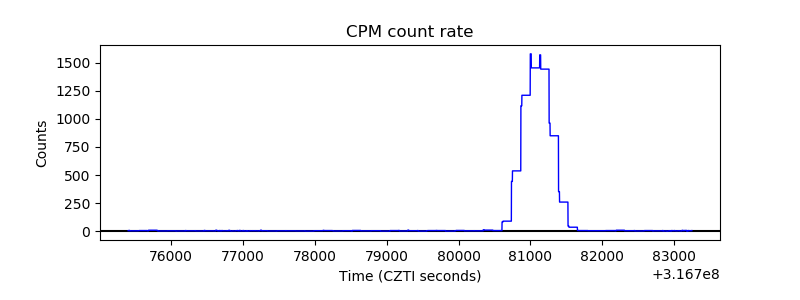 |
| CZT Counter | 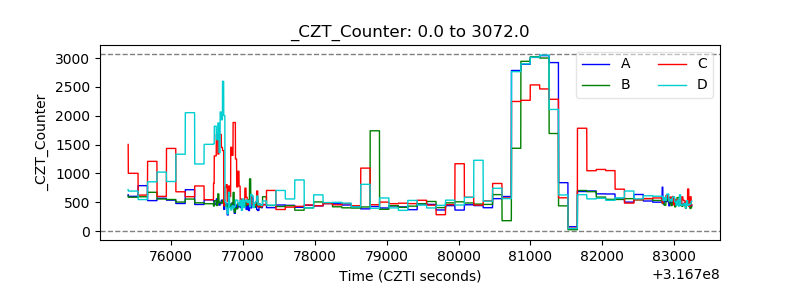 |
| +2.5 Volts monitor |  |
| +5 Volts monitor |  |
| _ROLL_ROT |  |
| _Roll_DEC | 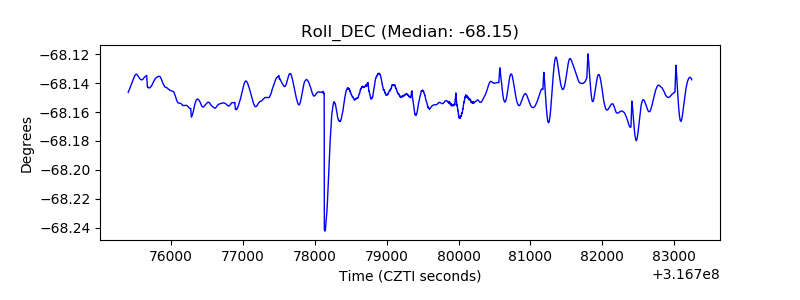 |
| _Roll_RA | 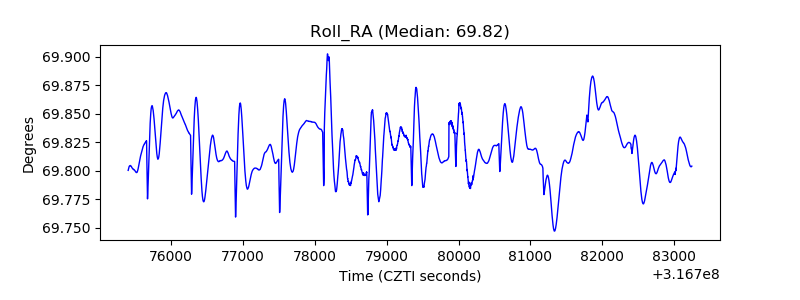 |
| Veto Counter | 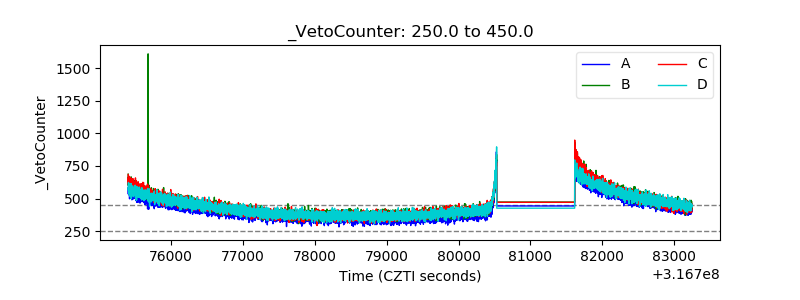 |