| Param | Original file | Final file |
|---|---|---|
| Filename | modeM0/AS1A08_004T02_9000003436_23244cztM0_level2.evt | modeM0/AS1A08_004T02_9000003436_23244cztM0_level2_quad_clean.evt |
| Size (bytes) | 470,364,480 | 132,177,600 |
| Size | 448.6 MB | 126.1 MB |
| Events in quadrant A | 3,139,989 | 918,917 |
| Events in quadrant B | 3,180,102 | 930,163 |
| Events in quadrant C | 3,554,436 | 865,515 |
| Events in quadrant D | 3,948,192 | 854,723 |
| Mode SS | |||
|---|---|---|---|
| Quadrant | BADHDUFLAG | Total packets | Discarded packets |
| A | 0 | 126 | 0 |
| B | 0 | 126 | 0 |
| C | 0 | 126 | 0 |
| D | 0 | 126 | 0 |
| Mode M0 | |||
|---|---|---|---|
| Quadrant | BADHDUFLAG | Total packets | Discarded packets |
| A | 0 | 13353 | 1 |
| B | 0 | 13417 | 1 |
| C | 0 | 14732 | 1 |
| D | 0 | 15806 | 1 |
| Mode M9 | |||
|---|---|---|---|
| Quadrant | BADHDUFLAG | Total packets | Discarded packets |
| A | 0 | 12 | 0 |
| B | 0 | 12 | 0 |
| C | 0 | 12 | 0 |
| D | 0 | 12 | 0 |
| Quadrant | Total seconds | Saturated seconds | Saturation percentage |
|---|---|---|---|
| A | 6222 | 49 | 0.787528% |
| B | 6223 | 50 | 0.803471% |
| C | 6223 | 215 | 3.454925% |
| D | 6223 | 108 | 1.735497% |
Noise dominated data is calculated using 1-second bins in cleaned event files. If a bin has >2000 counts, and if more than 50% of those come from <1% of pixels, then it is considered to be noise-dominated and hence unusable.
| Quadrant | # 1 sec bins | Bins with >0 counts | Bins with >2000 counts | High rate bins dominated by noise | Noise dominated (total time) | Noise dominated (detector-on time) | Marked lightcurve |
|---|---|---|---|---|---|---|---|
| A | 7417 | 6222 | 0 | 0 | 0.00% | 0.00% | 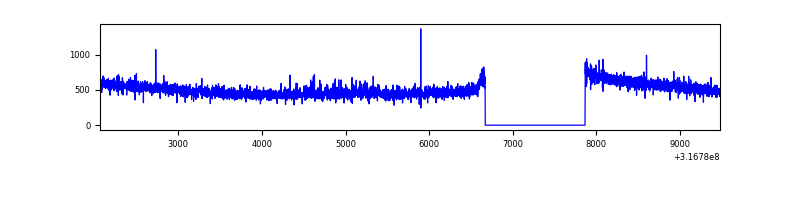 |
| B | 7418 | 6223 | 3 | 3 | 0.04% | 0.05% | 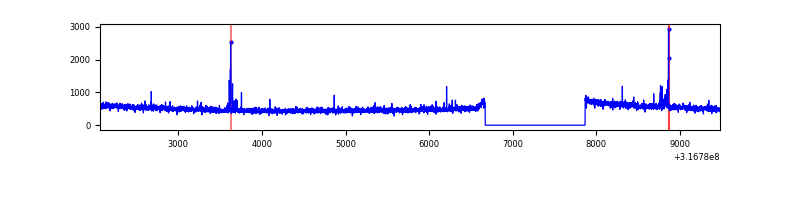 |
| C | 7418 | 6223 | 92 | 92 | 1.24% | 1.48% |  |
| D | 7418 | 6223 | 55 | 55 | 0.74% | 0.88% | 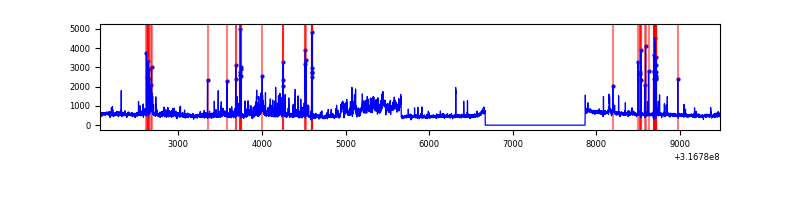 |
Top three noisy pixels from each quadrant. If the there are fewer than three noisy pixels in the level2.evt file, extra rows are filled as -1
| Pixel properties | Quadrant properties | ||||||
|---|---|---|---|---|---|---|---|
| Quadrant | DetID | PixID | Counts | Sigma | Mean | Median | Sigma |
| A | 6 | 16 | 28142 | 171.74 | 806 | 794 | 159.2 |
| A | 13 | 254 | 9710 | 55.99 | 806 | 794 | 159.2 |
| A | 0 | 226 | 7214 | 40.32 | 806 | 794 | 159.2 |
| B | 15 | 32 | 24463 | 160.91 | 797 | 780 | 147.2 |
| B | 0 | 228 | 18412 | 119.8 | 797 | 780 | 147.2 |
| B | 12 | 111 | 16763 | 108.59 | 797 | 780 | 147.2 |
| C | 3 | 233 | 295892 | 1708.27 | 749 | 754 | 172.8 |
| C | 14 | 238 | 122508 | 704.72 | 749 | 754 | 172.8 |
| C | 8 | 208 | 105086 | 603.88 | 749 | 754 | 172.8 |
| D | 7 | 238 | 423474 | 2305.45 | 769 | 746 | 183.4 |
| D | 1 | 52 | 175614 | 953.69 | 769 | 746 | 183.4 |
| D | 12 | 233 | 134806 | 731.13 | 769 | 746 | 183.4 |
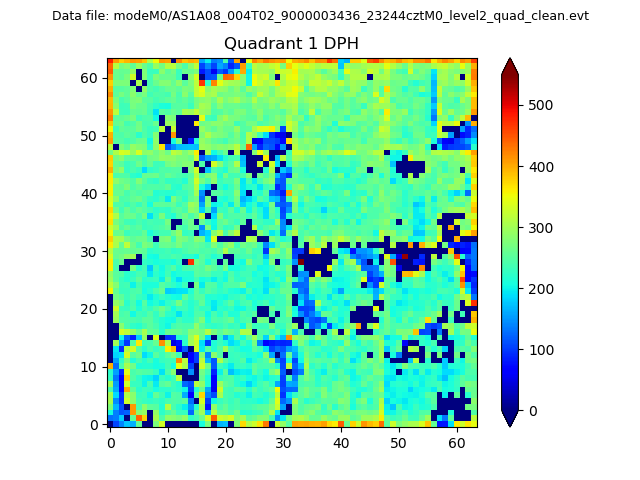
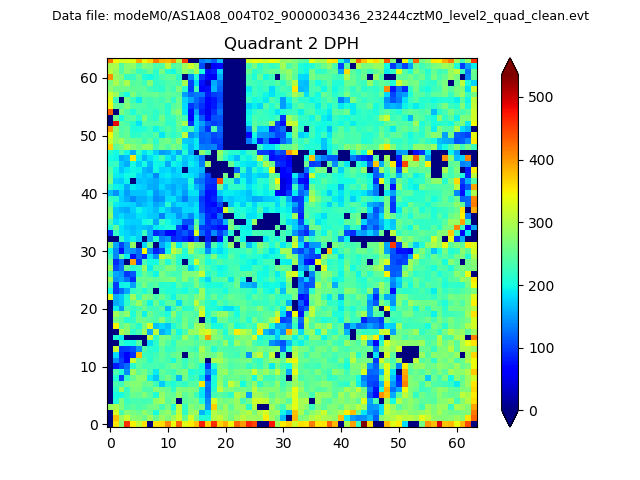
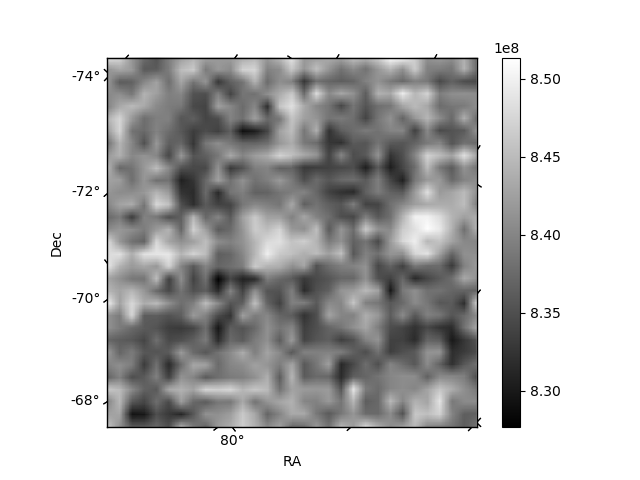
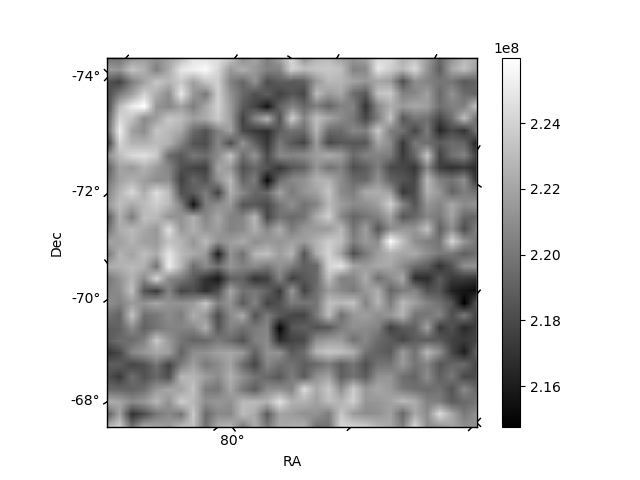
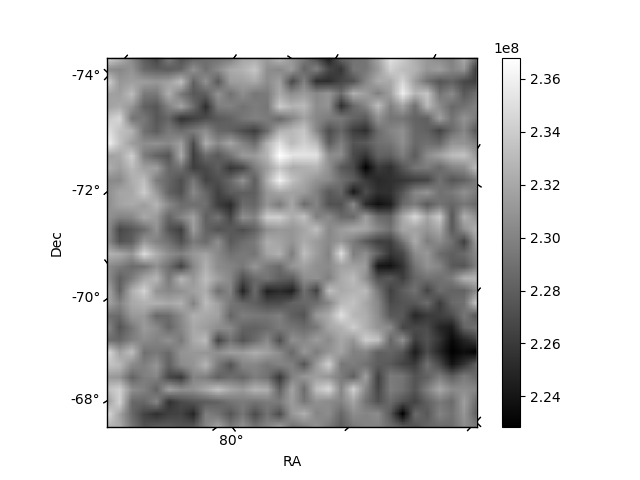
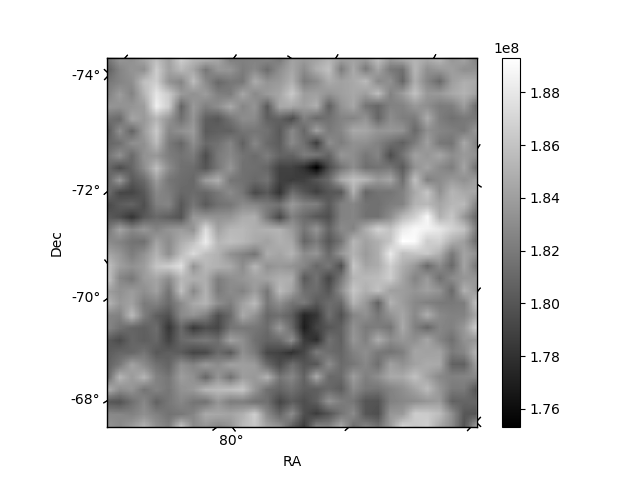
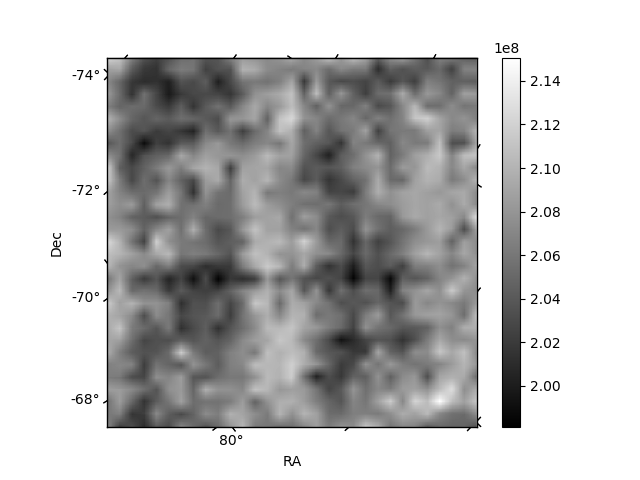
Histogram calculated using DETX and DETY for each event in the final _common_clean file
| Quadrant A | 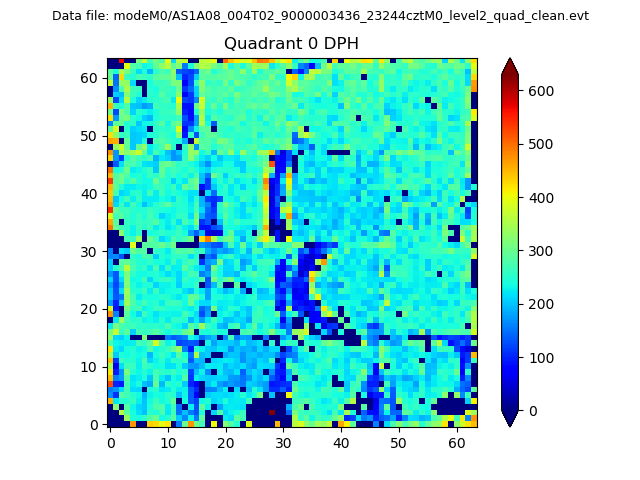 |
 |
Quadrant B |
|---|---|---|---|
| Quadrant D | 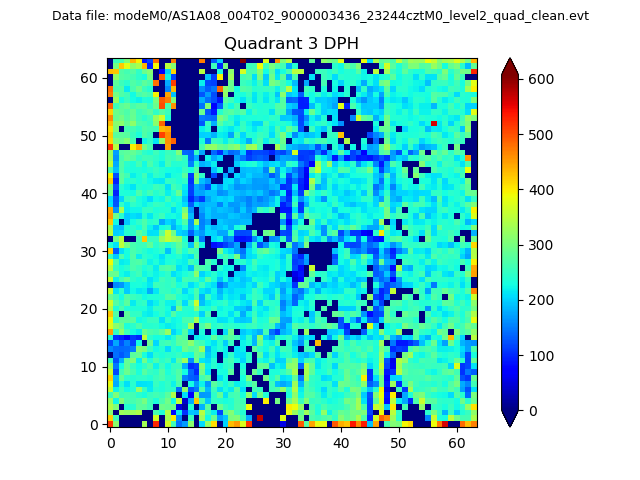 |
 |
Quadrant C |
| Plot type | Count rate plots | Images |
|---|---|---|
| Comparison with Poisson distribution Blue bars denote a histogram of data divided into 1 sec bins. Red curve is a Poisson curve with rate = median count rate of data. |
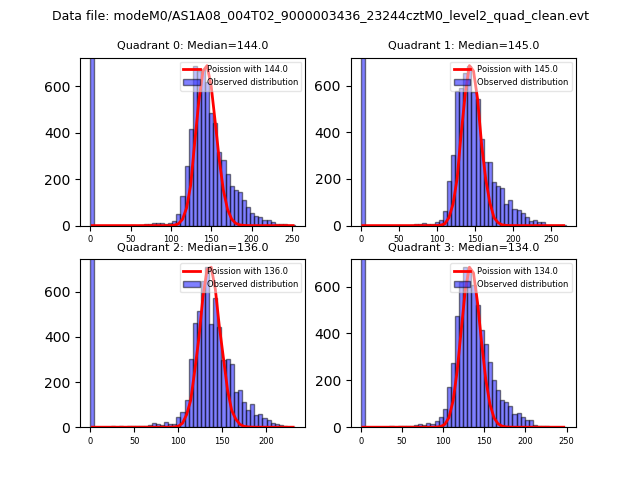 |
 |
| Quadrant-wise count rates Data is divided into 100 sec bins |
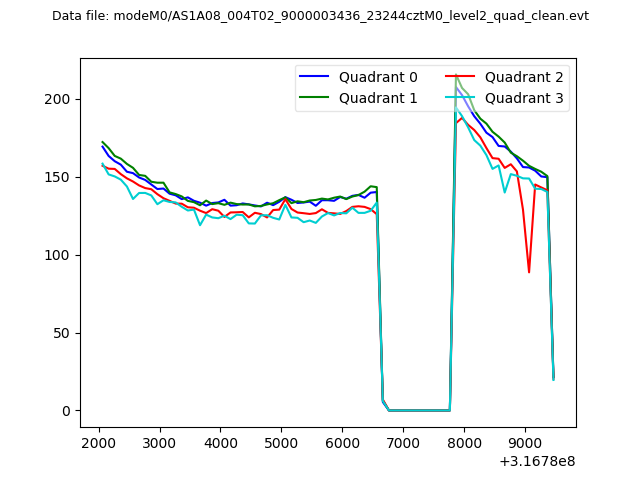 |
|
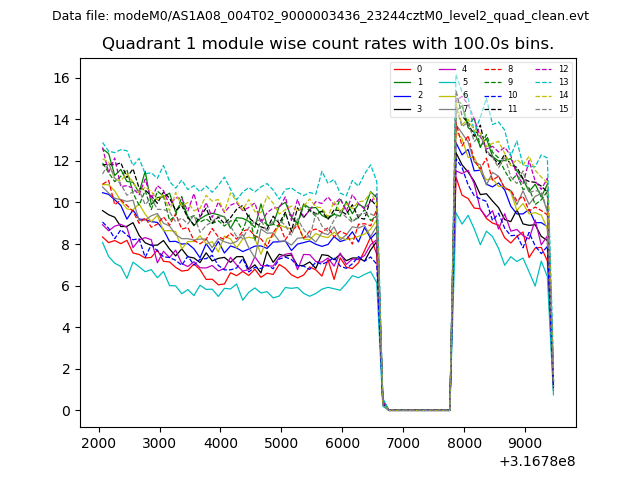
| Module-wise count rates for Quadrant A Data is divided into 100 sec bins |
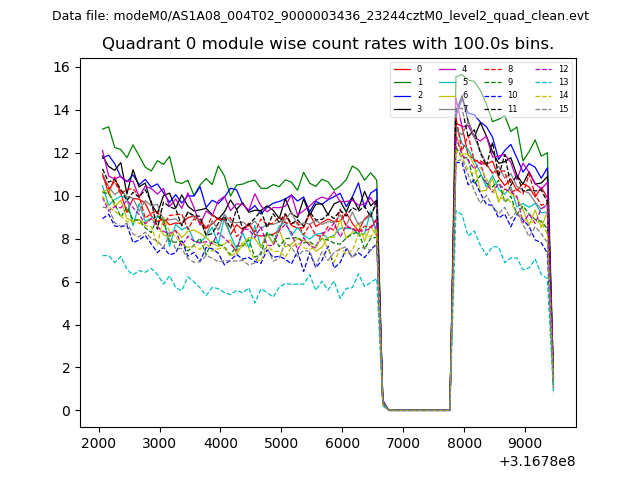 |
 |
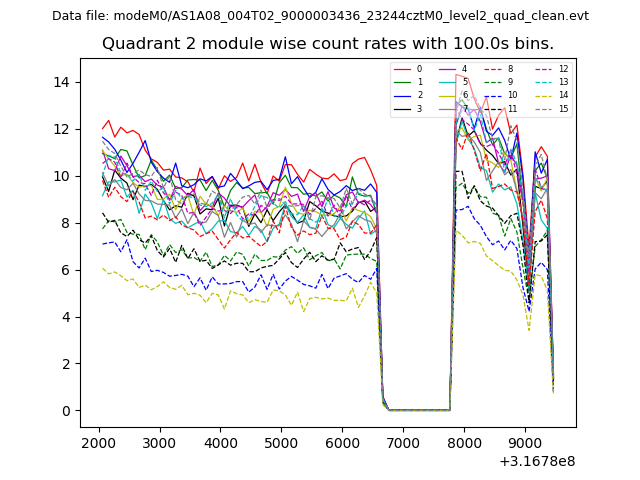
| Module-wise count rates for Quadrant B Data is divided into 100 sec bins |
 |
 |
| Module-wise count rates for Quadrant C Data is divided into 100 sec bins |
 |
 |
| Module-wise count rates for Quadrant D Data is divided into 100 sec bins |
 |
 |
| Parameter | Plot |
|---|---|
| CZT HV Monitor | 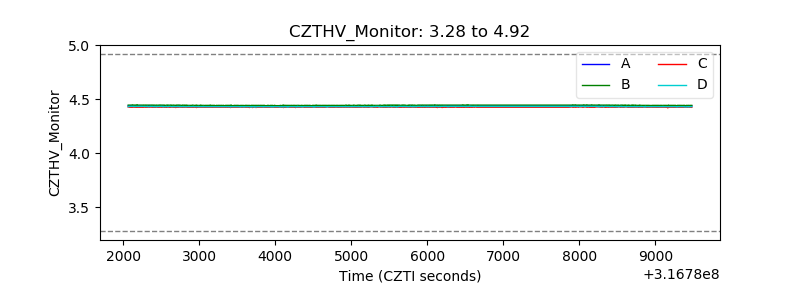 |
| D_VDD | 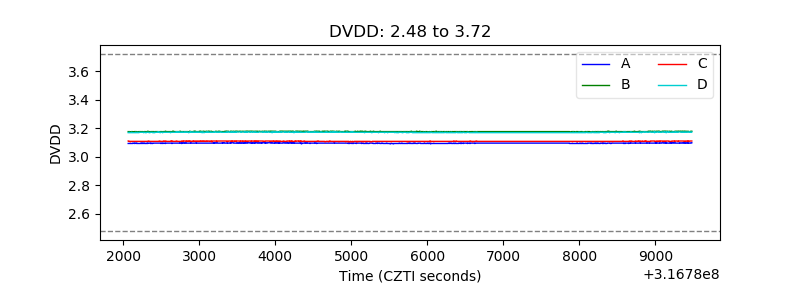 |
| Temperature 1 | 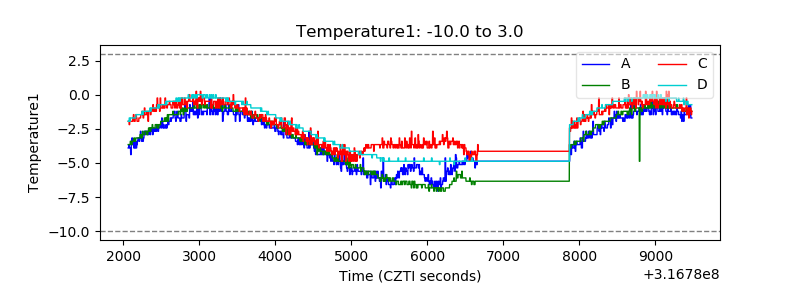 |
| Veto HV Monitor | 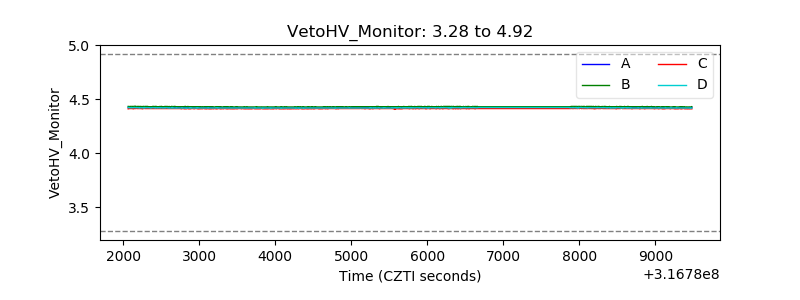 |
| Veto LLD | 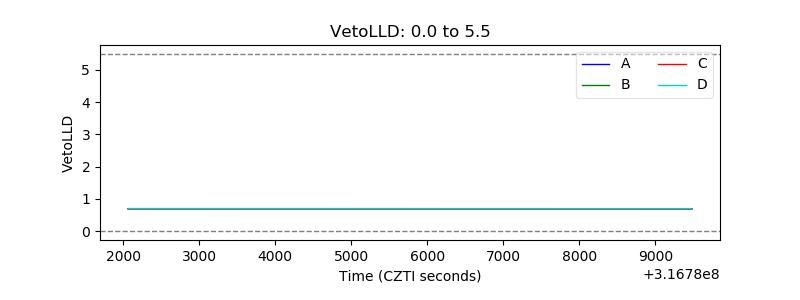 |
| Alpha Counter | 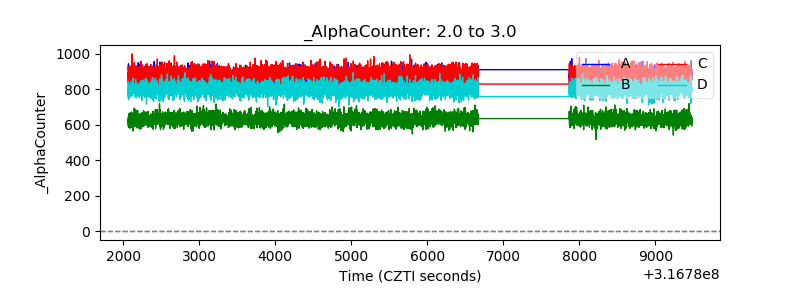 |
| _CPM_Rate | 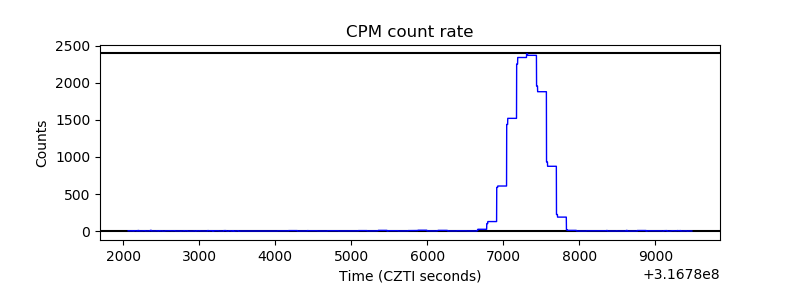 |
| CZT Counter | 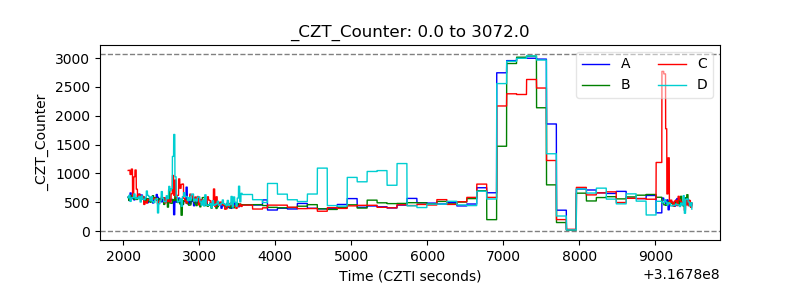 |
| +2.5 Volts monitor |  |
| +5 Volts monitor |  |
| _ROLL_ROT | 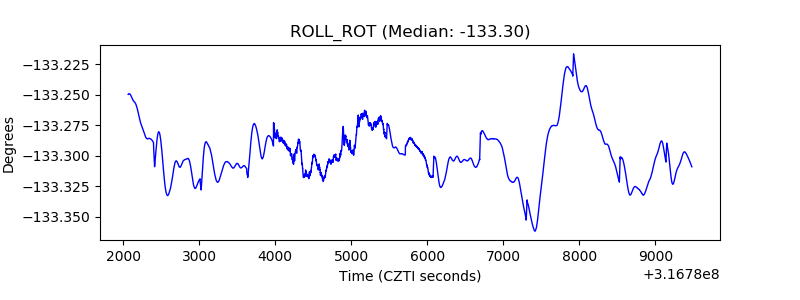 |
| _Roll_DEC | 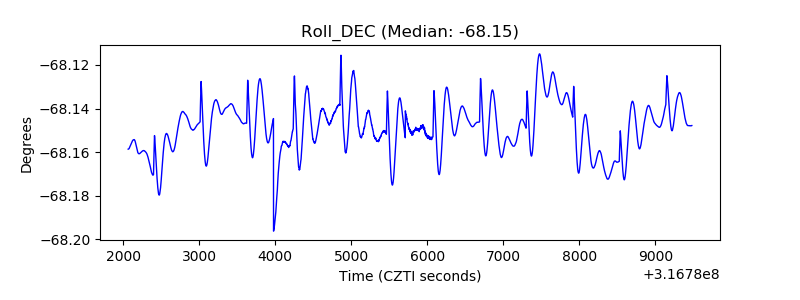 |
| _Roll_RA | 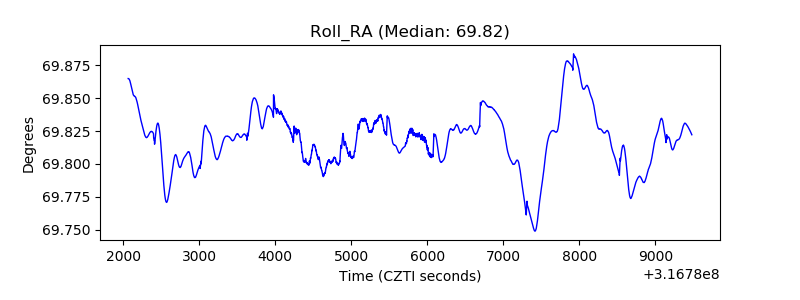 |
| Veto Counter |  |