| Param | Original file | Final file |
|---|---|---|
| Filename | modeM0/AS1A08_004T02_9000003436_23245cztM0_level2.evt | modeM0/AS1A08_004T02_9000003436_23245cztM0_level2_quad_clean.evt |
| Size (bytes) | 149,814,720 | 42,647,040 |
| Size | 142.9 MB | 40.7 MB |
| Events in quadrant A | 1,003,756 | 300,255 |
| Events in quadrant B | 1,021,306 | 303,948 |
| Events in quadrant C | 1,240,473 | 274,885 |
| Events in quadrant D | 1,142,726 | 276,225 |
| Mode SS | |||
|---|---|---|---|
| Quadrant | BADHDUFLAG | Total packets | Discarded packets |
| A | 0 | 36 | 0 |
| B | 0 | 36 | 0 |
| C | 0 | 36 | 0 |
| D | 0 | 36 | 0 |
| Mode M0 | |||
|---|---|---|---|
| Quadrant | BADHDUFLAG | Total packets | Discarded packets |
| A | 0 | 4168 | 0 |
| B | 0 | 4202 | 0 |
| C | 0 | 4929 | 0 |
| D | 0 | 4550 | 0 |
| Quadrant | Total seconds | Saturated seconds | Saturation percentage |
|---|---|---|---|
| A | 1865 | 2 | 0.107239% |
| B | 1865 | 7 | 0.375335% |
| C | 1865 | 108 | 5.790885% |
| D | 1866 | 38 | 2.036442% |
Noise dominated data is calculated using 1-second bins in cleaned event files. If a bin has >2000 counts, and if more than 50% of those come from <1% of pixels, then it is considered to be noise-dominated and hence unusable.
| Quadrant | # 1 sec bins | Bins with >0 counts | Bins with >2000 counts | High rate bins dominated by noise | Noise dominated (total time) | Noise dominated (detector-on time) | Marked lightcurve |
|---|---|---|---|---|---|---|---|
| A | 1865 | 1865 | 0 | 0 | 0.00% | 0.00% | 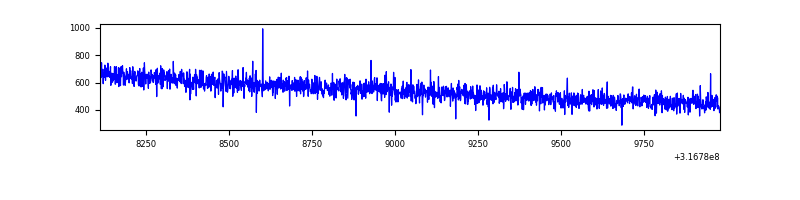 |
| B | 1865 | 1865 | 2 | 2 | 0.11% | 0.11% | 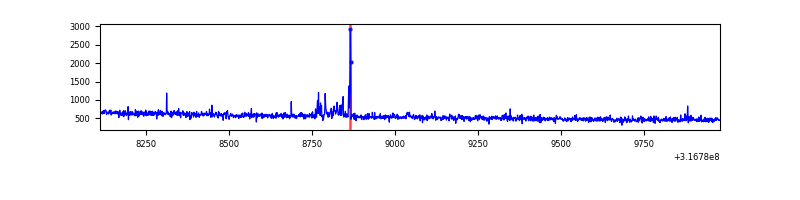 |
| C | 1865 | 1865 | 85 | 85 | 4.56% | 4.56% | 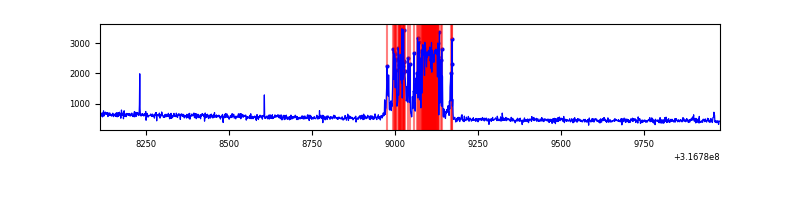 |
| D | 1866 | 1866 | 29 | 29 | 1.55% | 1.55% | 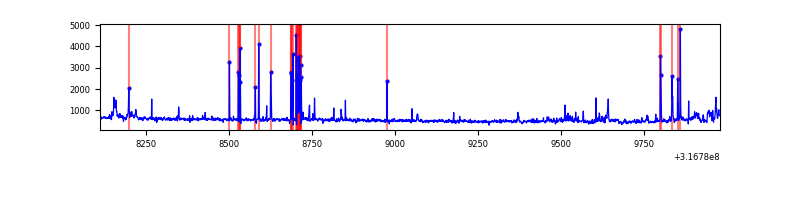 |
Top three noisy pixels from each quadrant. If the there are fewer than three noisy pixels in the level2.evt file, extra rows are filled as -1
| Pixel properties | Quadrant properties | ||||||
|---|---|---|---|---|---|---|---|
| Quadrant | DetID | PixID | Counts | Sigma | Mean | Median | Sigma |
| A | 6 | 16 | 3734 | 66.16 | 259 | 256 | 52.6 |
| A | 13 | 254 | 2942 | 51.09 | 259 | 256 | 52.6 |
| A | 0 | 226 | 2337 | 39.59 | 259 | 256 | 52.6 |
| B | 15 | 32 | 23282 | 468.03 | 253 | 248 | 49.2 |
| B | 12 | 111 | 4835 | 93.2 | 253 | 248 | 49.2 |
| B | 11 | 111 | 4466 | 85.71 | 253 | 248 | 49.2 |
| C | 3 | 233 | 286902 | 5256.56 | 232 | 234 | 54.5 |
| C | 14 | 238 | 38366 | 699.22 | 232 | 234 | 54.5 |
| C | 0 | 10 | 5249 | 91.96 | 232 | 234 | 54.5 |
| D | 1 | 52 | 81761 | 1365.75 | 244 | 237 | 59.7 |
| D | 7 | 238 | 39581 | 659.12 | 244 | 237 | 59.7 |
| D | 2 | 152 | 23880 | 396.08 | 244 | 237 | 59.7 |
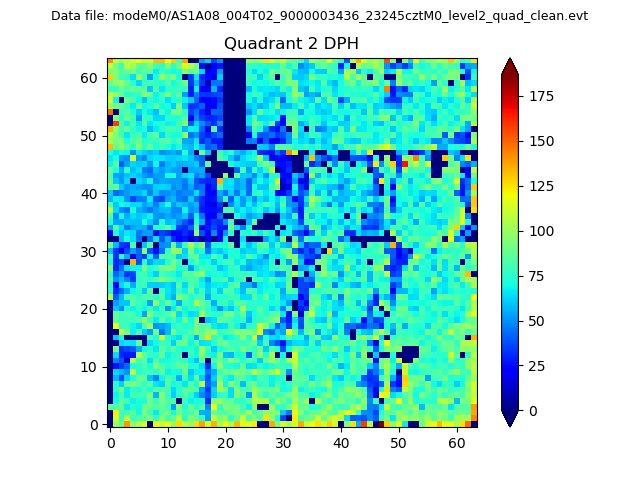
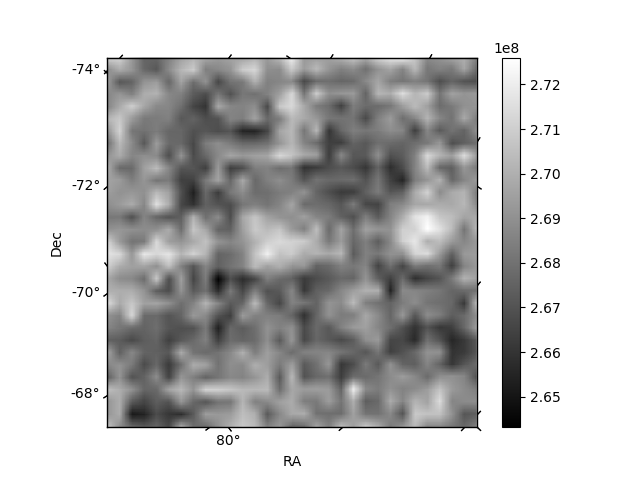
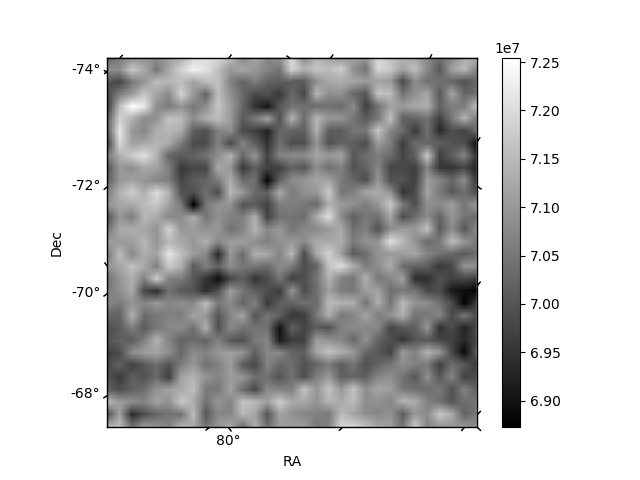
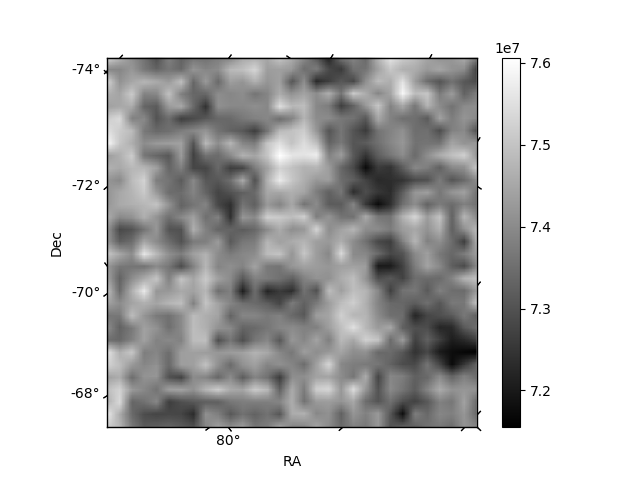
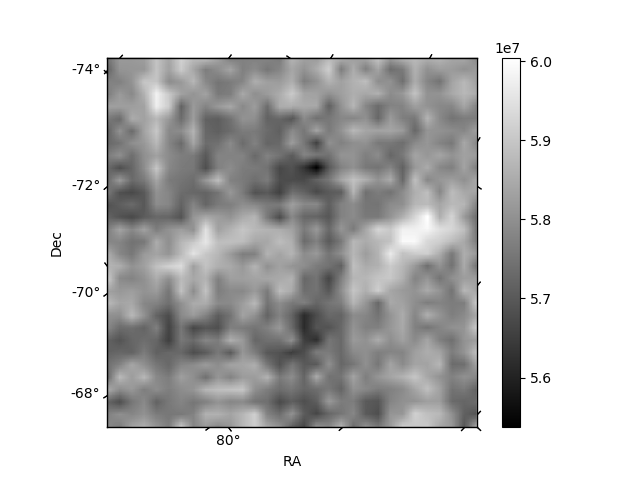
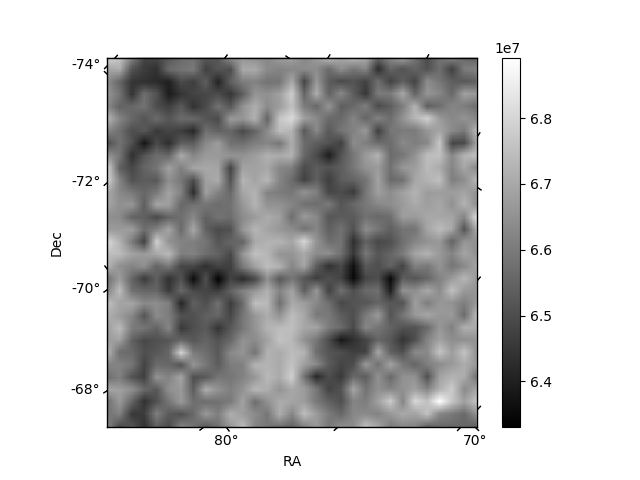
Histogram calculated using DETX and DETY for each event in the final _common_clean file
| Quadrant A | 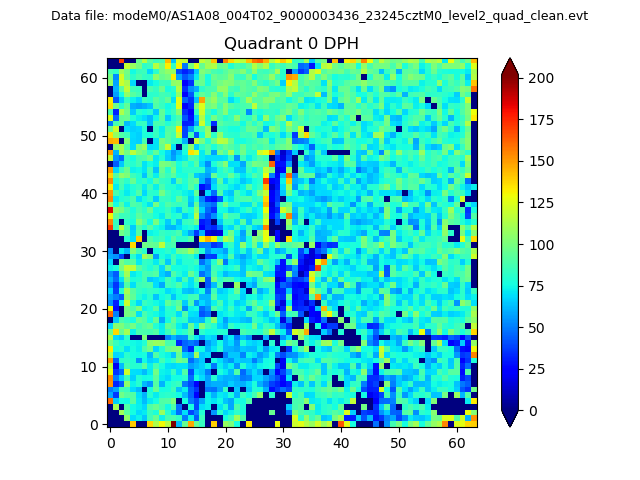 |
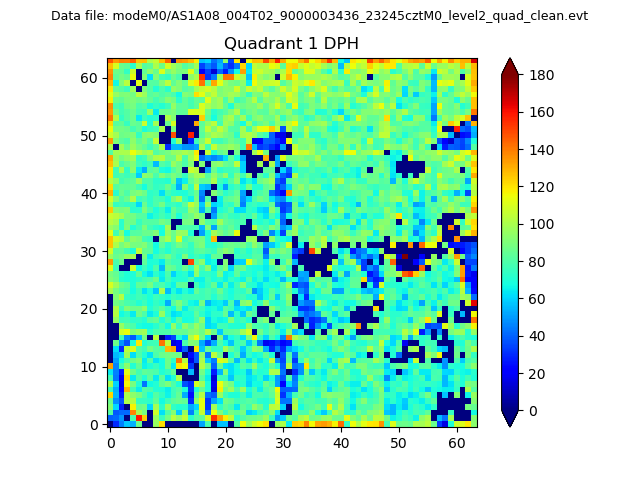 |
Quadrant B |
|---|---|---|---|
| Quadrant D | 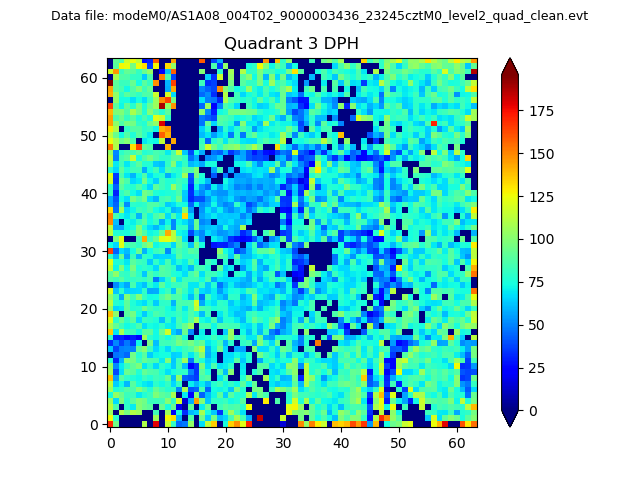 |
 |
Quadrant C |
| Plot type | Count rate plots | Images |
|---|---|---|
| Comparison with Poisson distribution Blue bars denote a histogram of data divided into 1 sec bins. Red curve is a Poisson curve with rate = median count rate of data. |
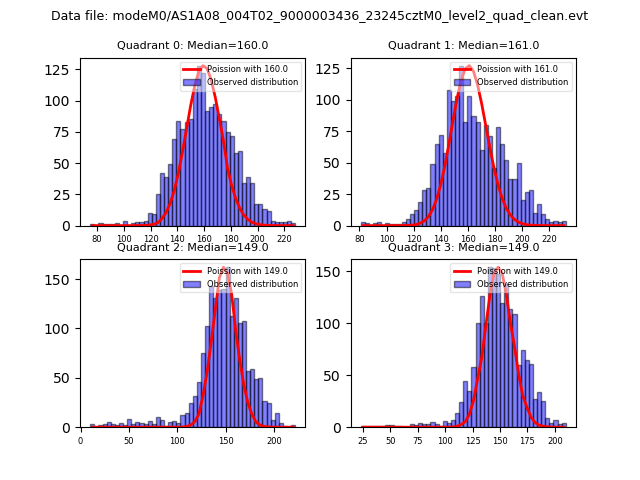 |
 |
| Quadrant-wise count rates Data is divided into 100 sec bins |
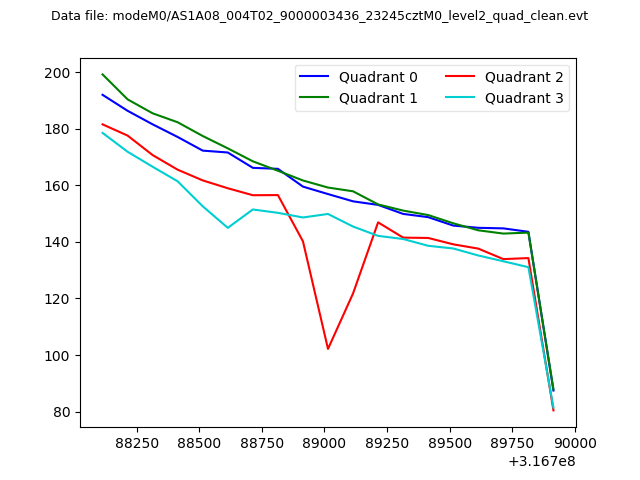 |
|
| Module-wise count rates for Quadrant A Data is divided into 100 sec bins |
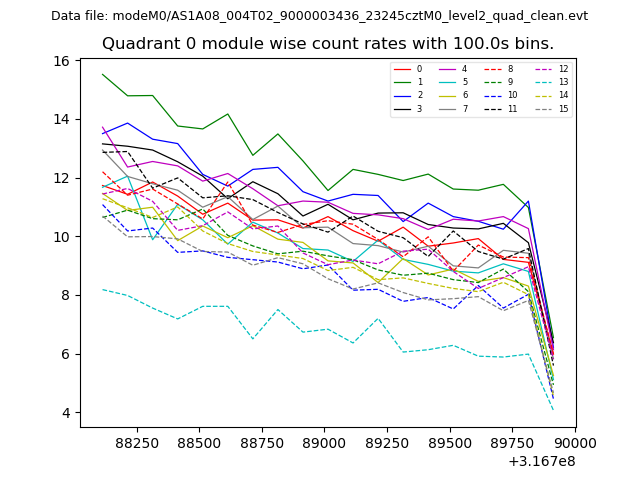 |
 |
| Module-wise count rates for Quadrant B Data is divided into 100 sec bins |
 |
 |
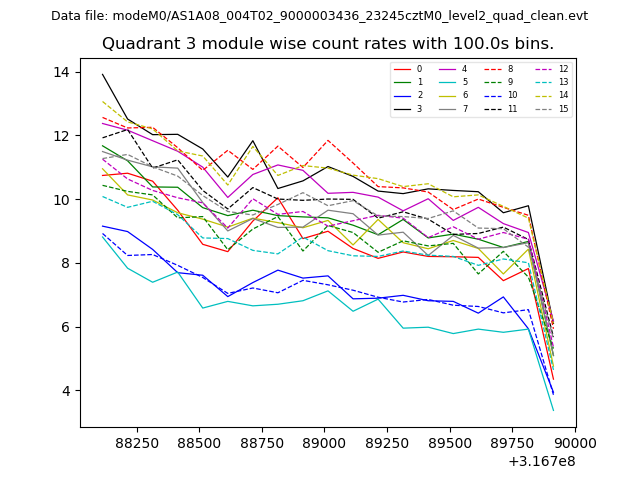
| Module-wise count rates for Quadrant C Data is divided into 100 sec bins |
 |
 |
| Module-wise count rates for Quadrant D Data is divided into 100 sec bins |
 |
 |
| Parameter | Plot |
|---|---|
| CZT HV Monitor | 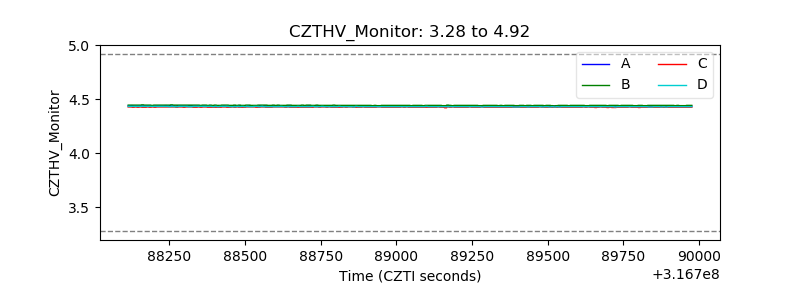 |
| D_VDD | 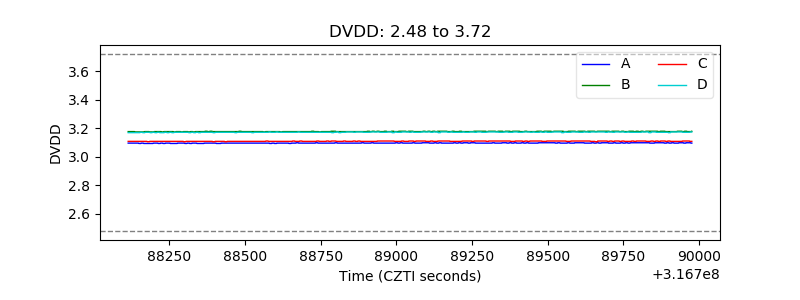 |
| Temperature 1 | 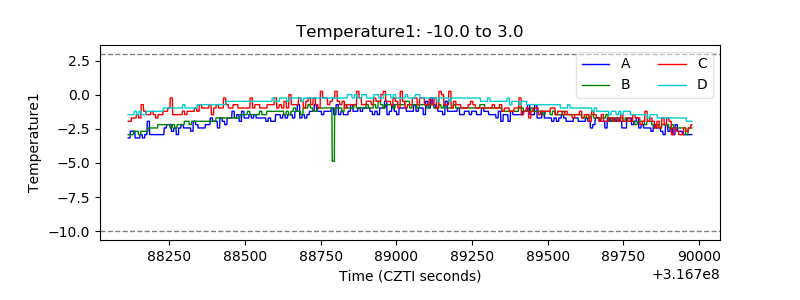 |
| Veto HV Monitor | 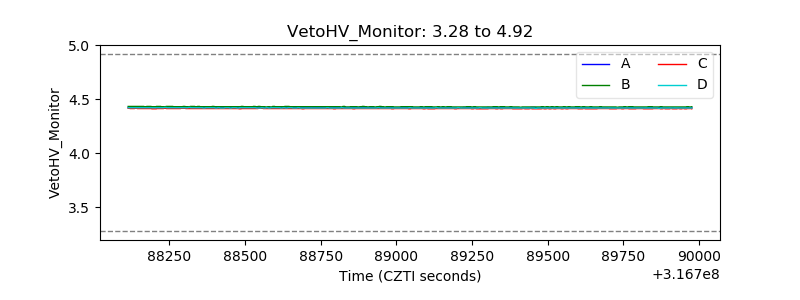 |
| Veto LLD | 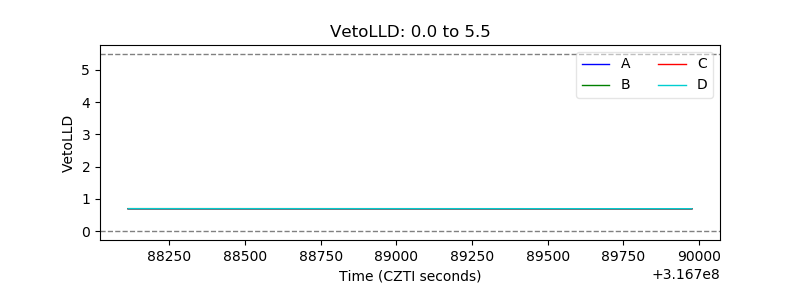 |
| Alpha Counter | 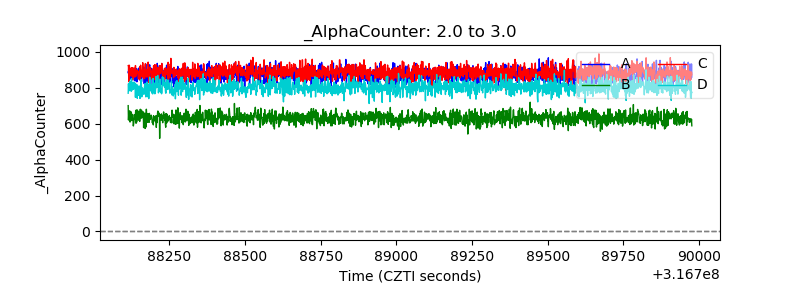 |
| _CPM_Rate | 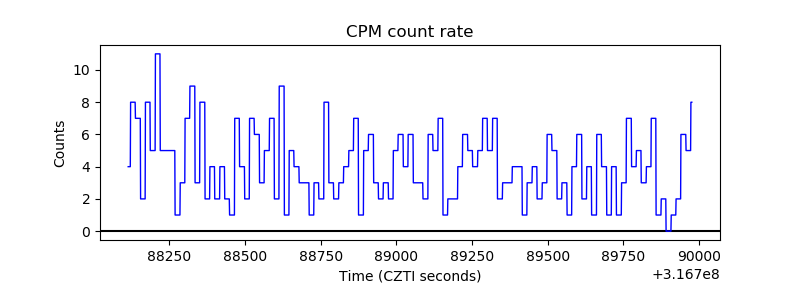 |
| CZT Counter | 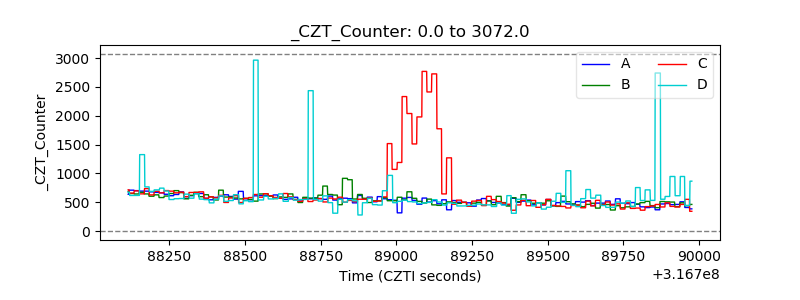 |
| +2.5 Volts monitor | 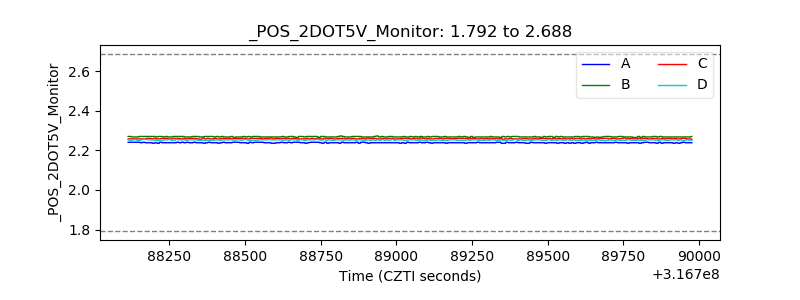 |
| +5 Volts monitor | 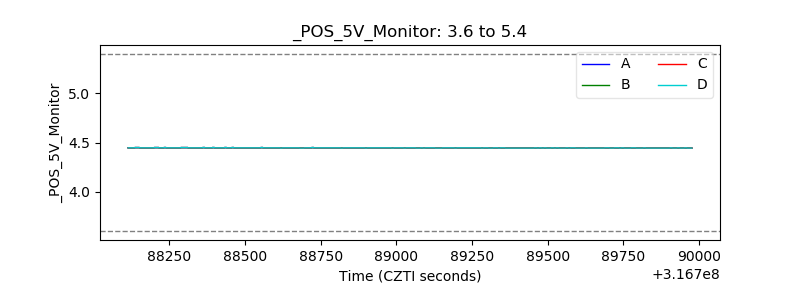 |
| _ROLL_ROT | 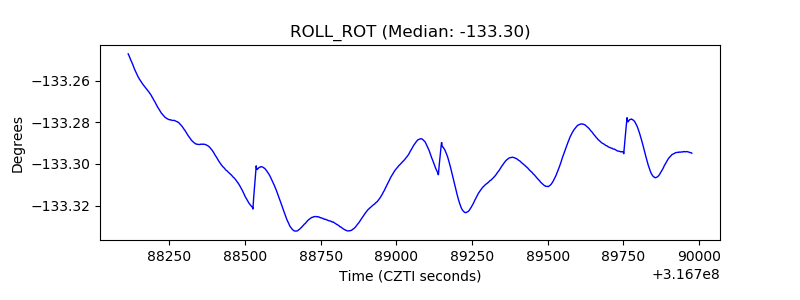 |
| _Roll_DEC | 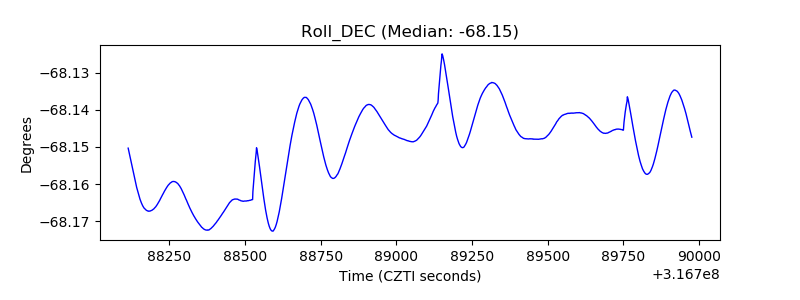 |
| _Roll_RA | 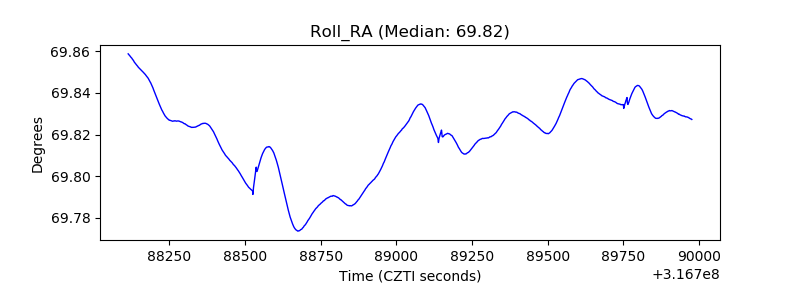 |
| Veto Counter | 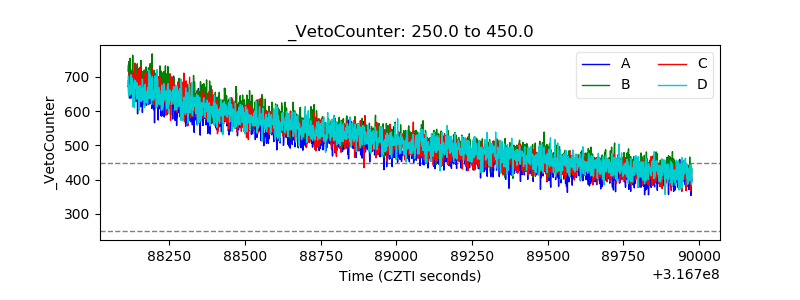 |