| Param | Original file | Final file |
|---|---|---|
| Filename | modeM0/AS1A08_004T03_9000003438cztM0_level2.fits | modeM0/AS1A08_004T03_9000003438cztM0_level2_quad_clean.evt |
| Size (bytes) | 270,069,120 | 118,753,920 |
| Size | 257.6 MB | 113.3 MB |
| Events in quadrant A | 1,736,880 | 519,777 |
| Events in quadrant B | 1,647,594 | 515,781 |
| Events in quadrant C | 1,674,800 | 487,803 |
| Events in quadrant D | 1,382,776 | 334,202 |
| Mode M9 | |||
|---|---|---|---|
| Quadrant | BADHDUFLAG | Total packets | Discarded packets |
| A | 0 | 231 | 0 |
| B | 0 | 231 | 0 |
| C | 0 | 75 | 0 |
| D | 0 | 234 | 0 |
| Mode M0 | |||
|---|---|---|---|
| Quadrant | BADHDUFLAG | Total packets | Discarded packets |
| A | 0 | 54009 | 0 |
| B | 0 | 54840 | 0 |
| C | 0 | 56612 | 0 |
| D | 0 | 78727 | 0 |
| Mode SS | |||
|---|---|---|---|
| Quadrant | BADHDUFLAG | Total packets | Discarded packets |
| A | 0 | 514 | 0 |
| B | 0 | 515 | 0 |
| C | 0 | 510 | 0 |
| D | 0 | 518 | 0 |
| Quadrant | Total seconds | Saturated seconds | Saturation percentage |
|---|---|---|---|
| A | 25360 | 326 | 1.285489% |
| B | 25299 | 465 | 1.838017% |
| C | 25344 | 627 | 2.473958% |
| D | 24945 | 2370 | 9.500902% |
Noise dominated data is calculated using 1-second bins in cleaned event files. If a bin has >2000 counts, and if more than 50% of those come from <1% of pixels, then it is considered to be noise-dominated and hence unusable.
| Quadrant | # 1 sec bins | Bins with >0 counts | Bins with >2000 counts | High rate bins dominated by noise | Noise dominated (total time) | Noise dominated (detector-on time) | Marked lightcurve |
|---|---|---|---|---|---|---|---|
| A | 153425 | 25747 | 0 | 0 | 0.00% | 0.00% |  |
| B | 153424 | 25667 | 0 | 0 | 0.00% | 0.00% | 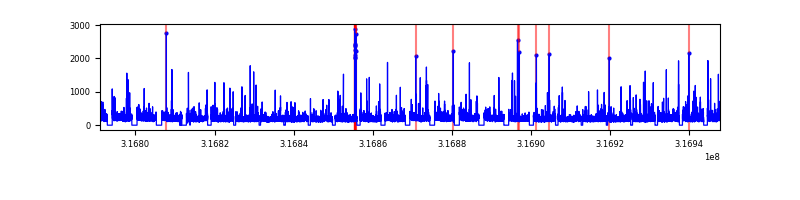 |
| C | 153424 | 25686 | 0 | 0 | 0.00% | 0.00% |  |
| D | 153424 | 25059 | 0 | 0 | 0.00% | 0.00% |  |
Top three noisy pixels from each quadrant. If the there are fewer than three noisy pixels in the level2.evt file, extra rows are filled as -1
| Pixel properties | Quadrant properties | ||||||
|---|---|---|---|---|---|---|---|
| Quadrant | DetID | PixID | Counts | Sigma | Mean | Median | Sigma |
| A | 0 | 29 | 1706 | 11.62 | 452 | 429 | 109.9 |
| A | 7 | 110 | 1375 | 8.61 | 452 | 429 | 109.9 |
| A | 9 | 19 | 1314 | 8.06 | 452 | 429 | 109.9 |
| B | 2 | 9 | 1268 | 9.9 | 437 | 421 | 85.5 |
| B | 5 | 128 | 1095 | 7.88 | 437 | 421 | 85.5 |
| B | 2 | 8 | 1061 | 7.48 | 437 | 421 | 85.5 |
| C | 1 | 80 | 1311 | 7.91 | 442 | 419 | 112.7 |
| C | 1 | 81 | 1296 | 7.78 | 442 | 419 | 112.7 |
| C | 3 | 126 | 1184 | 6.79 | 442 | 419 | 112.7 |
| D | 7 | 3 | 997 | 6.01 | 395 | 363 | 105.5 |
| D | 10 | 189 | 977 | 5.82 | 395 | 363 | 105.5 |
| D | 6 | 231 | 965 | 5.71 | 395 | 363 | 105.5 |
Histogram calculated using DETX and DETY for each event in the final _common_clean file
| Quadrant A |  |
 |
Quadrant B |
|---|---|---|---|
| Quadrant D |  |
 |
Quadrant C |
| Plot type | Count rate plots | Images |
|---|---|---|
| Comparison with Poisson distribution Blue bars denote a histogram of data divided into 1 sec bins. Red curve is a Poisson curve with rate = median count rate of data. |
 |
 |
| Quadrant-wise count rates Data is divided into 100 sec bins |
 |
|
| Module-wise count rates for Quadrant A Data is divided into 100 sec bins |
 |
 |
| Module-wise count rates for Quadrant B Data is divided into 100 sec bins |
 |
 |
| Module-wise count rates for Quadrant C Data is divided into 100 sec bins |
 |
 |
| Module-wise count rates for Quadrant D Data is divided into 100 sec bins |
 |
 |
| Parameter | Plot |
|---|---|
| CZT HV Monitor | 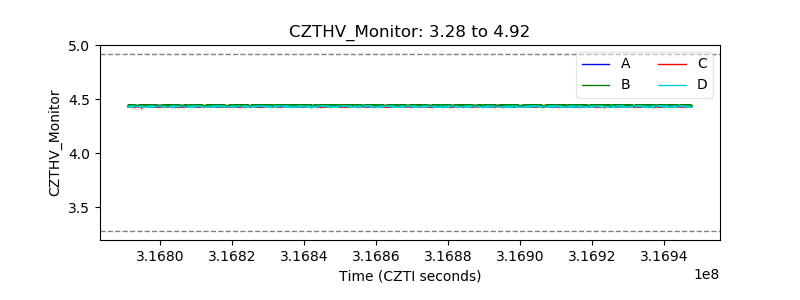 |
| D_VDD | 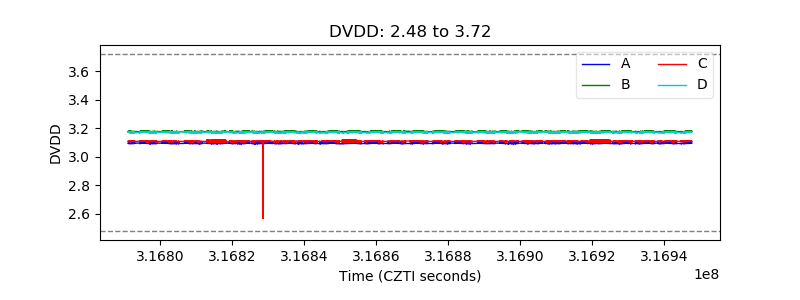 |
| Temperature 1 |  |
| Veto HV Monitor | 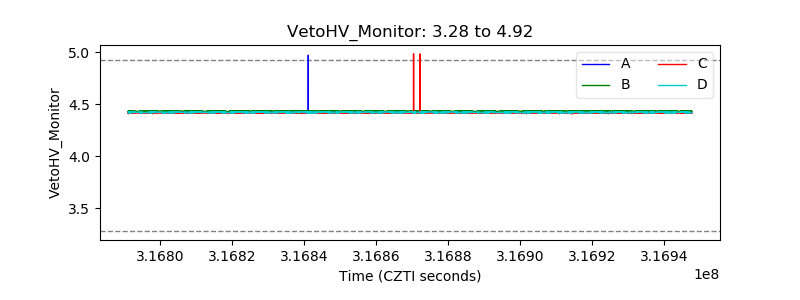 |
| Veto LLD | 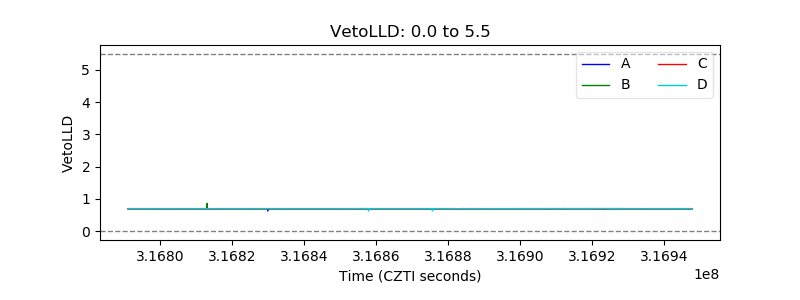 |
| Alpha Counter |  |
| _CPM_Rate |  |
| CZT Counter |  |
| +2.5 Volts monitor |  |
| +5 Volts monitor |  |
| _ROLL_ROT | 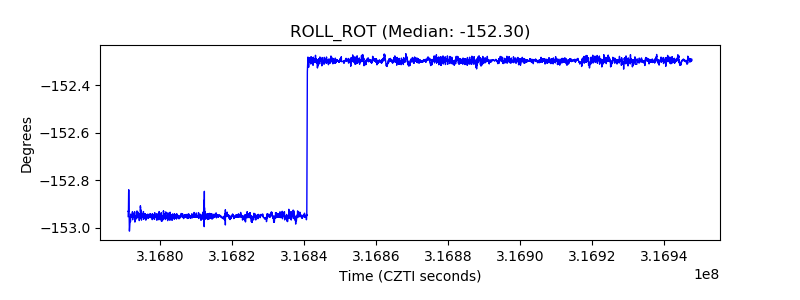 |
| _Roll_DEC |  |
| _Roll_RA |  |
| Veto Counter |  |