| Param | Original file | Final file |
|---|---|---|
| Filename | modeM0/AS1A08_004T03_9000003438_23245cztM0_level2.evt | modeM0/AS1A08_004T03_9000003438_23245cztM0_level2_quad_clean.evt |
| Size (bytes) | 252,256,320 | 38,741,760 |
| Size | 240.6 MB | 36.9 MB |
| Events in quadrant A | 1,765,368 | 243,734 |
| Events in quadrant B | 1,792,333 | 248,532 |
| Events in quadrant C | 1,775,317 | 228,226 |
| Events in quadrant D | 2,084,589 | 221,742 |
| Mode M9 | |||
|---|---|---|---|
| Quadrant | BADHDUFLAG | Total packets | Discarded packets |
| A | 0 | 13 | 0 |
| B | 0 | 13 | 0 |
| C | 0 | 13 | 0 |
| D | 0 | 13 | 0 |
| Mode M0 | |||
|---|---|---|---|
| Quadrant | BADHDUFLAG | Total packets | Discarded packets |
| A | 0 | 7180 | 1 |
| B | 0 | 7244 | 1 |
| C | 0 | 7110 | 1 |
| D | 0 | 8269 | 1 |
| Mode SS | |||
|---|---|---|---|
| Quadrant | BADHDUFLAG | Total packets | Discarded packets |
| A | 0 | 66 | 0 |
| B | 0 | 66 | 0 |
| C | 0 | 66 | 0 |
| D | 0 | 66 | 0 |
| Quadrant | Total seconds | Saturated seconds | Saturation percentage |
|---|---|---|---|
| A | 3247 | 69 | 2.125038% |
| B | 3247 | 78 | 2.402217% |
| C | 3247 | 95 | 2.925778% |
| D | 3247 | 120 | 3.695719% |
Noise dominated data is calculated using 1-second bins in cleaned event files. If a bin has >2000 counts, and if more than 50% of those come from <1% of pixels, then it is considered to be noise-dominated and hence unusable.
| Quadrant | # 1 sec bins | Bins with >0 counts | Bins with >2000 counts | High rate bins dominated by noise | Noise dominated (total time) | Noise dominated (detector-on time) | Marked lightcurve |
|---|---|---|---|---|---|---|---|
| A | 4507 | 3247 | 0 | 0 | 0.00% | 0.00% | 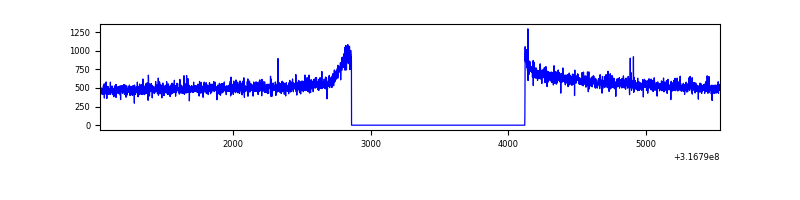 |
| B | 4507 | 3247 | 2 | 2 | 0.04% | 0.06% | 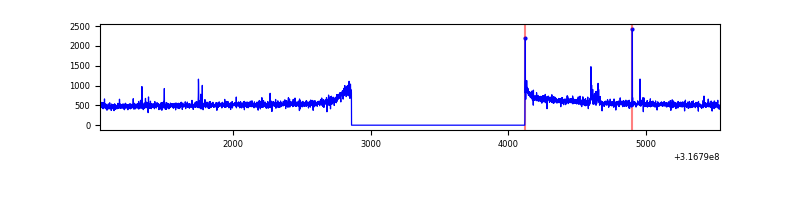 |
| C | 4507 | 3247 | 2 | 2 | 0.04% | 0.06% | 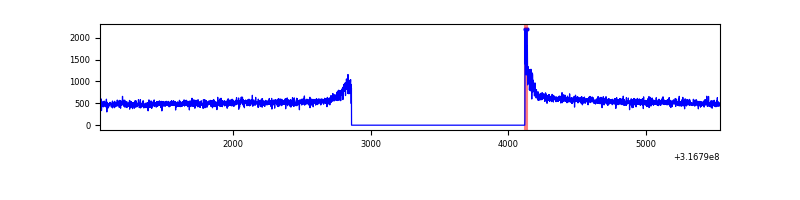 |
| D | 4507 | 3247 | 57 | 57 | 1.26% | 1.76% | 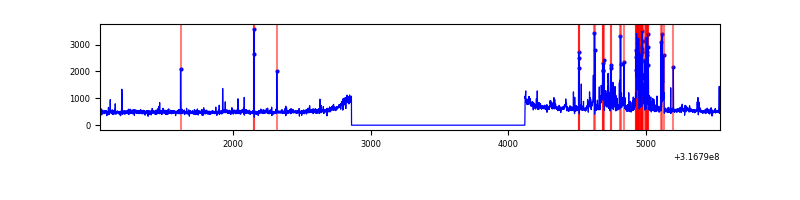 |
Top three noisy pixels from each quadrant. If the there are fewer than three noisy pixels in the level2.evt file, extra rows are filled as -1
| Pixel properties | Quadrant properties | ||||||
|---|---|---|---|---|---|---|---|
| Quadrant | DetID | PixID | Counts | Sigma | Mean | Median | Sigma |
| A | 6 | 16 | 10279 | 106.33 | 455 | 446 | 92.5 |
| A | 13 | 254 | 4995 | 49.19 | 455 | 446 | 92.5 |
| A | 0 | 226 | 4010 | 38.54 | 455 | 446 | 92.5 |
| B | 0 | 190 | 16613 | 190.07 | 450 | 441 | 85.1 |
| B | 12 | 111 | 9799 | 109.99 | 450 | 441 | 85.1 |
| B | 11 | 111 | 8534 | 95.12 | 450 | 441 | 85.1 |
| C | 14 | 238 | 68022 | 671.22 | 426 | 429 | 100.7 |
| C | 0 | 10 | 38627 | 379.32 | 426 | 429 | 100.7 |
| C | 7 | 247 | 4409 | 39.52 | 426 | 429 | 100.7 |
| D | 1 | 52 | 309288 | 2946.63 | 435 | 425 | 104.8 |
| D | 7 | 238 | 68416 | 648.65 | 435 | 425 | 104.8 |
| D | 1 | 239 | 20375 | 190.33 | 435 | 425 | 104.8 |
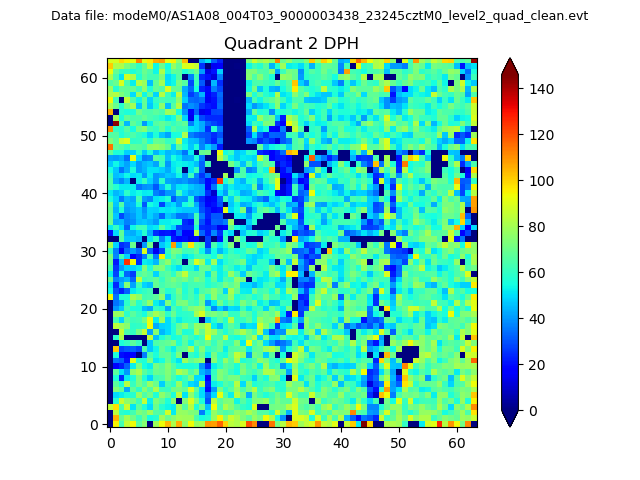
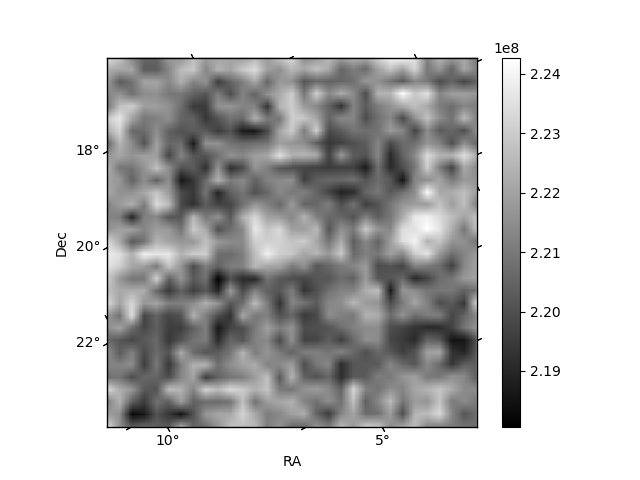
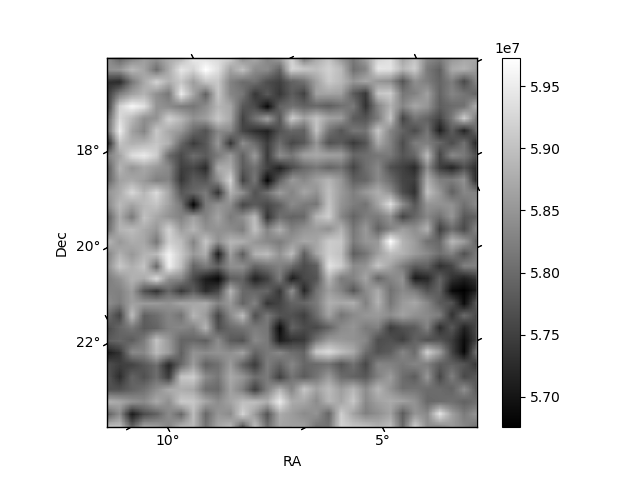
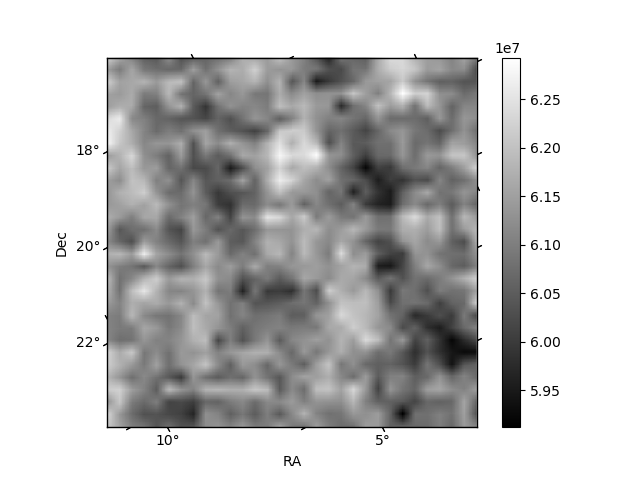
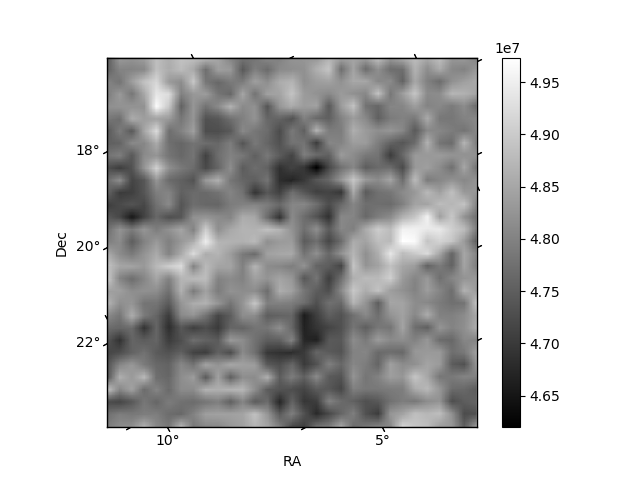
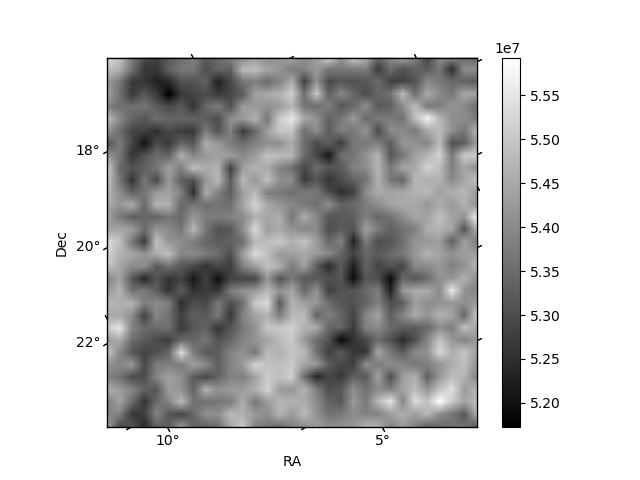
Histogram calculated using DETX and DETY for each event in the final _common_clean file
| Quadrant A | 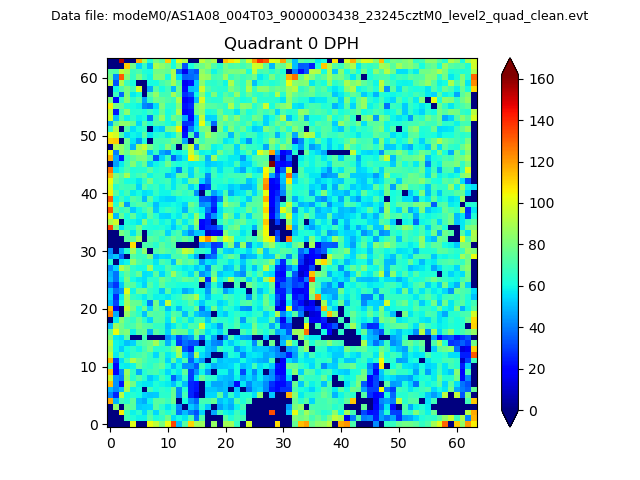 |
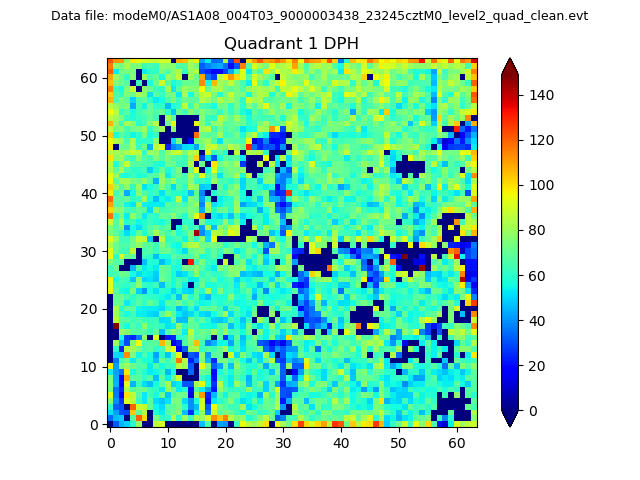 |
Quadrant B |
|---|---|---|---|
| Quadrant D | 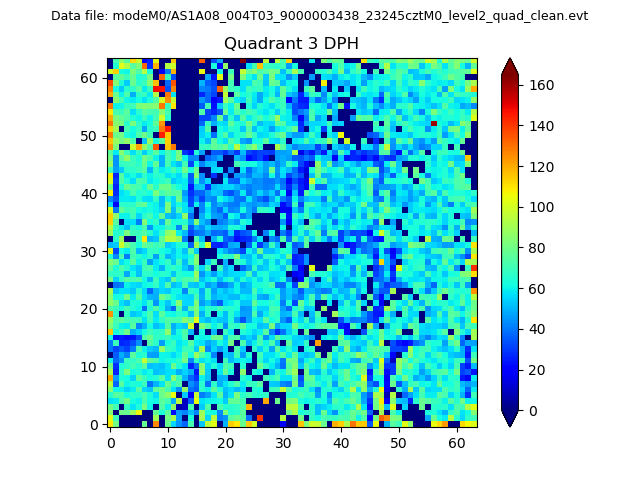 |
 |
Quadrant C |
| Plot type | Count rate plots | Images |
|---|---|---|
| Comparison with Poisson distribution Blue bars denote a histogram of data divided into 1 sec bins. Red curve is a Poisson curve with rate = median count rate of data. |
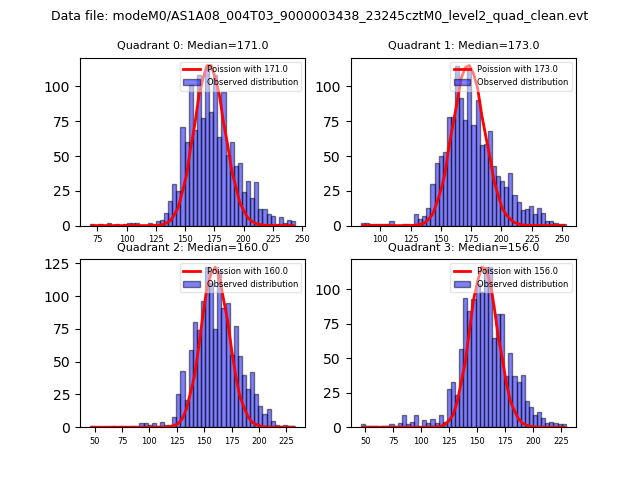 |
 |
| Quadrant-wise count rates Data is divided into 100 sec bins |
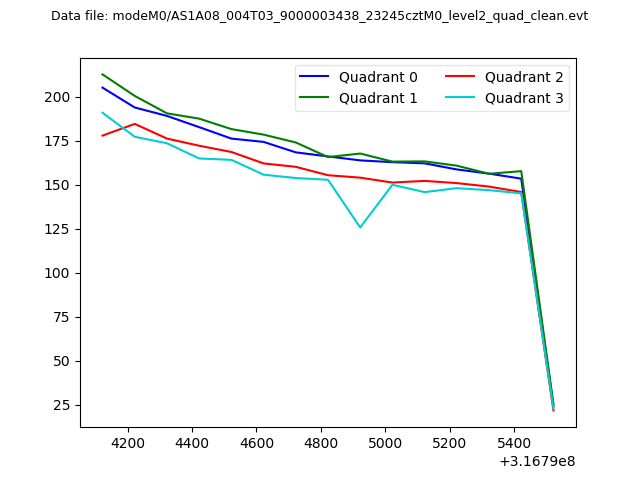 |
|
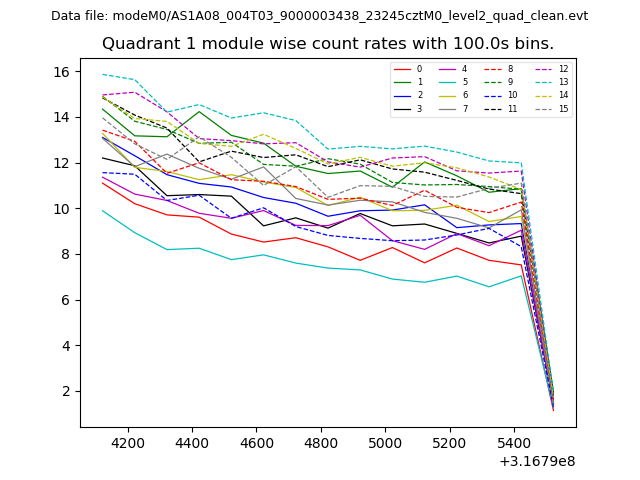
| Module-wise count rates for Quadrant A Data is divided into 100 sec bins |
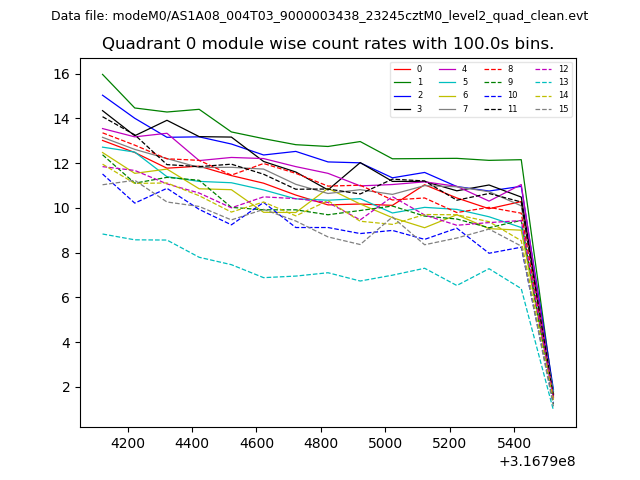 |
 |
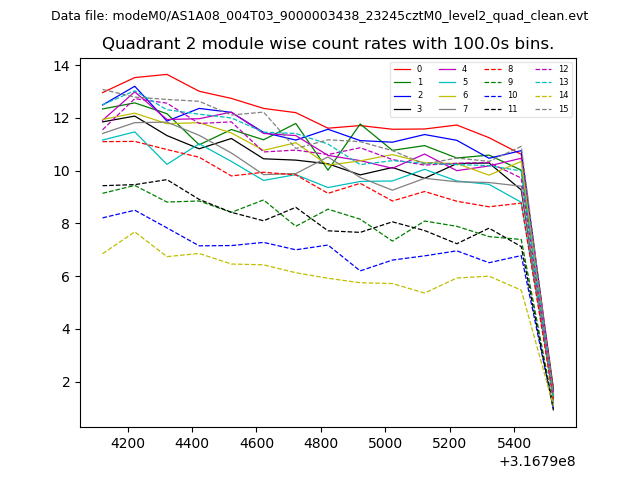
| Module-wise count rates for Quadrant B Data is divided into 100 sec bins |
 |
 |
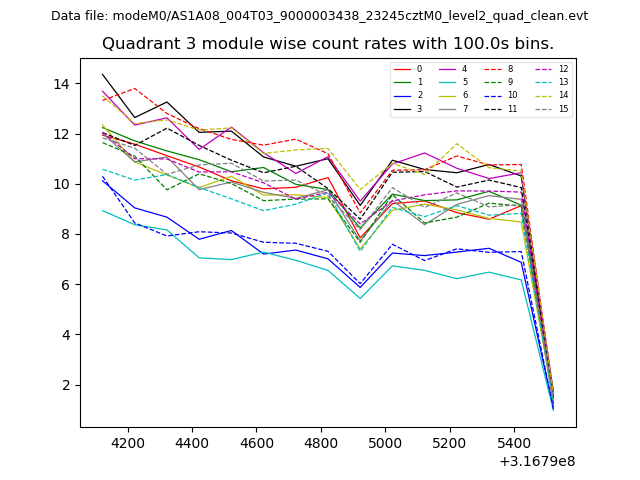
| Module-wise count rates for Quadrant C Data is divided into 100 sec bins |
 |
 |
| Module-wise count rates for Quadrant D Data is divided into 100 sec bins |
 |
 |
| Parameter | Plot |
|---|---|
| CZT HV Monitor | 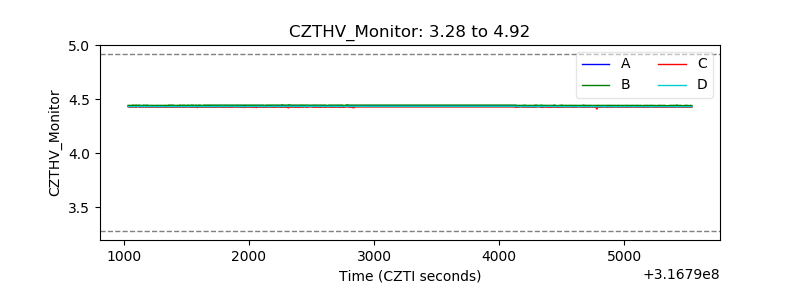 |
| D_VDD | 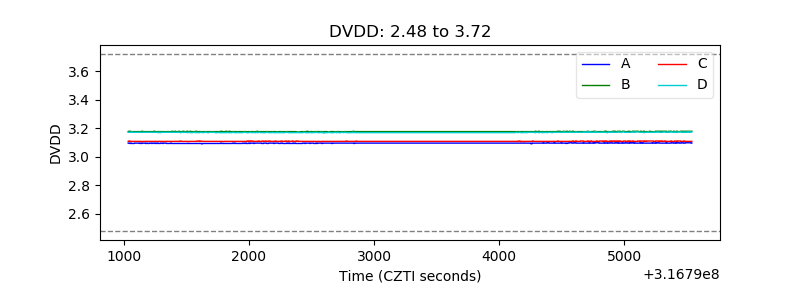 |
| Temperature 1 | 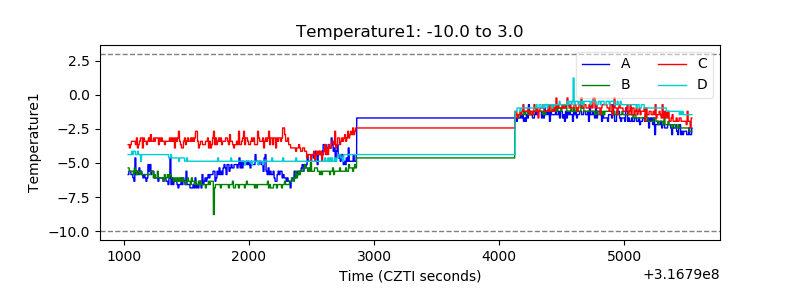 |
| Veto HV Monitor | 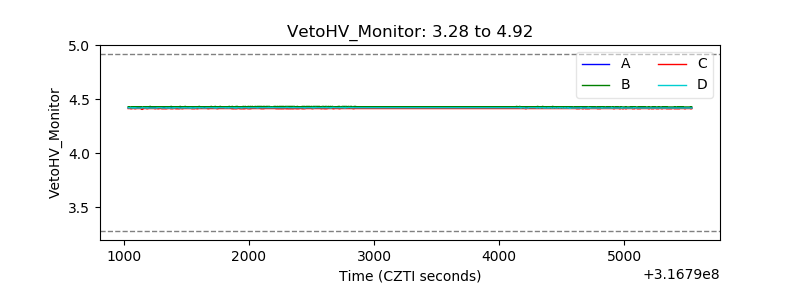 |
| Veto LLD | 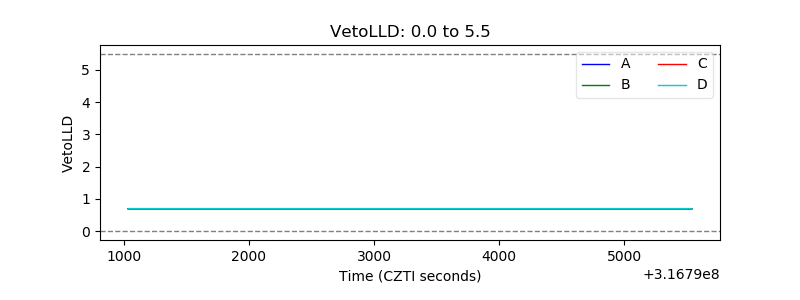 |
| Alpha Counter |  |
| _CPM_Rate | 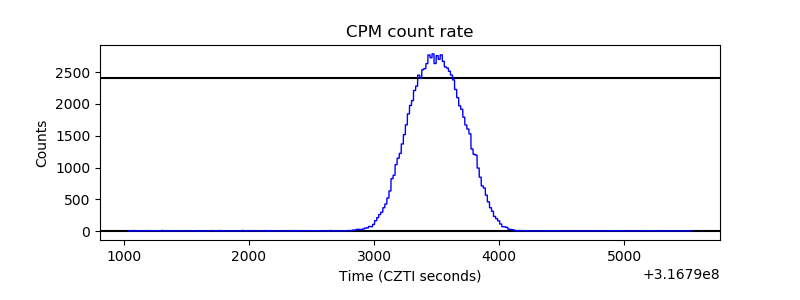 |
| CZT Counter | 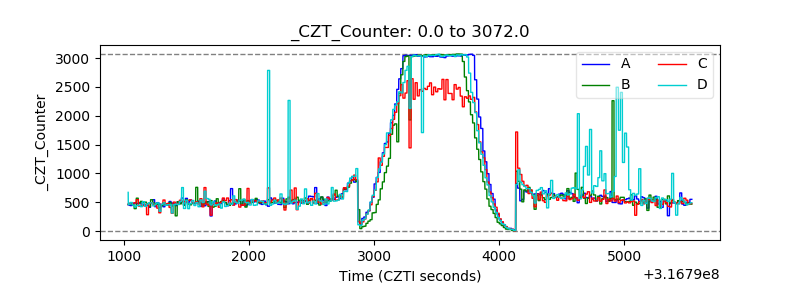 |
| +2.5 Volts monitor |  |
| +5 Volts monitor |  |
| _ROLL_ROT | 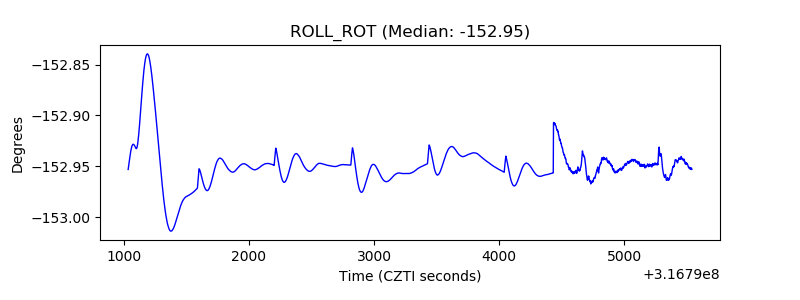 |
| _Roll_DEC | 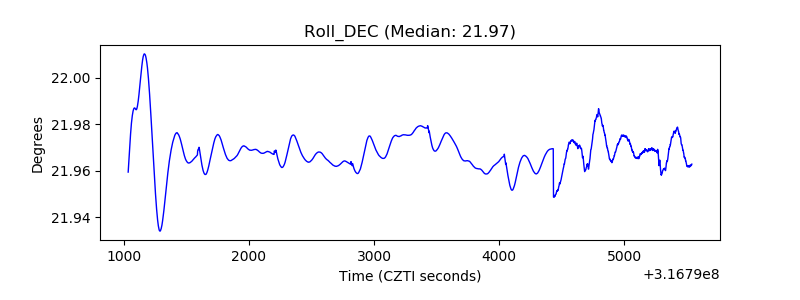 |
| _Roll_RA | 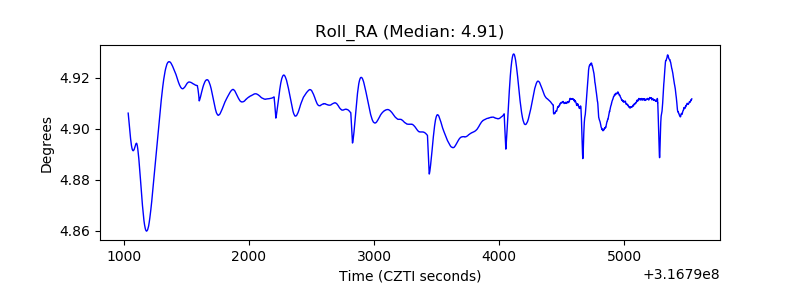 |
| Veto Counter | 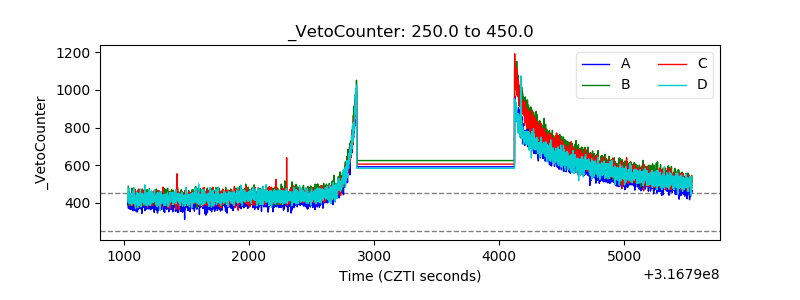 |